
Summary
This report focuses on the first six months of available data from the 2002 - 03 Commonwealth State/Territory Disability Agreement National Minimum Data Set (CSTDA NMDS) collection, covering the period from 1 January 2003 to 30 June 2003. This is the first report since the implementation of the redeveloped CSTDA NMDS collection in 2002.
The most significant change to the collection is that data are collected on all service users rather than just those who accessed a service on a single 'snapshot' day. There are also a number of new data items. These changes significantly improve the power of the information collected. Commencing in 2003 - 04, future annual collections will cover the full financial year.
This report deals with service users and their characteristics, and service type outlets that are funded to deliver CSTDA services. Data on each previous annual collection have been published by the AIHW. For more information, see the reference section of this report and the AIHW website (www.aihw.gov.au).
Data quality issues
The redevelopment of the CSTDA NMDS has meant that the volume and complexity of the data are much greater than in previous snapshot day collections and, as is generally the case with major changes to data collections, this has resulted in some reductions in data quality in the first collection. There are important considerations to keep in mind regarding the quality of data presented throughout this report, most notably response rates and the various 'not stated' rates of data items for service users and service type outlets. These impose limitations on the ability to generalise from the data.
Chapter 3 deals with data quality issues in detail, including outlining the response rates of service type outlets (Table 3.1) as well as the 'not stated' and 'not known' rates of data items (Tables 3.2 - 3.4). 'Not stated' rates of data vary widely between data items and also between states/territories.
It is also important to note that the reporting time frame of six months is unique and thus this report is not comparable to previous reports based on snapshot data nor will it be comparable to future reports that will use whole of year data.
Service users
During the first six months of 2003, an estimated 155,884 service users were recorded as using CSTDA-funded services nation-wide. Victoria had the highest proportion of service users (32%), followed by New South Wales (25%), Queensland (15%), Western Australia (13%) and South Australia (11%) (Table 1.1).
The service users recorded between 1 January and 30 June 2003 accessed a range of service types:
- The most widely accessed service group was employment services, covering open employment and supported employment services, which were utilised by 35% of all service users.
- The second most commonly accessed services were community support, which were accessed by over a third (34%) of all service users. These services include early childhood intervention, specific therapies, counselling and case management services.
- A further 27% used community access services, mainly covering educational, social and daily living activities.
- 19% used accommodation support services, which cover institutional, community and in-home support.
- 11% used respite services, which are facilities providing short-term breaks from caring activities to carers of people with a disability.
| Service group | NSW | Vic | Qld | WA | SA | Tas | ACT | NT | Total | % |
|---|---|---|---|---|---|---|---|---|---|---|
| Accommodation support | 6,907 | 10,212 | 4,298 | 3,335 | 3,352 | 1,066 | 319 | 174 | 29,660 | 19.0 |
| Community support | 13,140 | 13,074 | 7,288 | 9,587 | 8,694 | 1,132 | 360 | 382 | 53,588 | 34.4 |
| Community access | 7,087 | 14,064 | 4,810 | 9,773 | 4,095 | 1,274 | 575 | 261 | 41,925 | 26.9 |
| Respite | 3,594 | 7,206 | 2,857 | 1,538 | 982 | 181 | 244 | 119 | 16,706 | 10.7 |
| Employment | 16,654 | 15,215 | 10,001 | 5,439 | 5,036 | 1,485 | 803 | 373 | 54,952 | 35.3 |
| Total service users | 39,402 | 49,426 | 22,719 | 20,961 | 16,724 | 4,092 | 1,803 | 1,037 | 155,884 | |
| Total per cent | 25.3 | 31.7 | 14.6 | 13.4 | 10.7 | 2.6 | 1.2 | 0.7 | 100.0 |
Notes
- Service user data are estimates after use of a statistical linkage key to account for individuals who received services from more than one service type outlet during the six months. Totals for Australia may not be the sum of the components since individuals may have accessed services in more than one state or territory during the six month period. Service user data were not collected for all CSTDA service types (see Section 2.2 for details). Data quality issues should be considered when interpreting the data in these tables; see Chapter 3 for a detailed discussion of these issues.
- Total includes 177 service users in New South Wales whose service type was not stated.
Sex and age
Overall, 59% (92,692 of 155,884) of service users were male (Table 4.4). There were greater numbers of males than females for all but the oldest age category (70+ years) (Figure 4.1). The age group with the largest number of service users was the 20 - 24 year group, for both males and females.
On the whole, the median age of females was higher than that of males (31.9 years versus 28.8 years). As in the 2002 snapshot day collection, median ages were higher for females than males in every service group, with the largest difference being in community support services (a difference of 5.4 years) (Figure 4.2 and Table A1.5; see also AIHW 2003b).
Disability groups
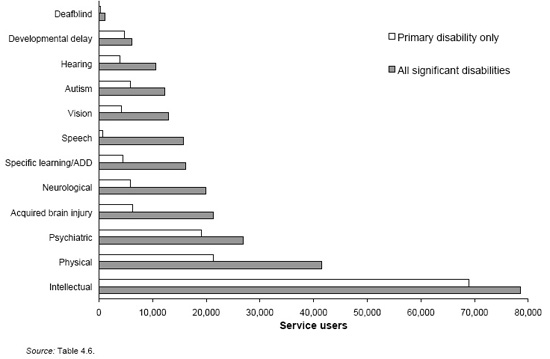
The most commonly reported primary disability group was intellectual, reported by 44% of all service users (Table 4.4). The next most commonly reported groups were physical (14%) and psychiatric disabilities (12%). When all significant disabilities are considered, the overall reporting of disability types is similar (Table 4.6 and Figure 1.1); however, the proportion of some disability types rose sharply (for example, physical disabilities rose from 14% to 27%).
On average, service users reported 1.8 disability groups per person (Table 4.5). Service users reporting a primary disability group of developmental delay had the highest average (2.2), while those with a primary disability of psychiatric had the lowest (1.2).
Figure 1.1: Service users of CSTDA-funded services, primary disability group and all significant disability groups, 1 January–30 June 2003
Indigenous status
Around 3.2% of service users identified as Aboriginal or Torres Strait Islander people (Table 4.7). This proportion ranged from 1.6% in the Australian Capital Territory to 41.4% in the Northern Territory. Indigenous status was not stated or not collected for almost 10% of service users; this rate varied somewhat between states and territories.
Aboriginal and Torres Strait Islander service users were proportionately more likely to access community support and respite services and less likely to access employment and community access service, than indicated by their overall rate (Table 4.9).
Communication method and need for interpreter services
Two-thirds (66%) of service users indicated that their main method of communication was spoken language (Table 4.11). Around 2.4% used sign language, while 1.5% reported effective non-spoken communication. Another 15% indicated that they had little or no effective communication.
Over four-fifths (83%) of all service users indicated that they did not need an interpreter (Table 4.12). Of the remaining 6% who did report a need for interpreter services, most were for non-spoken communication (4% overall), while the remaining 2% reported needing such services for non-English languages.
Support needs
Information was collected concerning service users' overall support needs in each of nine life areas, grouped into three more general areas: activities of daily living (ADL), activities of independent living (AIL), and activities of work, education and community living (AWEC).
For the nine life areas reported, the areas in which service users were most likely to report always needing support (or being able to undertake) were working and education (both 27%) (Table 4.13). On the other hand, the life area most frequently requiring no support was mobility (39%).
Within the three general areas, AWEC had the highest percentage of service users always needing support (39%), followed by AIL (32%) and ADL (28%) (Tables 4.13 and 4.14). Accommodation support service users had the highest proportion of service users requiring support in all three broad areas - ranging from 44% in ADL to 62% in AWEC (Table 4.14).
Service user location
Based on the ABS Remoteness Areas under the Australian Standard Geographical Classification (ASGC), service users were most likely to be located in inner regional areas (9.8 per 1,000 population under 65 years) (Table 4.15). Service users were least likely to be located in very remote areas (5.2 per 1,000). Location analyses were based on the service users' residential postcode.
Income source and labour force status
Just over half (52%) of 'adult' service users (aged 16 years or more) reported the Disability Support Pension as their main income source (Table 4.16). A further 9% reported paid employment, and 7% another pension or benefit. Child income (for service users 15 years or less) was not known, not stated or not collected for almost half (46%) of all service users in that age group (Table A1.1).
Of the 125,326 service users aged 15 years or more, 38,186 (31%) reported a labour force status of employed, 21,973 (18%) unemployed, and 42,810 (34%) not in the labour force. Labour force status was not stated or not collected for a further 18% (Table 4.17).
Living arrangements and residential setting
Over half of all service users (55%) reported living with their families, 20% with others, and 13% alone (Table 4.20). Service users accessing employment and accommodation support services were most likely to report living alone (19% and 17% respectively). Around 69% of service users reported living in a private residence (Table 4.21).
Presence of an informal carer
Data on informal carers were collected for the first time in the 2002 - 03 CSTDA NMDS. Approximately 44% of service users indicated that they had an informal carer, such as a family member, friend or neighbour, providing care and assistance on a regular, sustained basis (Table 5.1). A further 45% indicated they did not have such a carer. The proportion of male and female service users reporting the presence of an informal carer were similar (44% and 45% respectively) (Table 5.2).
Carers were reported by a relatively high proportion of service users in respite (87%) and community support (68%) services (Table 5.3). This partly reflects the young age profile of these two groups, and the fact that the youngest age groups had by far the highest proportion of service users with a carer (77% for those under 15 years; 48% for 15 - 24 year olds) (Table 5.5).
Service users reporting the presence of an informal carer had much higher support needs in ADL compared with those not reporting a carer - 39% reported always needing support versus 21% without carers (Table 5.4). Service users in very remote areas were by far the most likely to report the presence of a carer (72%), followed by remote (59%) and outer regional areas (51%), compared to around 45% in other areas (Table 5.6).
Age and relationship of informal carers
Just over two-thirds (68%) of carers were reported to be the mother of a service user (Table 5.7). Of the 58,356 carers whose age group was reported, 5,853 (10%) were aged over 65 years, 24,129 (41%) were aged 25 - 44 years, while 18,908 (32%) were aged 45 - 64 years (Table 5.8). Of the 24,129 carers aged between 25 and 44 years, 17,373 (72%) were caring for service users aged under 15 years. Carers aged 15 to 24 years were also most likely to be caring for those in the under 15 years age group (60%), while most carers aged 65 years or more were mainly reported as caring for service users aged 25 - 44 years (45%) or 45 - 64 years (30%) (Table 5.9).
Over four-fifths (82%) of service users with informal carers reported that these were primary carers (assisting with self-care, mobility or communication needs) (Table 5.10). A similar percentage (80%) reported that they lived in the same residence as their carer (Table 5.11).
Service usage
Just over a quarter (26%) of service users accessed more than one service type outlet in the six-month period (Table 6.1). Service users in accommodation support services were most likely to access another service type (59%) and those in employment services (19%) least likely (Table 6.2). The most common combination of service groups accessed was accommodation and community access (Tables 6.3 and 6.4). Within specific service types, the most common combination was that of therapy support and case management (Table 6.5).
The mean duration for service users in accommodation support services over the six-month (181 day) period was 136 days, ranging from 119 days in hostels to 163 days in small residentials/institutions (Table 6.8). During the six-month period, 9% of service users reported an exit date (Table 6.11). Of these, 31% exited due to no longer needing assistance (7% moving to a mainstream service, the remainder for other reasons), 15% terminated the service, and 15% had a reason other than those listed.
Service type outlets
There were 10,053 service type outlets recorded as providing CSTDA-funded services during 2002 - 03 (Table 7.1). Of these, around 71% were recorded as being non-government provided services. As per the service user numbers, the largest proportion of state/territory-funded service type outlets was found in Victoria (38%), followed by New South Wales (28%) and Queensland (15%) (Table 7.2). The vast majority of Australian Government-funded outlets (90%) provided employment services (Table 7.3).
Operating hours per day for most service type outlets were reported as either 7 to 9 hours (42%) or 24 hours (28%) (Table 7.4). Most outlets operated for a full seven-day week (45%) or a five-day working week (37%) (Table 7.5). Three-quarters (75%) of outlets reported operating for 52 weeks a year (Table 7.6).
Government expenditure
Government expenditure on CSTDA-funded services during 2002 - 03 totalled $2.98 billion (Table 1.2). This figure drops to $2.74 billion if identified administration expenditure is excluded. Amounts paid to state/territory governments by the Australian Government are included in state/territory totals for this table.
Accommodation support services received the largest amount of funding, accounting for $1,526 million or 51% of the total expenditure on CSTDA services. Community access services received $360 million (12%), community support $298 million (10%), employment $274 million (9%), respite $172 million (6%), 'other' support services $67 million (2%), and advocacy, information and print disability $37 million (1%). A further $245 million (8%) went towards administrative costs.
| Service group $ million |
NSW | Vic | Qld | WA | SA | Tas | ACT | NT | Aus Gov | Australia |
|---|---|---|---|---|---|---|---|---|---|---|
| Accommodation support | 563.14 | 463.08 | 171.07 | 137.52 | 111.83 | 46.78 | 20.98 | 11.13 | 0.00 | 1,525.54 |
| Community support | 72.23 | 94.92 | 38.39 | 44.61 | 25.49 | 6.93 | 8.21 | 7.42 | 0.00 | 298.19 |
| Community access | 112.95 | 144.02 | 49.90 | 18.77 | 12.81 | 11.26 | 2.85 | 1.97 | 5.51 | 360.04 |
| Respite | 61.21 | 41.87 | 30.56 | 17.68 | 7.29 | 4.91 | 2.74 | 1.13 | 4.38(a) | 171.77 |
| Employment | 0.00 | 0.00 | 0.00 | 0.00 | 0.00 | 0.00 | 0.00 | 0.00 | 274.20 | 274.20 |
| Advocacy, information and print disability | 6.59 | 6.30 | 4.66 | 1.68 | 2.41 | 1.58 | 0.45 | 0.11 | 12.88 | 36.67 |
| Other support | 2.02 | 31.55 | 3.95 | 9.12 | 12.12 | 0.86 | 0.76 | 0.07 | 6.75 | 67.19 |
| Subtotal | 818.14 | 781.73 | 298.53 | 229.39 | 171.94 | 72.32 | 35.99 | 21.83 | 303.71 | 2,733.59 |
| Administration | 88.00 | 70.23 | 26.32 | 12.75 | 12.05 | 5.65 | 4.10 | 1.02 | 25.06 | 245.18 |
| Total | 906.14 | 851.96 | 324.85 | 242.14 | 183.99 | 77.98 | 40.09 | 22.85 | 328.77 | 2,978.77 |
- Australian Government-funded respite services are not funded under the CSTDA.
Source: SCRCSSP 2004, Table 13A.20.
Outline of the report
Chapter 2 introduces and describes details of the data collection and how it was conducted, as well as providing key definitions.
Chapter 3 deals with data quality issues and response rates affecting the 2002 - 03 data. Chapter 4 gives a detailed description of service user characteristics, dealing with the majority of service user data items.
Chapter 5 deals with data relating to informal carers, a new feature of the CSTDA NMDS collection in 2002 - 03. Chapter 6 relates to service usage, including an analysis of multiple service use, hours received data items, staff hours, and service exit data.
Chapter 7 presents data on service type outlets in 2002 - 03.