Comparison of disease expenditure and disease burden
Ill health has a substantial impact on the human cost of suffering and premature death, and the financial cost of health services.
This report along with the Australian Burden of Disease Study 2023 (AIHW 2023a) estimate the costs of different types of health conditions.
By looking at both the financial and human cost of diseases and injury, we gain a better understanding of the full impact of diseases.
What do we mean by ‘human cost’?
The human cost of particular diseases can be measured through burden of disease analysis. This looks at the impact of different diseases and injuries on a population and helps us to understand the impact of these conditions in terms of ‘years of healthy life lost’.
Losing healthy years can occur in two ways: through premature death (the fatal burden), or through living with the impacts of a disease (the non-fatal burden). Looking at these two measures together provides an overall understanding of the total burden, or human cost of disease and injury.
It is estimated that 5.6 million years of healthy life were lost due to Australians living with or dying prematurely from disease and injury in 2023 (AIHW 2023a).
Which disease groups have the greatest impact in terms of spending and burden?
Both burden of disease reporting and disease expenditure reporting provide two different lenses through which we can consider the impact of diseases.
Of all disease groups, cancer had the greatest human cost (highest share of total disease burden measured as the share of total disability adjusted life years (DALY)) in 2023 and was also responsible for the most spending in 2022–23.
Figure 17 shows a comparison of spending on each of the Australian Burden of Disease groups in 2022–23 with the share of total disease burden for each disease group in 2023. Mental health conditions and substance use disorders ranked second highest in terms of disease burden but only sixth highest in terms of spending.
Figure 17: Spending vs burden for each Australian Burden of Disease Group
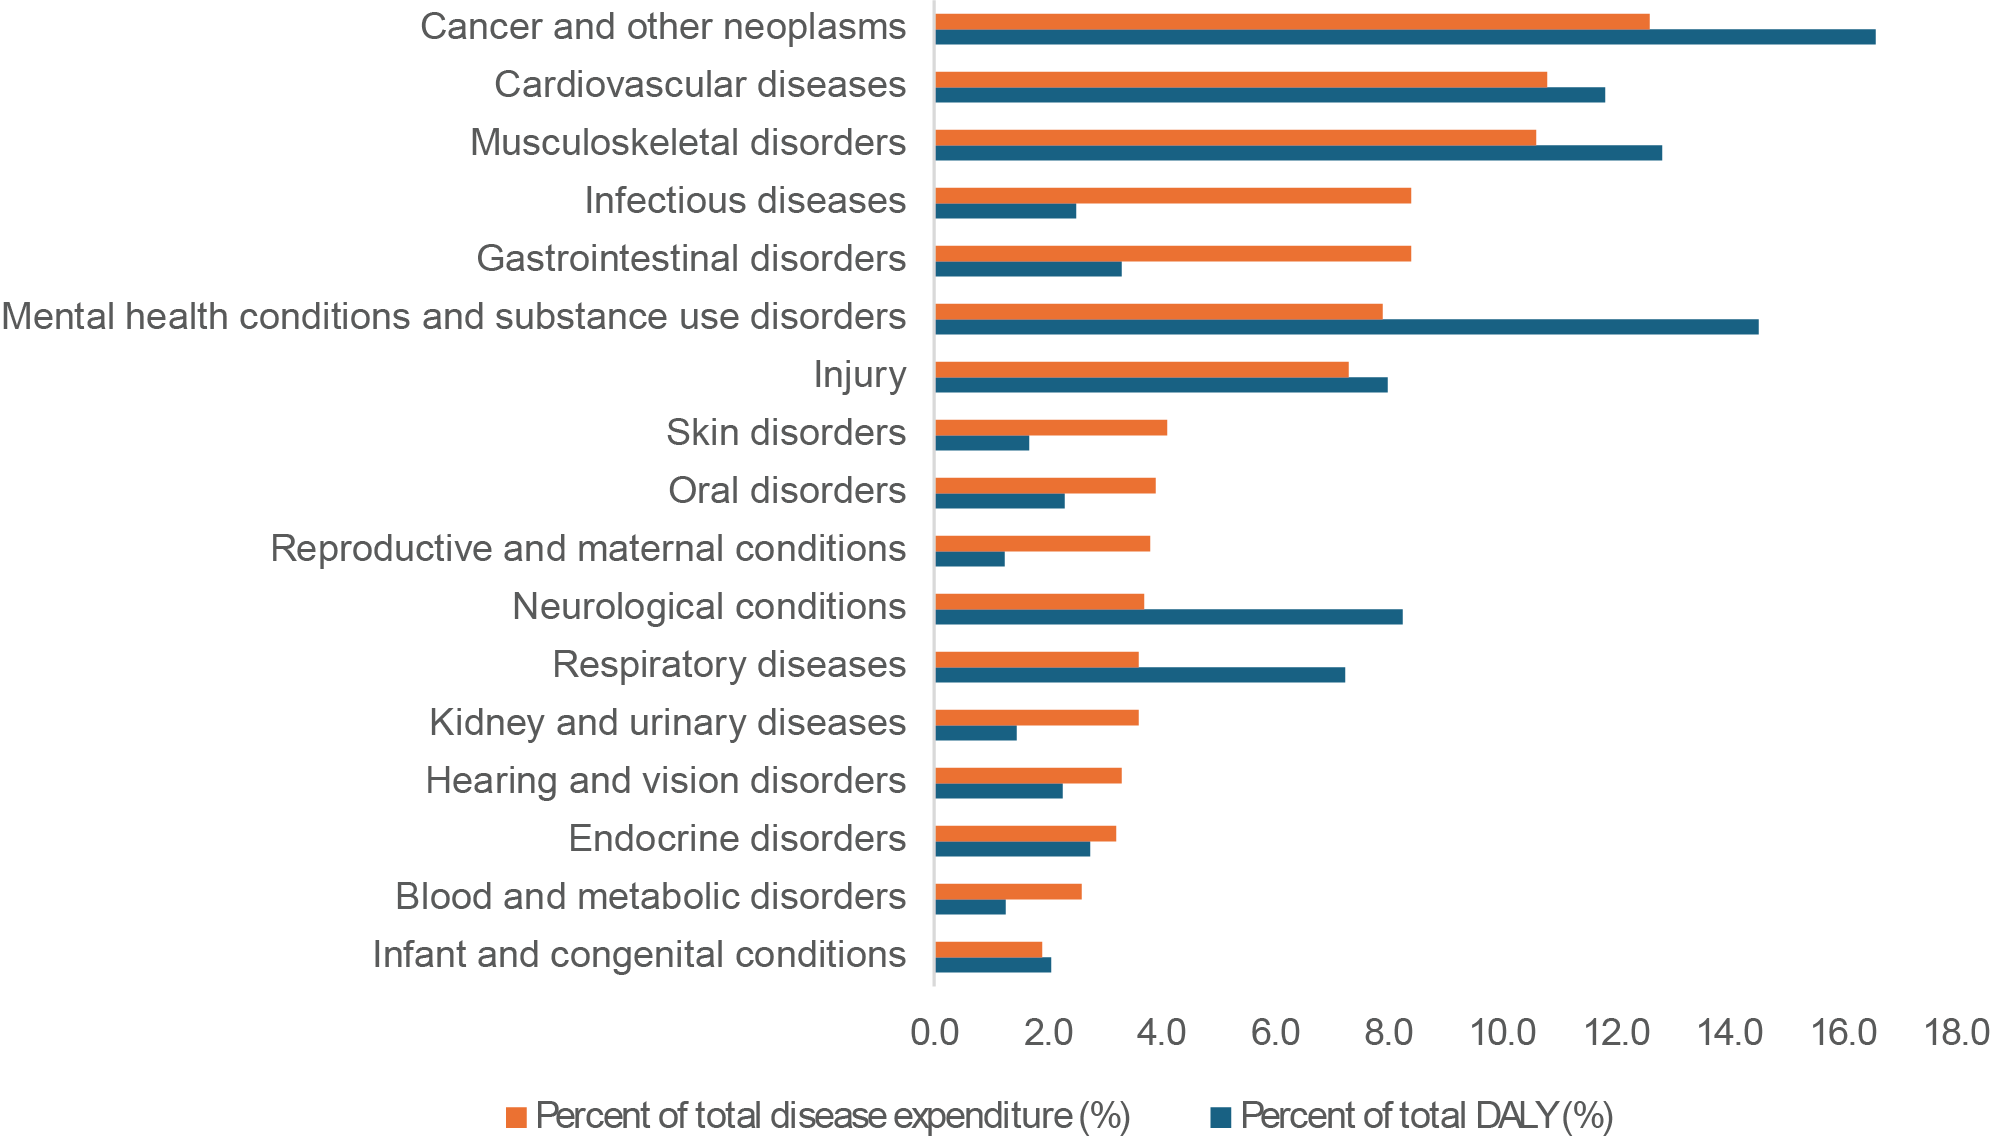
Notes: Disease expenditure in this chart excludes spending on well care, treatment of risk factors and examination and observation NEC.
Sources: AIHW Disease Expenditure database; AIHW 2023a.
Both measures provide insights into the impact of diseases on our society. By considering multiple sources of data, governments and service providers have better evidence to help them identify priorities and develop policies and strategies to meet the needs of those affected.
It is important to note, however, that diseases and their effects on people, society and the health system are complex. There can be many reasons why a disease may have a large human cost but low health spending – and vice versa.
In cases where a particular disease has relatively high human cost but low spending, it does not necessarily mean that health spending should be increased. Road transport injuries or smoking related diseases, for example, may be also addressed by investments and responses outside the health system, such as through education, transport, environmental health or other social services.