
Summary
Ear and hearing health is vital for overall health and quality of life. Ear disease and associated hearing loss can have long-lasting impacts on education, wellbeing and employment.
Aboriginal and Torres Strait Islander children are more likely than non-Indigenous children to experience ear and hearing problems. A number of factors contribute to the poorer ear and hearing health of Indigenous children, including lack of access to health services, household overcrowding and second-hand smoke exposure. Since 2012, the Australian Government has funded the Northern Territory Government to deliver hearing health outreach services available to more than 31,500 Indigenous children and young people aged under 21 in the Northern Territory.
This report presents new data for the Hearing Health outreach services for 2019. It focuses on services provided in 2019 and produces time trends between July 2012 and December 2019. Throughout this report, links to the supplementary tables relate to the figures presented. Supplementary tables are available from the Data page.
How many children received services?
- In 2019, 137 training sessions for hearing health education, promotion and prevention activities were provided to health-care staff.
- A total of 1,921 children and young people received at least 1 audiology, Clinical Nurse Specialist (CNS) or ear, nose and throat (ENT) teleotology service in 2019. From July 2012 to December 2019, a total of 29,930 services were provided to more than 8,000 children and young people, an average of 3 services per child and young person.
- In 2019, 2,156 outreach audiology services were provided to 1,896 children and young people. From July 2012 to December 2019, a total of 16,524 services were provided to a total of 7,899 children and young people, an average of 2 services per unique service recipient.
-
770 ENT teleotology services were provided to 709 children and young people. From July 2012 to December 2019, a total of 6,841 services were provided to a total of 3,609 children and young people, an average of 2 services per unique service recipient.
- CNSs conducted 1,119 visits to 1,008 children. From July 2012 to December 2019, a total of 6,515 services were provided to a total of 4,521 children, an average of about 1 visits per unique service recipient.
Figure 1: Number of children and young people who received audiology, CNS or ENT teleotology service in 2019
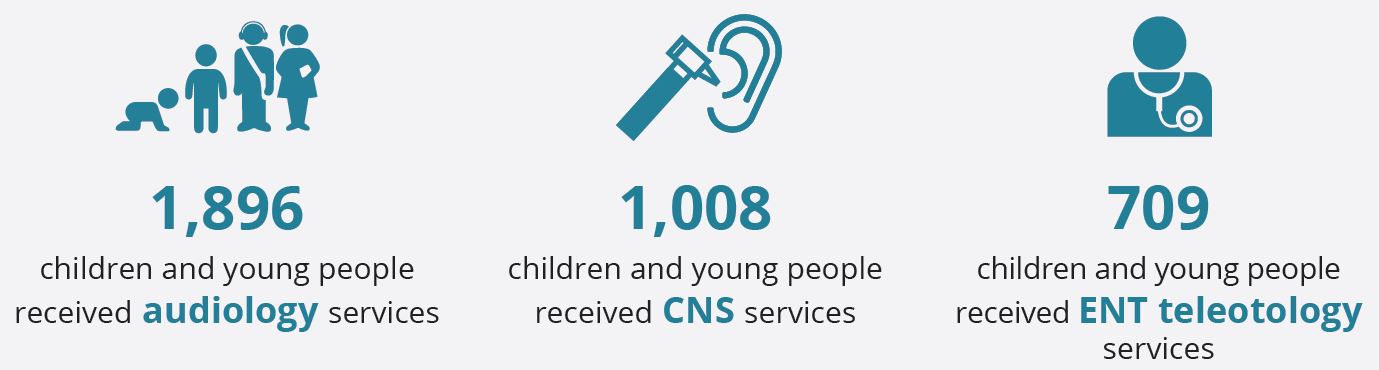 Sources: tables S2.1, S2.3 and S2.5.
Hearing health is improving among children and young people who have received hearing health outreach services between 2012 and 2019
The percentage of children and young people with at least 1 ear disease decreased by 4 percentage points, from 66% (483 among 727 children and young people) to 62% (1,188 among 1,921 children and young people) .
The percentage of children and young people with hearing loss decreased by 13 percentage points, from 55% (388 of 791 children and young people) to 42% (793 of 1,893 children and young people).
Figure 2: Ear and hearing health improvements between 2012 and 2019:
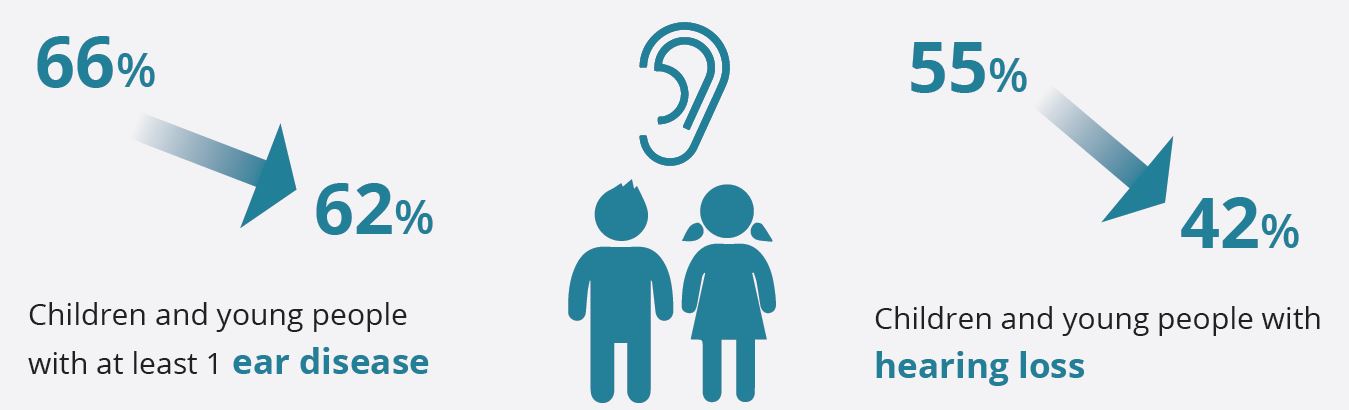 Sources: tables S3.1 and S3.6.
Among 3,480 children who received at least 2 services between 2012 and 2019 and who had hearing loss at their first service, more than 1,550 (61%) had improved—a change from bilateral to unilateral hearing loss or from unilateral hearing loss to no hearing loss.
Among 1,647 children who had hearing impairment at their first service, 1,165 (71%) had improved—moving to a lower degree of hearing impairment or to no hearing impairment.
Many children and young people are still waiting for hearing health services
At December 2019, there were 3,459 children and young people on the audiology waiting list. Among them,1,726 were new referrals and 1,733 were recalled for further follow-up after receiving an initial audiology service. There were 2,458 children and young people on the waiting list for ENT teleotology services. Among them, 1,025 were new referrals and 1,433 were recalled for further follow-up after receiving initial ENT teleotology services. Is the Hearing Health Program meeting its benchmarks?
The annual benchmark for hearing health service delivery is measured by the number of services per year. From 2012 to 2019, service delivery targets for audiology services, CNS services and health promotion services were either met or exceeded.
Health outcomes in this program are measured every 3 years (July 2012–June 2015, July 2015–December 2018 and January 2019–June 2021). All benchmarks in the first 2 periods were met. As 2019 is the first year of the new period, the information in this report is based on the data from 1 year only and does not indicate whether the benchmarks have been met or not (Table 1).
The progress against benchmarks in 2019 is presented in Table 1.
|
2019–2021 Target |
Outcome in 2019 |
|---|---|
|
At least 1,700 audiology services per year |
2,156 audiology services provided |
|
At least 700 children receiving CNS services per year |
1,008 children received CNS services |
|
At least 60 hearing health promotion or training services/activities per year |
137 preventative hearing health promotion or training services and activities provided in 2019 |
|
Less than 7.5% of children tested with moderate/ severe conductive hearing impairment during 2019–2021 |
4% of children tested with moderate/severe conductive hearing impairment, January–Dec 2019 |
|
Less than 7% of children (0–5) with CSOM during 2019–2021 |
8% of children (0–5) with CSOM, January–Dec 2019 |
|
Less than 7% of children (6–15) with CSOM during 2019–2021 |
7% of children (6–15) with CSOM, January–Dec 2019 |
|
Less than 5% of children (0–5) with dry perforation 2019–2021 |
7% of children (0–5) with dry perforation, January–Dec 2019 |
|
Less than 9% of children (6–15) with dry perforation 2019–2021 |
16% of children (6–15) with dry perforation, January–Dec 2019 |
Note: CSOM = Chronic Suppurative Otitis Media