Overview of spending by demographics and injury type
In 2018-19, total injury spending was $11.2 billion. It was estimated that $1.2 billion was spent treating injuries caused by physical activity (around 11% of total injury spending). This includes spending across hospital services, primary health care services and referred medical services.
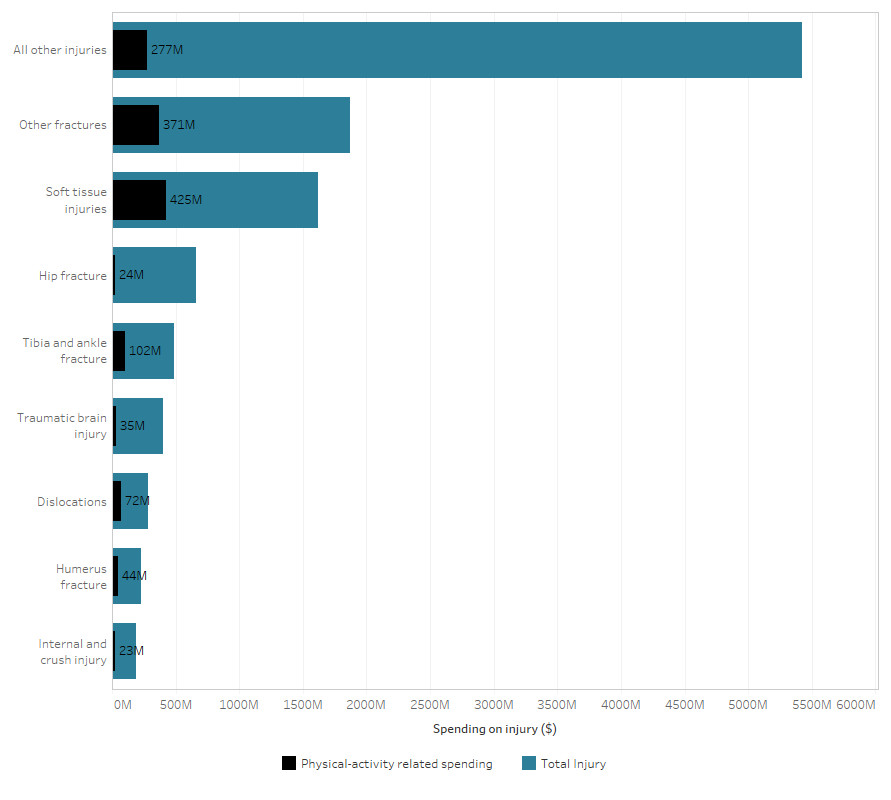
Around a third of this spending was for soft tissue injuries ($416 million), followed by other fractures ($313 million) and tibia and ankle fractures ($83 million).
The injury types with the highest proportion of total spending due to activity were soft tissue injuries (26%), dislocations (24%) and tibia and ankle fractures (17%).
Figure 1: Total spending and cost due to physical activity, by injury type, 2018-19
This stacked bar chart shows the spending from sport and total injury spending for each injury type.

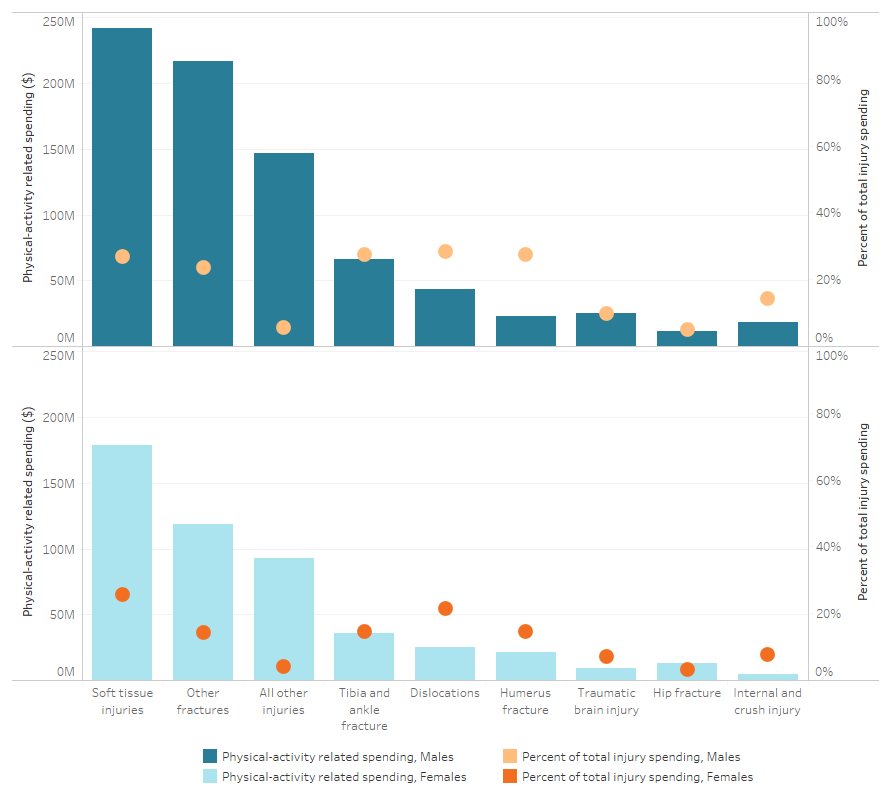
Males had higher injury spending from physical activity and a higher proportion of total injury spending due to activity than females. Male spending on physical activity injuries was $686 million (12% of total male injury costs), while female spending was $414 million (8% of total female injury costs).
The proportion of total injury spending from physical activity was higher for males than females for all types of injuries. The difference was greatest for humerus fracture, tibia and ankle fracture, and other fractures, around 9 to 13 percentage points higher than females.
Figure 2: Physical activity related injury spending by injury type and sex, 2018-19
This bar chart shows total injury spending for males and females by type of injury, and the percent of injury spending that is due to sport and physical activity.

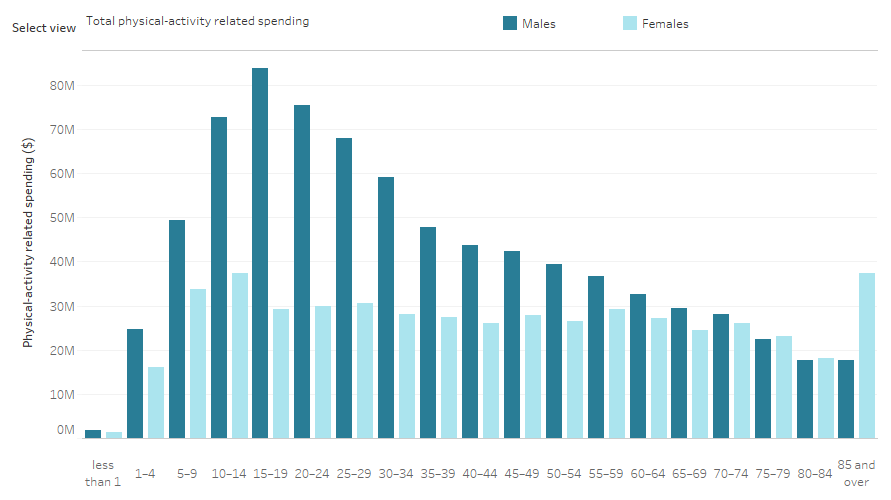
Spending on sports injuries was highest at younger ages, particularly for young males. Around $60-75 million was spent for males in each age group between the ages of 10 to 29. Sports injuries accounted for 15% to 25% of all injury spending for males between the ages of 5 to 19. For females, spending and the proportion of all injury spending due to sports injuries was highest between 5 to 14 years. For both males and females, sports injury spending decreased steadily from age 30 onwards.
On a per person basis, around $44 was spent treating and managing sports injuries for Australians in 2018-19. For males, this was $55 per person and for females was $33.
Figure 3: Physical activity related injury spending by age group and sex, 2018-19
This chart shows total injury spending, injury spending attributed to sport and physical activity, and the percent of total injury spending attributed to sport and physical activity, for males and females in 5-year age groups.

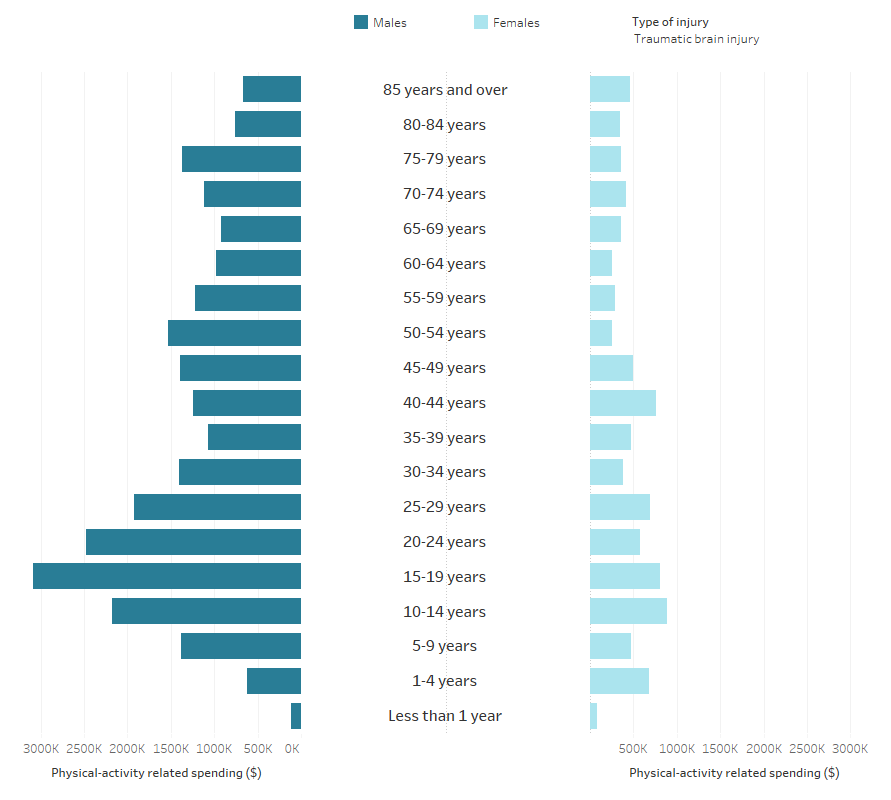
Below is an interactive data visualisation tool, where you can find estimates of health system spending by type of injury, age, and sex. This information is also available to download as an Excel workbook.
Figure 4: Interactive: physical activity related spending on injury, by type of injury, age, and sex, 2018-19
This interactive chart shows sport and physical activity related injury spending for males and females, by 5-year age group and type of injury.


