Spending by health system area
In 2018–19, total health spending was estimated at $195.4 billion, approximately $7,764 per person (AIHW 2021). This analysis estimated that $1.2 billion of health spending related to injuries due to physical activity, around $44 per person.
The areas of spending in this analysis include hospital services, primary health care services and referred medical services (generally provided by medical specialists). Hospital services include public and private admitted patient services, public hospital emergency departments, and public hospital outpatient clinics. Primary health care includes general practitioner services, allied health services, pharmaceuticals and dental. Referred medical services include specialist services, medical imaging, and pathology. Due to data availability in the primary health care sector, these estimates are biased towards spending in hospitals, and estimates should be interpreted with this in mind.
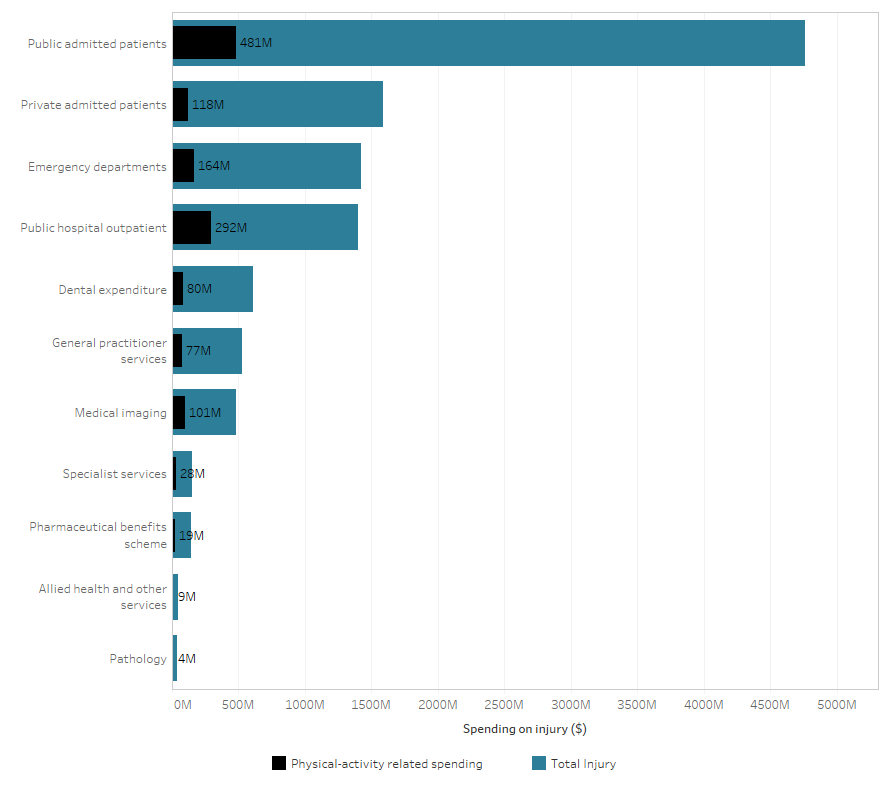
Spending for public hospital admitted patients accounted for almost a third of all physical activity related injury spending ($352 million), followed by outpatient clinics ($292 million) and emergency departments ($116 million). The areas with the greatest proportion of total injury costs due to physical activity were public hospital outpatient (21%), medical imaging (21%), and allied health and other services (20%).
Figure 5: Physical activity related injury spending, total injury spending, and percent of total due to physical activity, by area of spending, 2018-19
This stacked bar chart shows the spending from sport and total injury spending in each area of the health system.

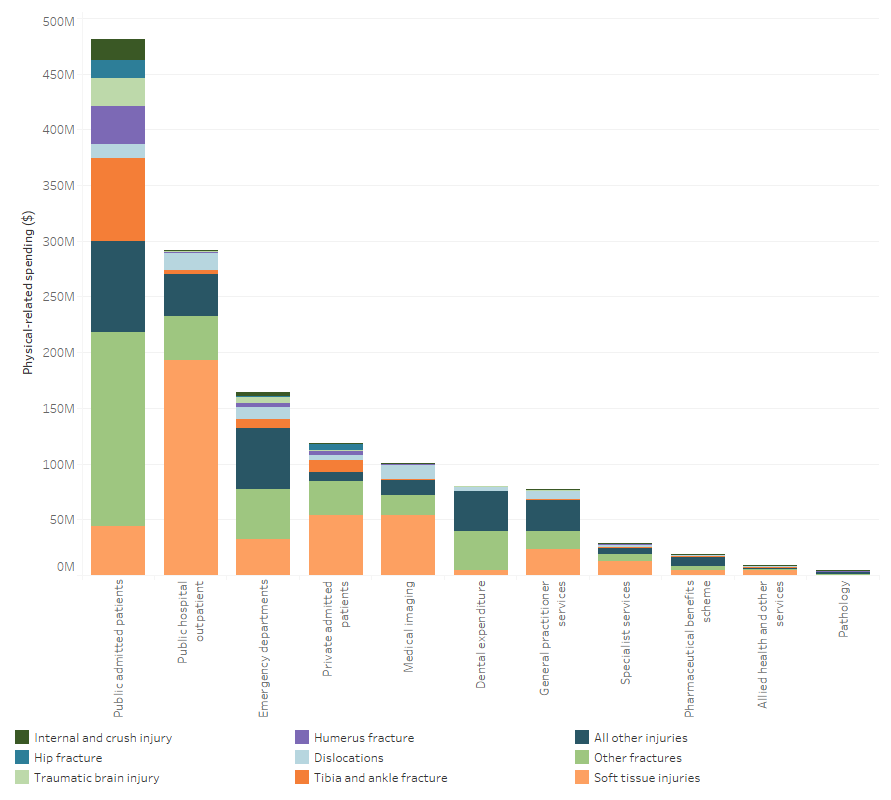
The types of injuries treated vary between treatment locations. Over half of public admitted patients spending related to treating fractures (61%), while the majority (66%) of outpatient clinic spending was on soft tissue injuries. Soft tissue injuries were also the main cause of spending for medical imaging (53%) and private admitted patients (50%).
Figure 6: Physical activity related injury spending area of spending and type of injury, 2018-19
This stacked bar chart shows the spending from sport and total injury spending in each area of the health system.

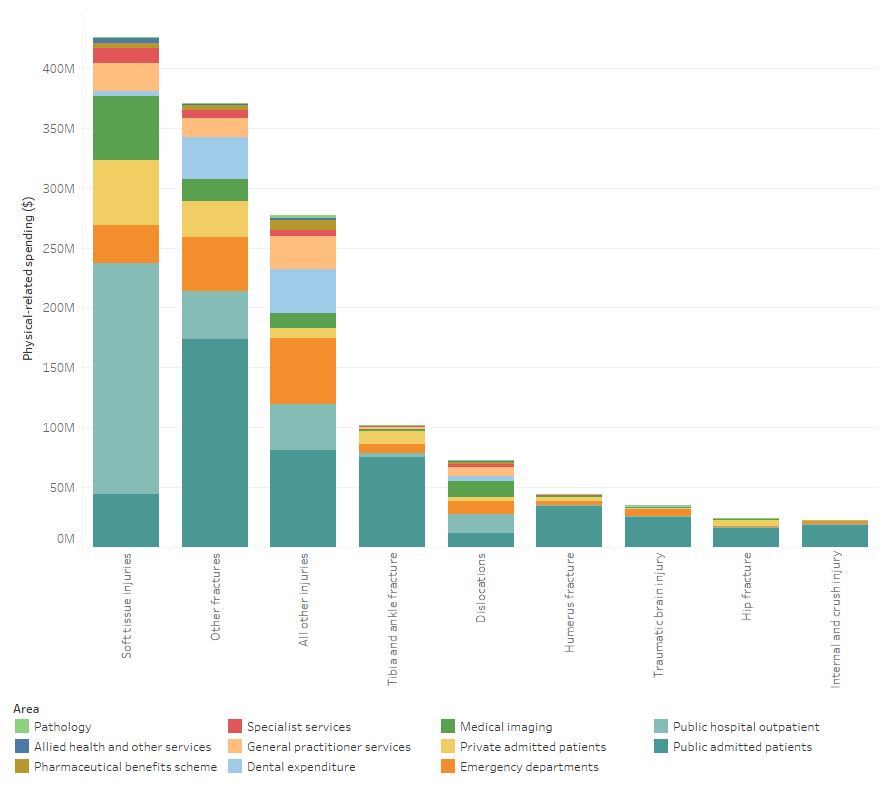
The treatment location of injuries varied substantially by injury type. For dislocations, spending was relatively similar across areas, with around 10% to 15% of spending in emergency departments, medical imaging, public hospital admitted patient, and public hospital outpatient. Over 70% of all spending was for public hospital admitted patients for internal and crush injury (83%), tibia and ankle fracture (72%), and traumatic brain injury (70%). For soft tissue injuries, 46% of spending was in public hospital outpatient clinics, and 10% to 13% was on medical imaging, private admitted patients, and public admitted patients.
Figure 7: Physical activity related injury spending by type of injury and area of spending, 2018-19
This stacked bar chart shows the spending in each treatment area for sport and physical activity injuries by type of injury.

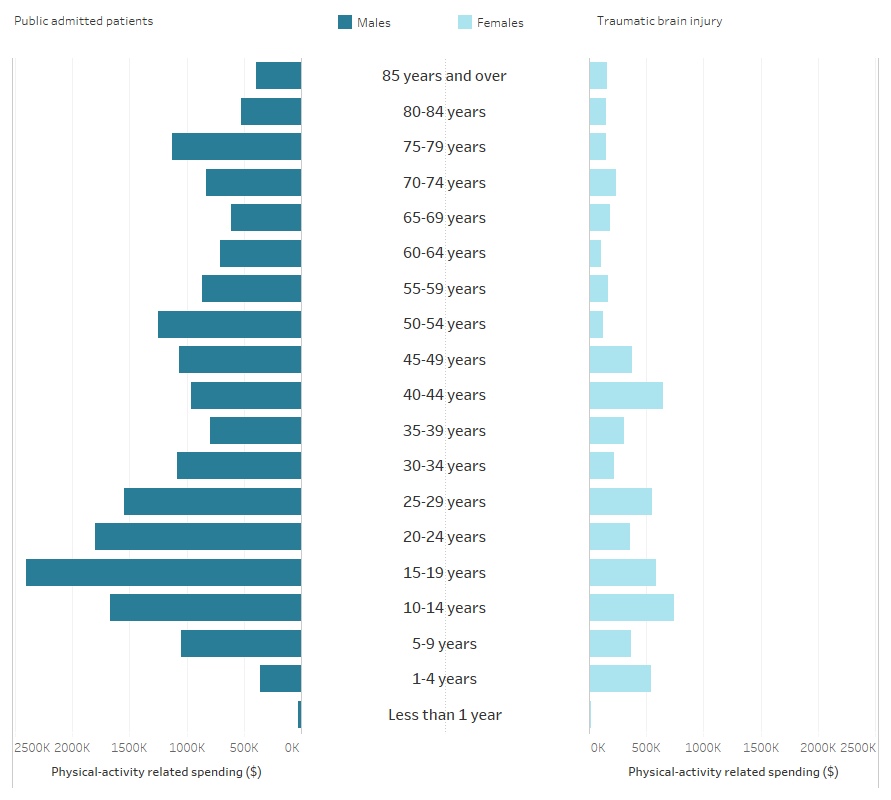
Below is an interactive data visualisation tool, where you can find estimates of health system spending by area of spending, type of injury, age, and sex. This information is also available to download as an Excel workbook.
Figure 8: Interactive: physical activity related spending on injury, by treatment location, type of injury, age, and sex, 2018-19
This interactive chart shows sport and physical activity related injury spending for males and females, by 5-year age group, type of injury, and treatment location.

Australian Institute of Health and Welfare (2021) Disease expenditure in Australia 2018-19, AIHW, Australian Government.


