Trends in deaths
Proportion vs. age standardised rate
The proportion of total deaths shows how much a cause contributes to all deaths.
The age-standardised rate shows how common deaths are after accounting for age differences between time points.
Age standardised rates are important to answer the question: Is a cause of death becoming more common because the population is ageing or could it be due to something else? See Interpreting mortality rates for more information.
Trends in the last decade
There has been a decrease overall in the age-standardised death rate across the last decade. Between 2015–2024, the age-standardised death rate:
- decreased by 8% (from 553 to 508 deaths per 100,000)
- decreased more for males than females (–55 and –38 deaths per 100,000 respectively), narrowing the rate difference between the sexes (Table S4.1).
Dementia now the leading cause of death
There have been changes to the leading causes of death over the last decade both gradually, and in the more recent years.
The number of deaths due to dementia (including Alzheimer’s disease) (dementia) has been increasing over time (Table S4.2). In 2024 dementia became the leading cause of death overall (see Change in leading cause of death). Prior to 2024, coronary heart disease was the leading underlying cause of death.
In 2022, COVID-19 became the first infectious disease since 1970 to be in the leading 5 causes of death (see Mortality in the context of a pandemic).
For males, over the last decade:
- while coronary heart disease remained the leading cause of death, the death rate reduced by 30% between 2015–2024
- dementia overtook lung cancer as the second leading cause of death
- diabetes increased in rank, but the death rate remained the same (19.9 deaths per 100,000)
For females, over the last decade:
- dementia became the leading cause of death
- cerebrovascular disease remained the 3rd leading cause, but the death rate decreased by 35%
- coronary heart disease, lung cancer and colorectal cancer fell in rank.
Figure 5.1: Changes in leading 10 underlying causes of death in Australia, by sex, 2015–2024
The bump chart shows that 9 of the 10 leading causes of death in 2015 were still in the top 10 in 2024 for persons, with some causes shifting in rank.

While the types of leading causes remained relatively unchanged across the last decade, many had changes to the rate. Between 2015–2024, the death rate:
- increased for dementia and accidental falls, reflecting an ageing population (see Age at death).
- decreased for coronary heart disease (–35%), cerebrovascular disease (–33%), lung cancer (–18%) and COPD (–11%) (see Figure 5.2).
During 2022 there was a small (5%) increase in the mortality rate for coronary heart disease. This should be considered in the context of higher overall mortality for 2022 (see Mortality in the context of a pandemic). Rates declined by 15% from 2022 to 2024 and are now lower than the pre-pandemic years for both males and females.
For more information about dementia, see Dementia in Australia.
Figure 5.2: Age-standardised death rates in Australia, selected leading causes of death, 2015–2024
The line chart shows that over the past decade, death rates for most leading causes declined, except for dementia including Alzheimer’s disease, which increased slightly.

Historic trends
Mortality rates are generally presented as either crude or age-standardised. Both measures provide valuable insights.
Crude rates represent the number of deaths in the population at a specific time period. Crude rates provide a snapshot of what is happening in the population, without any adjustments.
Age-standardised rates are useful for comparing between populations that have different age structures, such as between different time periods or geographical locations. Age-standardisation converts the populations of interest to a ‘standard’ structure (based on the 2001 Census), to remove the effect of different age structures. Standardising the age structure allows for less biased comparisons between the populations.
Why are age-standardised rates important?
Age-standardisation makes death rates comparable by removing the effect of different age structures. It reflects what the death rate would be if populations had the same age profile.
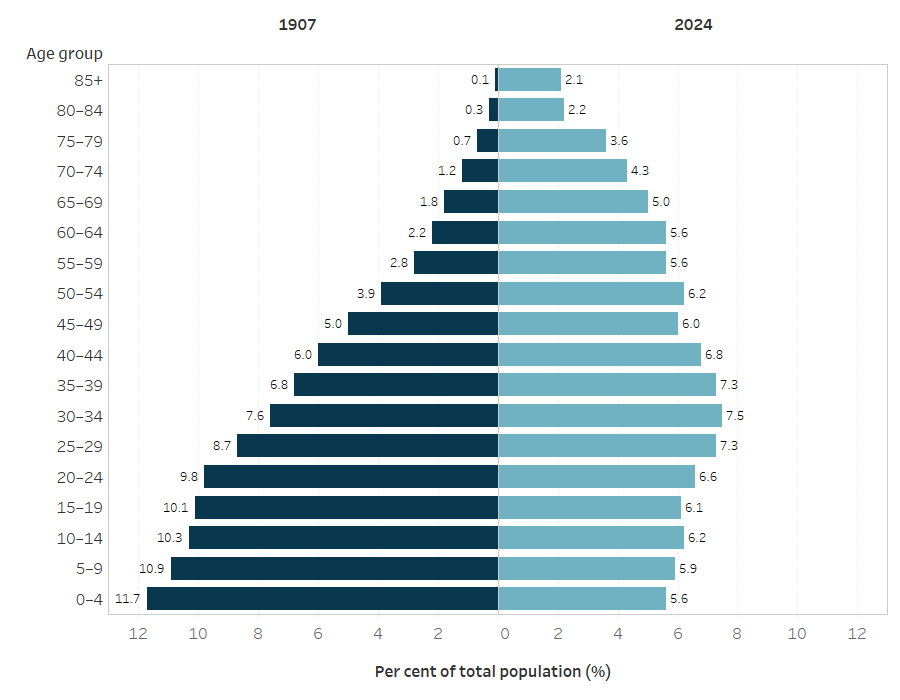
In this report, rates are provided from 1907 to 2024. The age profile of the population was very different in 1907 compared to 2024 (see figure below). In 1907, there were more younger people, with the highest proportion of the population aged 0–4. This has changed over time, and in 2024 the population proportion of younger people is lower. The proportion of middle and older ages continues to increase (known as an ageing population).
Figure: Age distribution of the Australian population 1907 and 2024
Source: Australian estimated resident population are sourced from the ABS reports: National, state and territory population, and Historical population. Population data from 1907–2024 is available in the General Record of Incidence of Mortality (GRIM) books.
Older populations naturally have more deaths. Crude death rates can rise or fall more slowly simply because more people are in older, higher-risk age groups. If we compare crude rates between 1907 and 2024, it can understate the improvements in health and mortality outcomes. In modern Australia, death is much more common at older ages (see Age at death). By standardising the age structure to compare the two groups, it separates population ageing from actual change in mortality risk.
This is the same when using age-standardised rates across different population groups (such as between socioeconomic areas, remoteness areas, or when comparing data for First Nations people and non-Indigenous people). Many population sub-groups are more likely to have specific age structures. Standardising the age structure reduces any age biases within the populations, to allow for more comparability.
When adjusting for changes in the age profile, there has been a significant decline in overall death rates in Australia (see Interpreting mortality rates). Between 1907 and 2024, the age-standardised death rate fell by:
- 73% for males (from 2,234 deaths to 599 deaths per 100,000)
- 77% for females (from 1,844 deaths to 427 deaths per 100,000) (Figure 5.3).
Death rates have historically been higher for males than for females; however, the gap has been closing over time.
While Australia now has more older people (see Interpreting mortality rates), the age-standardised death rate shows that the risk of dying at a given age has fallen substantially over the last century (Figure 5.3). Overall, the Australian population has become both older, and more likely to survive ill-health and injury, at the same time. The decline in death rates over the last century (see Figure 5.3) is associated with a range of factors including:
- control of infectious disease and better hygiene and nutrition in the first half of the last century
- improvements in road safety measures, falls in smoking rates, and improvements in prevention, detection and treatment of disease such as cardiovascular disease and other chronic diseases in the latter half of the century
- the decline of infant and child deaths.
Deaths in early childhood (aged 0–4 years) have reduced substantially over the past 100 years (see Figure 5.3). Over one quarter (26%) of deaths in 1907 were of people aged 0–4 years. In 2024 deaths in early childhood account for less than 1% of all deaths.
The drop in child deaths in Australia mostly reflects a decline in infant deaths (aged less than 1), which is linked to:
- improved access to and quality of neonatal health care
- increased community awareness of risk factors for infant and child deaths
- improved sanitation and hygiene
- reductions in vaccine-preventable diseases through universal immunisation programs (AIHW 2022).
The improvements in childhood mortality as well as the prevention, detection, and treatment of disease means people now die at older ages (see Age at death). This is reflected in the 90% decline of PYLL between 1907 and 2024 (from 382 to 37 PYLL per 1,000) (Figure 5.3).
Figure 5.3: Historical death rates in Australia, age-standardised, child (0-4) and potential years of life lost, by sex, 1907–2024
Side-by-side line graph shows the overall decline in age-standardised death rates between 1907 and 2024 for males and females. The rate difference between males and females has reduced over this period.

Trends by cause of death since the early 1900s
Definition and inclusion of infectious diseases
Infectious diseases included in trend analysis from the early 1900s does not include COVID-19. Infectious diseases included in this section align to the ICD-10 chapter: Certain infectious and parasitic diseases (A00–B99).
Information and data on deaths due to COVID-19 (U07.1, U07.2, U10.9) can be found in the chapter Mortality in the context of a pandemic, and the GRIM Excel workbooks.
There has been a change to the mortality profile of Australians across the last century: shifting from infectious to chronic disease.
Infectious diseases were the leading cause of death in the first decade of the twentieth century (Figure 5.4). A significant reduction in the death rate was seen in the first half of the century, due to the improvements to sanitation, hygiene and the introduction of vaccinations. In 1907 deaths due to infectious diseases accounted for more than one quarter (28%) of deaths. In 2024 they account for less than 2%.
In 1919, mortality due to respiratory diseases increased sharply due to the Spanish influenza pandemic (see Mortality in the context of a pandemic).
When accounting for differences in the population age structure over time:
- cardiovascular diseases have consistently been a leading cause of death, despite the significant reduction in death rate since the late 1960s.
- the death rate due to cancer has decreased by one third, since the peak in 1985 (from 217 to 146 deaths per 100,000).
See more in Australia’s health 2022: data insights on Changing patterns of mortality in Australia since 1900 and Australia’s health 2024: data insights on The ongoing challenge of chronic conditions in Australia.
Figure 5.4: Crude and age-standardised death rates in Australia, by broad cause of death, 1907–2024
The line graph shows a decrease in the crude and age-standardised death rates over time due to infectious diseases, respiratory diseases and injury and poisoning. The age-standardised death rates for deaths due to cancer decreased but the crude rate increased.
