Deaths among children aged 1–14
There were 472 deaths among children aged 1–14 in 2012. This age group experienced the lowest mortality rate of any age group in 2012 (12 deaths per 100,000 population aged 1-14 ; or 1 death for every 8,475 children aged 1–14). The death rate among children decreased by 41% since 1997 (from 20 deaths per 100,000; Figure 5.1).
Nearly half (48%) of all child deaths in 2012 were considered potentially avoidable, for example, deaths from land transport accidents.
Figure 5.1: Death rates among children aged 1–14, by sex, 1997–2012
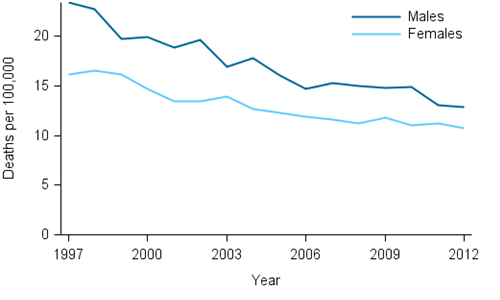
Source: AIHW National Mortality Database (Table S1, 524KB XLS).
Injury and poisoning were among the leading causes of death in this age group: land transport accidents accounted for 14% of child deaths in 2010–2012 and accidental drowning and submersions accounted for 6.6% (Table 5.1).
In 2010–2012, boys accounted for more than two-thirds (65%) of land transport deaths and three-quarters (77%) of drowning deaths in children aged 1–14.
Table 5.1: Leading causes of death among children aged 1–14, 2010–2012
| Rank | Cause of death | Deaths | Per cent |
|---|---|---|---|
| 1 | Land transport accidents (injury) see fact sheet and GRIM book. |
201 | 13.8 |
| 2 | Perinatal & congenital (other) | 130 |  8.9 |
| 3 | Accidental drowning (injury) see fact sheet and GRIM book. |
97 |  6.6 |
| 4 | Brain cancer (cancer) | 85 |  5.8 |
| 5 | Cerebral palsy & related (other) | 67 |  4.6 |
Notes:
- Colours indicate broad cause of death category.
blue = chronic disease, orange = cancer, purple = injury & poisoning, green = other cause of death. - Injury and poisoning death data should be interpreted with caution due to the potential for revision (see Source data).
Source: AIHW National Mortality Database (Table S2, 524KB XLS).