Patterns in MBS services between 1984 and 2023
There has been an increase in the monthly MBS services rate (Figure 1) between February 1984 and March 2023 in Australia, which indicates that Australians are receiving a higher volume of MBS subsidised services over time (from a services rate of 0.6 per person per month in February 1984 to a services rate of 1.5 per person per month in March 2023). However, the services rate appears to have declined over recent months.
The increase could be due to a number of contributing factors, such as changes in scope and coverage of the MBS; addition of new services to the MBS; a changing age structure of the population across time; and changing wealth levels. For example, in 1984 there were approximately 2,300 MBS items available. This has risen to around 6,000 items in 2022.
After declining during the initial decades of the program, the subsidy rate across all MBS services remained relatively stable in the 15 years leading up to the start of the COVID-19 pandemic, with around 79% of provider fees being subsidised through the MBS (Figure 2).
During the early stages of the COVID-19 pandemic, a number of factors drove the MBS subsidy rate up to 84.6% in April 2020, particularly an increase in the ‘bulk-billing’ incentives for GPs, new telehealth items that were bulk-billed, reductions in certain types of activity that tended to have higher out-of-pocket fees (for example, elective surgery) and the roll-out of the COVID-19 vaccines.
In the most recent period, there has been a rapid decline in the MBS subsidy rate, leading to lower levels than those that have previously been seen – with an historic low of 73% in February 2023 (Figure 2).
There is a monthly seasonal component to the data, with regular decreases occurring in December and January. These decreases are likely due to health practitioners and patients being on leave in January, as well as patients deferring necessary but non-urgent appointments.
Figure 1: Monthly MBS services rate
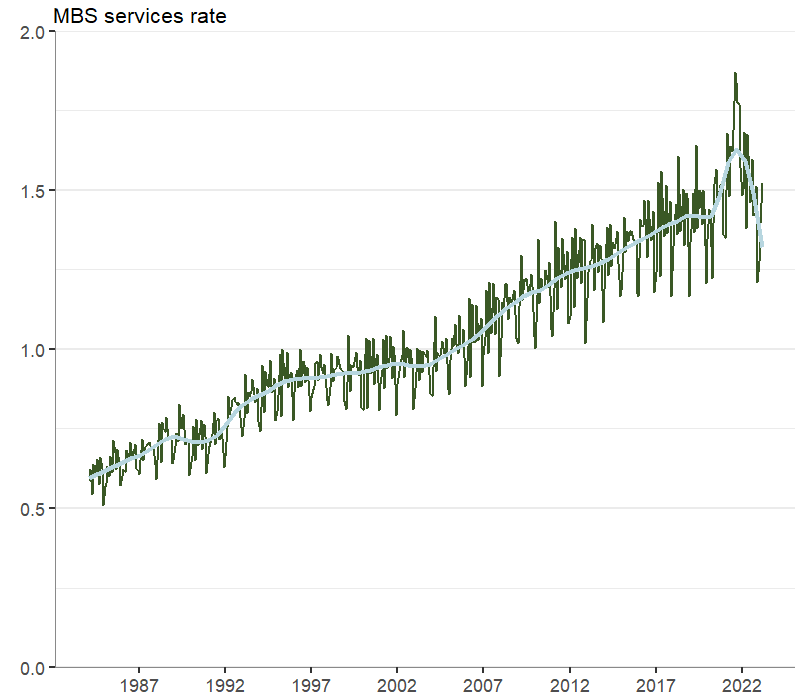
Chart: AIHW. Source: MBS funded services dashboard.
Figure 2: Monthly MBS subsidy rate
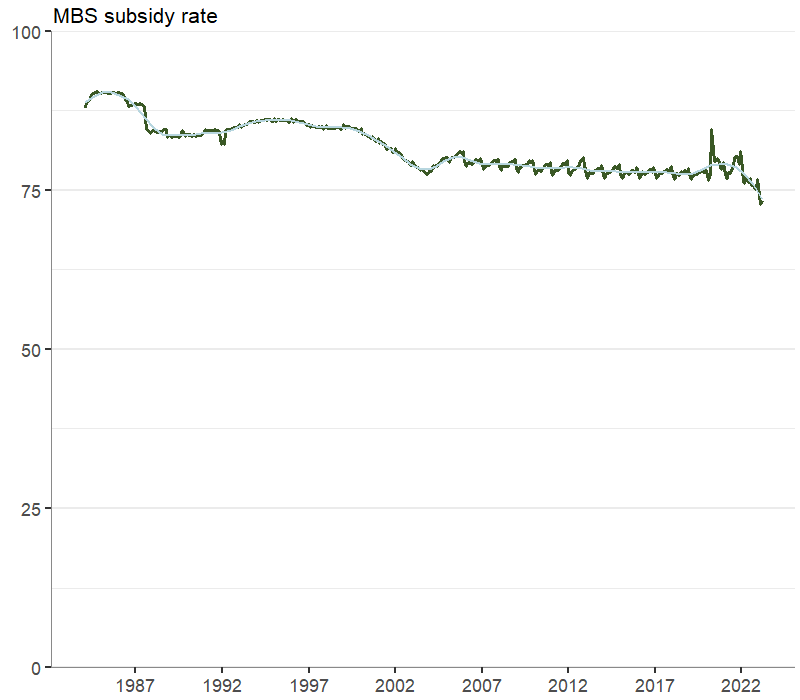
Chart: AIHW. Source: MBS funded services dashboard.
|
Description |
Category |
MBS services rate (N per person) |
MBS subsidy rate (%) |
|---|---|---|---|
|
Australia |
National |
17.8 |
76.4 |
|
Remoteness |
Major cities |
18.3 |
76.0 |
|
Remoteness |
Inner regional |
18.0 |
77.6 |
|
Remoteness |
Outer regional |
15.1 |
78.2 |
|
Remoteness |
Remote |
10.9 |
78.6 |
|
Remoteness |
Very remote |
8.5 |
84.9 |
|
Socioeconomic area (SEIFA1 quintiles) |
1 |
16.9 |
83.8 |
|
SEIFA |
2 |
17.9 |
81.4 |
|
SEIFA |
3 |
18.2 |
78.8 |
|
SEIFA |
4 |
17.6 |
77.7 |
|
SEIFA |
5 |
18.1 |
72.0 |
|
Broad Type of Service (BTOS) |
GP Attendances |
6.8 |
88.8 |
|
BTOS |
Specialist Attendances |
1.3 |
58.3 |
|
BTOS |
Obstetrics2 |
0.1 |
39.1 |
|
BTOS |
Anaesthetics |
0.1 |
39.5 |
|
BTOS |
Pathology |
6.4 |
94.6 |
|
BTOS |
Diagnostic Imaging |
1.1 |
87.1 |
|
BTOS |
Operations |
0.4 |
49.0 |
|
BTOS |
Optometry and Allied Health |
1.0 |
78.1 |
|
BTOS |
Other |
0.5 |
82.6 |
- Based on the Socio-Economic Indexes for Areas (SEIFA) Index of Relative Socio-Economic Disadvantage (IRSD). SEIFA 1 indicates an area of greater disadvantage, SEIFA 5 an area with less disadvantage.
- MBS services rate denominator is restricted to female Estimated Residential Population (ERP) only.