Trends in alcohol available for consumption
Since 2014–15, wine has contributed more to total alcohol available for consumption than any other beverage type.

Changes in the total amount of alcohol available for consumption
In 2023–24, 217.1 million litres of pure alcohol were available for consumption in Australia, a 3.7% decrease from 225.5 million litres in the previous year. The per capita availability of alcohol also declined, from 10.5 litres in 2022–23 to 9.8 litres in 2023–24 (Figure 1). This reduction is equivalent to about 5 bottles of red wine per person over the course of a year. It also marked the largest year-on-year decrease in per capita alcohol availability since the collection begin in 1960–61 in Australia.
The largest change observed between 2022–23 and 2023–24 was a 6.3% decrease in the volume of alcohol from spirits being made available for consumption, falling from 53.8 million litres to 50.5 million litres of pure alcohol. This decline reversed the increasing trend that began in 2014–15, when 34.4 million litres of pure alcohol from spirits were available for consumption. Over the same period, the volume of alcohol from cider declined by 3.7%, wine by 3.5%, and beer by 2.0%.
This reduction continues a declining trend seen since 2020–21, when alcohol availability was at its highest point since the mid-to-late 2000s. Over this period, the amount of pure alcohol available per person in Australia has fallen sharply, from 10.9 litres to 9.8 litres in 2023–24. This represents a substantial decline over just three years, returning to levels last seen in 2014–15 when per capita availability was approximately 9.8 litres.
The downward trend in overall alcohol consumption between 2020–21 and 2023–24 was reflected across different beverage types, as shown in Figure 2.
Figure 2: Litres of pure alcohol available per capita by beverage type over time
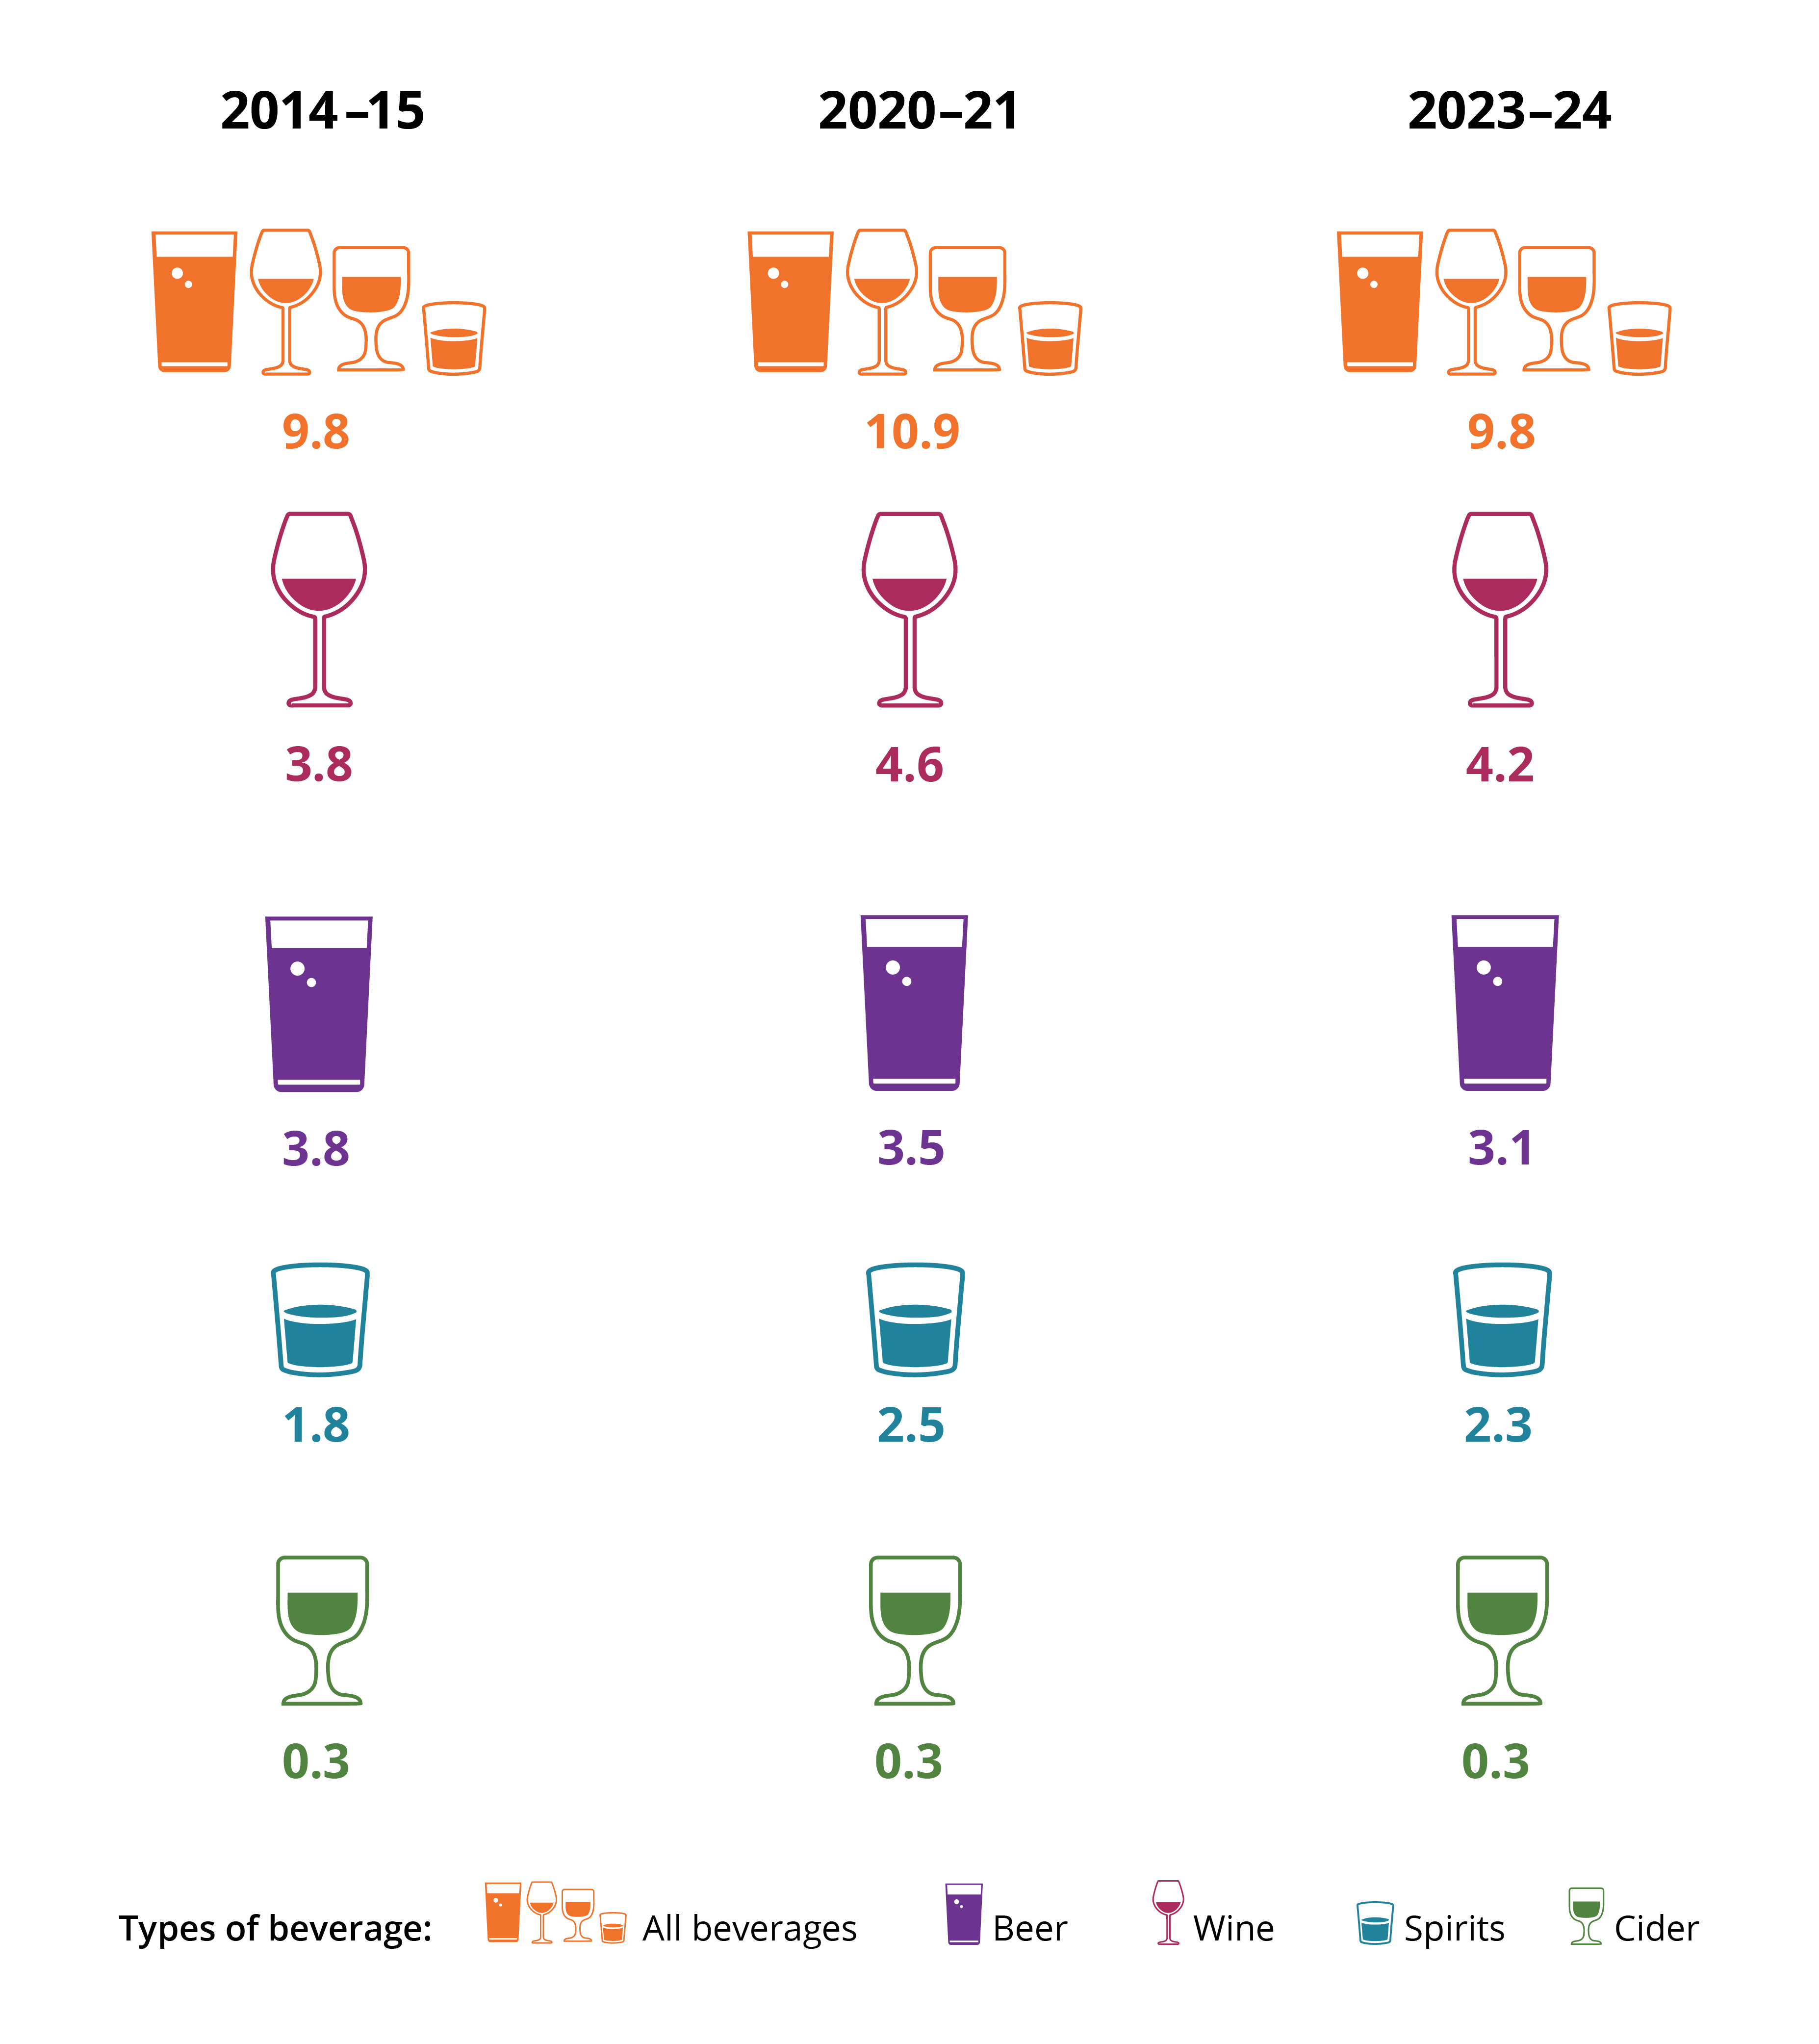
Source: AIHW 2025
In 2023–24, wine still accounted for the largest proportion of pure alcohol available for consumption in Australia at 42%. It was followed by beer at 32%, spirits at 23%, and cider at 3% (Figure 3).
Figure 3: Breakdown of alcohol available for consumption in 2023–24 by beverage type
The proportion of beverage types in 2023–24.
