Health of children
Web article
Last updated:
Topic: Children & youth
Citation
AIHW (Australian Institute of Health and Welfare) (2026) Health of children, AIHW, Australian Government, accessed 27 July 2026.
Good health influences how children feel and go about their daily lives, as it can affect participation in family life, schooling, social and sporting activities. The foundations for good health start during the antenatal period and early childhood with effects that can extend into adulthood (see Australia’s mothers and babies). Health during these early stages is shaped not only by biological factors, but also by social, economic and environmental conditions in which children are born and grow. Addressing health risk factors early can reduce the burden of preventable chronic diseases in adulthood and equip children with the best life chances (AIHW 2022a, Department of Health 2019). This page focuses on key health issues affecting children in Australia.
How do we define children?
The page uses the term ‘children’ to refer to those aged 0–14. Due to differences in data sources, data collection and reporting methods, age ranges vary across reports, and some data for children may overlap with age ranges used to report on young people. While the precise age groupings differ between sources, reflecting varying frameworks, policies and legislation, reporting on children’s health generally covers early childhood and young people.
For more information, see:
Key findings
- In 2024, infant and congenital conditions (including pre‑term birth and low birth weight) were the leading causes of disease burden for children under 5, while asthma was the leading cause among children aged 5–14.
- Nearly half (45%) of children aged 0–14 had at least one chronic condition, and around 1 in 10 had a disability, with higher prevalence among boys in 2022.
- In 2023–24, there were around 62,800 injury hospitalisations among children aged 0–14, accounting for 8.5% of all hospitalisations in this age group, with boys about 1.5 times as likely as girls to be hospitalised.
- Although childhood immunisation coverage remained high, coverage declined since 2020, and whooping cough notifications reached their highest level since 1991 in 2024, with children under 15 accounting for most cases.
- In 2023, physical activity declined with age among children, with those aged 12–17 spending long periods inactive and most not reaching 1 hour a day of moderate to vigorous physical activity.
- In 2023–24, around 156,000 children aged 0–11 (41 per 1,000) were dispensed ADHD medications, receiving an average of 8 prescriptions each, with dispensing more than ten‑fold higher than in 2004–05.
- In 2024, child abuse and neglect was the second leading risk factor contributing to burden of disease and injury among children aged under 15, accounting for 1.3% of total burden and 0.4% of deaths.
- From 1998 to 2024, death rates declined substantially across both infants and children - falling from 5.0 to 3.3 deaths per 1,000 live births among infants, and from 19.7 to 8.8 deaths per 100,000 among children aged 1–14.
Profile of children
At 30 June 2024, an estimated 4.8 million children aged 0–14 lived in Australia with boys accounting for just over half (51%) of this population compared to girls (ABS 2023d).
The number of children in Australia is projected to reach 7.2 million by 2071 (ABS 2023e). However, due to sustained low fertility rates and increasing life expectancy, the number of children as a proportion of the entire population has steadily decreased, from 29% in 1968 to 17% in 2025 (ABS 2023d).
Figure 1: Number of children and children as a proportion of the total Australian population, 1968–2048
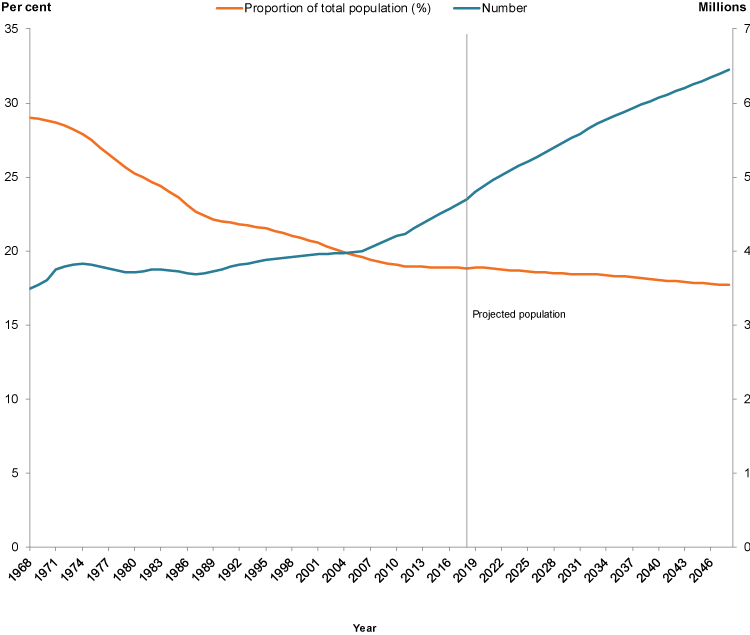
Note: Population projections (2019 onwards) are based on ABS Projection Series B. See ABS 2018e for the assumptions on which Projection Series B is based.
Sources: ABS 2014; ABS 2018a; ABS 2018b.
Australia’s children
In 2024, among all children aged 0–14:
- almost 3 in 4 (73%) lived in Major cities (AIHW analysis of ABS 2025)
- nearly 1 in 5 (19%) lived in the lowest socioeconomic areas (AIHW analysis of ABS 2025)
- nearly 1 in 10 (8.7%) were born overseas (ABS 2023b).
As of 30 June 2021, final Australian Bureau of Statistics’ (ABS) estimates indicate that 6.9% of children were Aboriginal and Torres Strait Islander (First Nations) people (ABS 2023a).
Health status
Burden of disease
Burden of disease refers to the quantified impact of a disease or injury on a population, which captures overall health loss, that is, years of healthy life lost through premature death or living with ill health (see Burden of disease).
In 2024, among infants and young children aged under 5, the leading causes of total burden of disease were pre-term birth and low birth weight complications, and birth trauma and asphyxia (51 DALY per 1,000 population for children aged under 1 and 0.1 DALY per 1,000 population for children aged 1–4). Leading causes were similar for both boys and girls in this age group (Figure 2).
For children aged 5–14, asthma was the leading cause of total burden followed by 4 mental health conditions: autism spectrum disorders, anxiety disorders, depressive disorders and conduct disorders (AIHW 2024a).
The burden from these causes was greatest for children under one:
- Pre-term birth and low birth weight complications was associated with 73 DALY per 1,000 population for children aged under 1 and 0.4 DALY per 1,000 population for children aged 1–4.
- Birth trauma and asphyxia was associated with 51 DALY per 1,000 population for children aged under 1 and 0.1 DALY per 1,000 population for children aged 1–4.
These patterns reflect differences in the severity and timing of health impacts rather than how common the conditions are. Early life conditions contribute a large burden due to high severity in infancy, while more prevalent conditions in older children contribute burden primarily through ongoing disability.
The leading causes of total burden of disease among boys and girls aged 5–14 differed slightly, with autism spectrum disorders contributing the most burden to boys (16%) and asthma contributing the most burden to girls (11%) (Figure 2).
Note: Mental conditions, mental illness and mental disorders are used interchangeably
Figure 2: Leading causes of total burden among children aged 0–14, by age group and sex, 2024
Under 5 year the leading cause of burden for boys and girls was pre-term birth and low birthweight complications. For 5–14 years, for boys was autism spectrum disorders and for girls was asthma.
