Adoptions
On this page:
- Introduction
- Types of adoption
- Number of adoptions continue to decline
- Who was adopted?
- Aboriginal and Torres Strait Islander children
- How many children with additional care needs are adopted from overseas?
- Characteristics of adoptive parent(s) and birth mothers
- What are the processes for adoptions?
- Alternatives to local, known and intercountry adoptions
- How did COVID-19 affect adoptions?
- Where do I go for more information?
Adoption aims to provide a nurturing, safe and permanent family for children and young people who are not able to live with their families. It is a process where full parental rights and responsibilities for a child are legally transferred from a child’s parents to their adoptive parents.
This report covers the latest data on adoptions of Australian children (domestic adoptions) and children from overseas (intercountry adoptions). Data covers characteristics of adopted children, their parents, and their adoptive families, as well as adoption processes and consent arrangements.
Types of adoption
There are two main categories of adoptions in Australia:
- Domestic adoptions of Australian children, which include:
- Local adoptions, where the child and adoptive parent(s) did not know each other before the adoption
- Known child adoptions, where the child and adoptive parent(s) knew each other before the adoption. Known child adoptions can be further categorised into adoptions by step-parent(s), relative(s), carers, or other.
- Adoptions of children from overseas (or intercountry adoptions), where the child and adoptive parent(s) did not know each other before the adoption. These can be either ‘Hague’ or ‘bilateral’ adoptions, depending on the arrangement in place between Australia and the partner country.
- ‘Hague’ countries are those that are party to the Hague Convention on Protection of Children and Co-operation in Respect of Intercountry Adoption (the Hague Convention)
- Australia has ‘bilateral’ arrangements with some countries that are not party to the Hague Convention but can satisfy its principles. For more information on these differences and current intercountry adoption programs, see Appendix A.
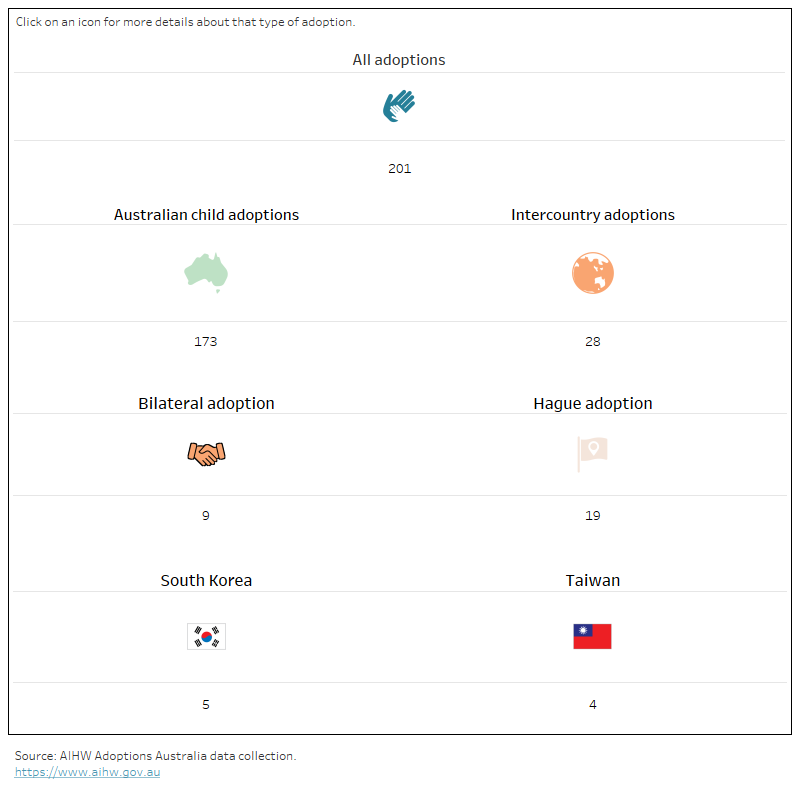
In 2022–23, 201 adoptions were finalised in Australia. Of these:
- 173 (86%) children were adopted domestically (31 local adoptions, 142 known child adoptions)
- Most known child adoptions were by a carer (73, or 42% of domestic adoptions) or step-parents (67, or 39% of domestic adoptions)
- 28 children (14% of all adoptions) were adopted from overseas – 19 of these children came from countries party to the Hague Convention, while 9 were adopted from countries with a bilateral agreement with Australia (Figure 1).
Adoptions by relatives or other known carers of children from other countries (known child intercountry adoptions) are not included in national counts but are collected by all states and territories. These can be further categorised as either intercountry relative adoptions or intercountry known non-relative adoptions (Intercountry Adoption Australia 2022).
In 2022–23, there were 2 known child intercountry adoptions.
For definitions of each of these adoption types, see the glossary.
For more information on intercountry known child adoptions, see the Intercountry Adoption Australia website.
Figure 1: Number of finalised adoptions in Australia, by type of adoption, 2022–23
The diagram shows there were 201 adoptions finalised in 2022–23, consisting of 173 domestic and 28 intercountry adoptions.

Notes:
- Excludes intercountry known child adoptions.
- Other Hague country adoptions include 4 adoptions from Chile, Colombia and Hong Kong.
- See glossary for definitions.
Number of adoptions continue to decline
Adoptions have been recorded in Australia since 1968–69. Between 1968–69 to 1971–72, the number of adoptions rose from 6,773 to a peak of 9,798. Compared to 1971–72, the number of adoptions in 2022–23 has fallen by 98% from 9,798 to 201.
Information on whether children were adopted from Australia or overseas has been recorded since 1979–80. Between 1979–80 to 2004–05, the number of overseas adoptions rose from 393 to a peak of 434. Since 2004–05, the number of overseas adoptions has declined by 94% from 434 to 28 in 2022–23. Over the same period, the number of children adopted within Australia has increased by 15% from 151 to 173.
For more information on key social and policy developments impacting adoption trends, see Adoptions in Australia over time.
Who was adopted?
The characteristics of adoptees varies by type of adoption.
Age
In 2022–23:
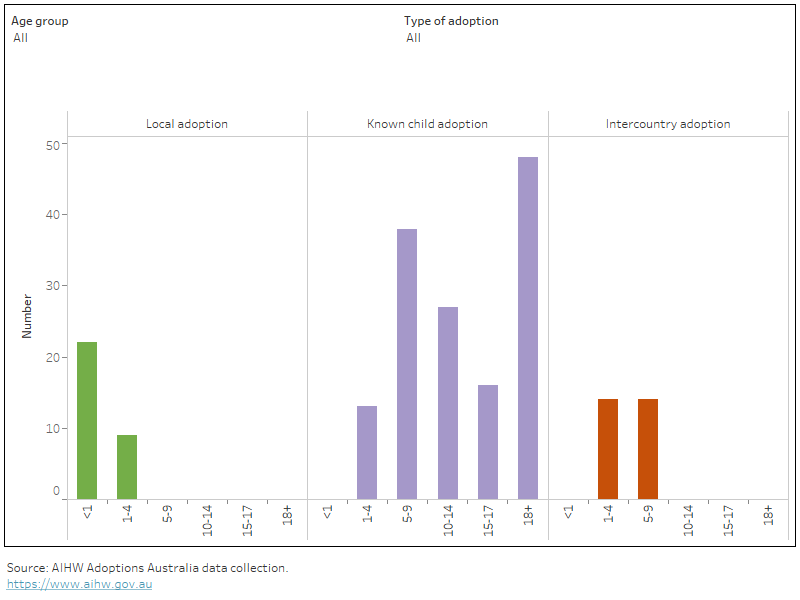
- All local adoptees (where the child and adoptive parent(s) did not know each other before the adoption) were aged 4 years and under and most (22) were less than a year old
- Known child adoptees were generally older, with over half (91) being aged 10 years or more, and around one-third (48) were aged 18 and over
- All intercountry adoptees were aged under 10 years (Figure 2)
- There were 48 adult adoptions. All adults were adopted as part of a known child adoption, and most (44) were adopted by a step-parent. For information on the legislation and processes for adopting people aged 18 and over, see Appendix A.
Sibling groups
Where a child and at least one of their siblings are adopted at the same time into the same family, these are recorded as sibling group adoptions.
In 2022–23:
- For local adoptions, there was one sibling group of 2 children. Most (30) local adoptees were adopted into families where there were no other children
- For known child adoptions, data on sibling group adoptions are only collected for children adopted by carers. Of the 73 children adopted by a carer, 29 children were adopted as part of 13 sibling groups
- For intercountry adoptions, 4 children were adopted as part of 2 sibling groups.
Figure 2: Age group of adoptees, by type of adoption, 2022–23
The bar chart shows that known child adoptees were older than local and intercountry adoptees.

Note: For local and intercountry adoptions, ‘age of child’ refers to the age of the adopted child at the date of placement with the adoptive parent(s). For known child adoptions, ‘age of child’ refers to the age of the adopted child at the date the adoption order was granted.
Aboriginal and Torres Strait Islander children
The Aboriginal and Torres Strait Islander Child Placement Principle (ATSICPP) outlines a hierarchy for placing Aboriginal and Torres Strait Islander children in out-of-home care with Indigenous or non-Indigenous relatives or kin, or close geographically to their existing family if this cannot be achieved (SNAICC 2017). For more information, see Child protection Australia: Aboriginal and Torres Strait Islander children 2021–22.
In 2022–23:
- 4 Aboriginal and Torres Strait Islander children had adoption orders finalised as part of a known child adoption, and one was adopted through a local adoption.
Source: AIHW Unpublished National Adoptions Data Collection
Since 1998–99:
- 124 Aboriginal and Torres Strait Islander children have been adopted, with 34% adopted by Indigenous Australians, and 66% adopted by other Australians
- 80 Aboriginal and Torres Strait Islander children were adopted through known child adoptions while 44 were adopted through local adoptions
- 24 local adoptions and 18 known child adoptions of Aboriginal and Torres Strait Islander children over this period involved at least one adoptive parent who identified as Indigenous
- the number of Aboriginal and Torres Strait Islander children adopted through known child adoptions is increasing, with 31 children adopted between 2018–19 and 2022–23. This has doubled compared with the number of adoptions between 2008–09 and 2012–13.
How many children with additional care needs are adopted from overseas?
Additional care needs are defined by the level of resources or support services required by the adoptee and/or their adoptive family to:
- foster healthy development and wellbeing
- support positive family functioning
- prevent adoption disruption.
Data on additional care needs are recorded for intercountry adoptees and are categorised by:
- no additional care needs
- minor additional care needs
- moderate to substantial additional care needs (see glossary).
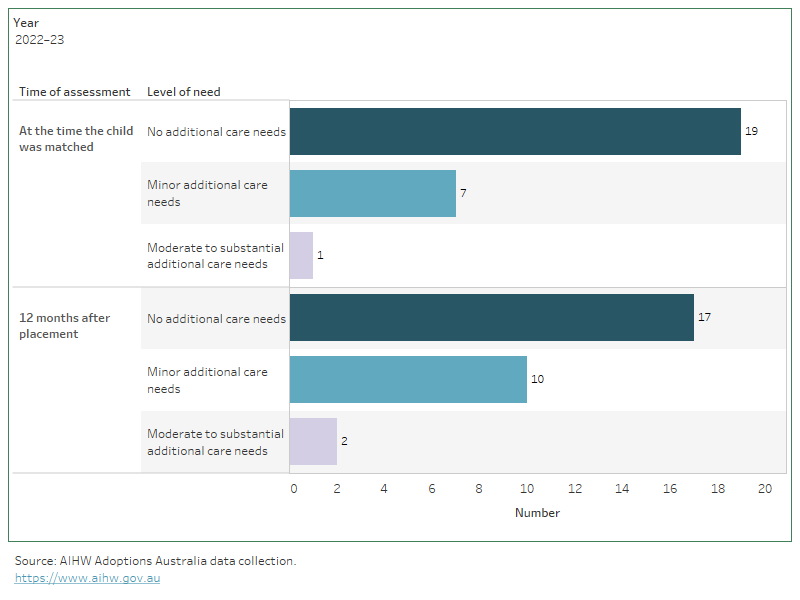
Of the 29 children who entered Australia from overseas countries (regardless of their adoptions being finalised) in 2021–22:
- 19 were identified as having no additional care needs when they were matched with their prospective adoptive parent(s).
- 8 had some level of additional care needs
- 7 were assessed as having minor additional care needs
- 1 was assessed as having moderate to substantial additional care needs.
These numbers varied slightly when the level of need was reassessed 12 months after the children entered Australia:
- Most (17) children were classified as having no additional care needs
- 10 were reported as having minor additional care needs
- 2 were reported as having moderate to substantial needs (Figure 3).
For more information on how level of need is assessed, see the technical notes.
Figure 3: Intercountry adoptees who entered Australia in the previous year, by assessed level of need at the time the child was matched, and 12 months after placement, 2017–18 to 2022–23
The bar chart shows changes of additional care needs for an intercountry adoption, from when the child was matched to 12 months after placement.

Notes:
- Includes all Hague and bilateral intercountry adoptees from partner countries who entered Australia for each financial year. For example, for 2022–23, counts include all Hague and bilateral intercountry adoptees who entered Australia between 1 July 2021 and 30 June 2022.
- 'Level of need' is based on the assessment information available 12 months after the child entered Australia. Where available assessment information indicates different levels of need, preference is given to the most recent assessment information.
- Western Australia were unable to report on the level of need before 2022–23.
- Data for 2022–23 includes one child who entered Australia in the 2020–21 financial year, but relocated to a different jurisdiction in 2021–22.
For children who entered Australia from 2016–17 to 2021–22:
- the number assessed as having moderate to substantial additional care needs has fallen from 25 to one.
- the number assessed as having minor additional care needs peaked at 19 children in 2021–22, before dropping to 7 in 2022–23.
Characteristics of adoptive parent(s) and birth mothers
Data on adoptive parent(s) are collected for local and intercountry adoptions. For known child adoptions, these data are only available for carer (known child) adoptions. Where an adoptive family adopted more than one child, the adoptive parent(s) are counted once for each child.
For adoptions finalised in 2022–23:
- All adoptive parent(s) in intercountry adoptions (28) and local adoptions (31) were in a registered marriage
- Most adoptive parent(s) (61) in carer (known child) adoptions were married, 11 were single
- 85% of adoptive parent(s) in carer (known child) adoptions were aged 40 and over, compared with 48% of adoptive parent(s) in intercountry adoptions and 40% of adoptive parent(s) in local adoptions.
Data on the characteristics of birth mothers are available for finalised local adoptions. In 2022–23:
- The median age of birth mothers was 26 years, younger than the median age of 31.9 years for all mothers giving birth in Australia (ABS 2022)
- The age of birth mothers ranged from 18 to 46 years
- 96% of birth mothers were not married to the child’s birth father at the time of birth.
Source: AIHW Unpublished National Adoptions Data Collection
What are the processes for adoptions?
In Australia, the processes for adopting a child depend on the adoption type and legislation and practices in each individual state or territory. For more information, see the technical notes and Appendices A to D.
Consent arrangements
As part of the court process to finalise an adoption order, there may be circumstances where the court finds it appropriate to waive the birth parent(s) consent to the adoption.
In 2022–23:
- consent was provided by both parents for about one-quarter (26%) of all local adoptions
- consent from both parents was waived or not required for around 5 in 6 carer (known child) adoptions. This includes adoptions of children aged 12 and over where the child can consent to their own adoption.
Information applications and vetoes
Parties to a domestic adoption can access or restrict (veto) identifying or contact information.
At 30 June 2023, 7,979 contact vetoes were in place.
In 2022–23:
- 1,724 applications were lodged to access either identifying or non-identifying information. Most (89% or 1,539) were for identifying information applications, and of these, 1,119 (73%) were lodged by adoptees
- 5 contact vetoes were lodged, while no identifying information vetoes were lodged.
For information on the types of applications and vetoes, see the technical notes.
How long do Intercountry adoptions take?
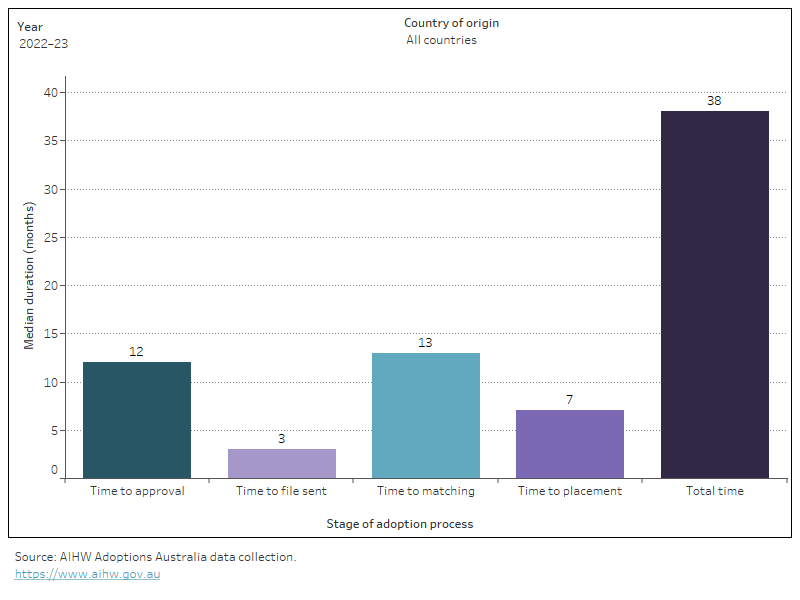
For intercountry adoptions, the waiting time is measured from when a prospective adoptive parent is approved to when a child is placed (Figure 4). For further information on the intercountry adoption process, see the technical notes.
In 2022–23:
- the total median length of time from approval of an application to placement of a child was about 3 years
- South Korea had the shortest median waiting time around 3 years, while Thailand had the longest of about 4 years.
Figure 4: Median processing time (in months) for children placed in intercountry adoptions, by country of origin and stage of intercountry adoption process, 2012–13 to 2022–23
The bar chart shows the median total processing time was 38 months for intercountry adoptees placed in 2022–23.

Notes:
- Excludes 9 placements from Chile, Colombia, Hong Kong, India and Taiwan.
- ‘Time to approval’ is the median length of time (in months) from when the applicant(s) became official clients of the department to when an approval decision was made.
- 'Time to file sent' is the median length of time (in months) from when an approval decision was made to when the file was sent overseas.
- ‘Time to matching’ is the median length of time (in months) from when the file was sent overseas to when the child was matched.
- 'Time to placement' is the median length of time (in months) from when the child was matched to when the child was placed.
- 'Total time' is the median length (in months) from when the applicant(s) became official clients of the department to when the child was placed. This may not equal to the sum of medians for each constituent step of the process.
Alternatives to local, known child and intercountry adoptions
Third-party parental care arrangements
For children and young people in out-of-home care, the importance of achieving permanency and stability is widely recognised. This has been reflected in jurisdictional changes in policy and legislation across Australia (AIHW 2016) that have focused on early planning for permanent placement of children in need, including alternative long-term care arrangements such as:
- carer (known child) adoption
- care and protection orders that transfer guardianship and custody to carers, known as third-party parental care arrangements.
In 2021–22:
- 1,343 third party parental responsibility orders were issued across Australia
- 65% were from New South Wales (463) and Victoria (413).
For more information on third-party parental care arrangements, see the Permanency outcomes for children in out-of-home care: indicators report.
Legislative changes introduced by state and territory departments over the past 25 years have supported greater use of alternative legal orders. This has not only contributed to the decline in adoption numbers but has also given children alternative pathways to permanency.
In Victoria, permanent care orders were introduced in 1992 which transfer sole responsibility for a child to a person other than the parent, in most cases, to relatives or carers with whom the child is currently living. This often replaces the need for adoption (see Appendix B).
In Western Australia, protection orders (special guardianship) provide for parental responsibility to an individual, or 2 individuals jointly, for a child until they turn 18.
Visa applications and expatriate adoptions
The Department of Home Affairs provides visa and citizenship application data to the AIHW to report on expatriate and other intercountry adoption practices, such as known child intercountry adoptions. Expatriate adoptions occur outside of the Australian intercountry adoption program and are not included in national counts.
In 2022–23, 62 Adoption visas were issued to adopted children of Australians seeking to return to Australia with the child. These include visas for:
- children adopted by expatriate Australians through an overseas adoption authority
- adoptions arranged and supported by Australian adoption authorities.
Of these 62 visas, 33 were from countries that had an open adoption program with Australia, while 24 were from countries with no previous program.
How did COVID-19 affect adoptions?
Measures in place as part of government responses to COVID-19 during 2020 and 2021 (including closure of international borders, travel bans/restrictions, lockdowns, quarantine requirements, limitations on non-urgent face-to-face work, and resource allocations) may have affected domestic and intercountry adoption processes from 2019–20 to 2021–22.
Although the long-term effect of COVID-19 on adoption processes is still unknown, there was a 62% drop in intercountry adoptions from 42 in 2020–21 to 16 in 2021–22, indicating that border closures may have had some effect on numbers. Intercountry adoptions rose from 16 in 2021–22 to 28 in 2022–23, indicating the lifting of COVID-19 restrictions, such as the opening of international borders, may have led to the increase. The impact of COVID-19 on adoptions data may become more apparent in future years.
Where do I go for more information?
For more information on this topic, see Adoptions.
For more information on adoptions, see also:
ABS (Australian Bureau of Statistics) (2022) Births, Australia, 2021, ABS Website, accessed 8 December 2022.
AIHW (Australian Institute of Health and Welfare) (2016) Adoptions Australia 2015–16, Child Welfare Series 65, catalogue number CWS 59, AIHW, Australian Government, accessed 8 November 2022.
Intercountry Adoption Australia (2022) Other types of overseas adoptions, IAA website, accessed 19 December, 2023.
SNAICC (Secretariat of National Aboriginal and Islander Child Care) (2017) Understanding and applying the Aboriginal and Torres Strait Islander Child Placement Principle, SNAICC, accessed 10 November 2022.


