Technical notes
Overarching methods
The aim of this project was to assess the impact of risk factor exposure to overweight (including obesity) and physical inactivity on attributable burden in the year 2030 under various scenarios. The year 2030 was chosen as it aligns with the National Preventive Health Strategy 2021–2030 which seeks to achieve improved health outcomes by 2030.
Risk factor attributable burden estimation is based on comparative risk assessment methodology developed as part of the Australian Burden of Disease Study (AIHW 2021a). Further details regarding methods for estimating burden attributable to physical inactivity and overweight (including obesity) can be found in Australian Burden of Disease Study: Methods and supplementary material 2018 (AIHW 2021b).
The basic steps in estimating risk factor attributable burden are:
- Select risk factors.
- Identify linked diseases based on convincing or probable evidence in the literature that the risk factor has a causal association with increased prevalence or mortality.
- Define the exposure to the risk factor that is not associated with increased risk of disease (the theoretical minimum risk exposure distribution, or TMRED, or counterfactual).
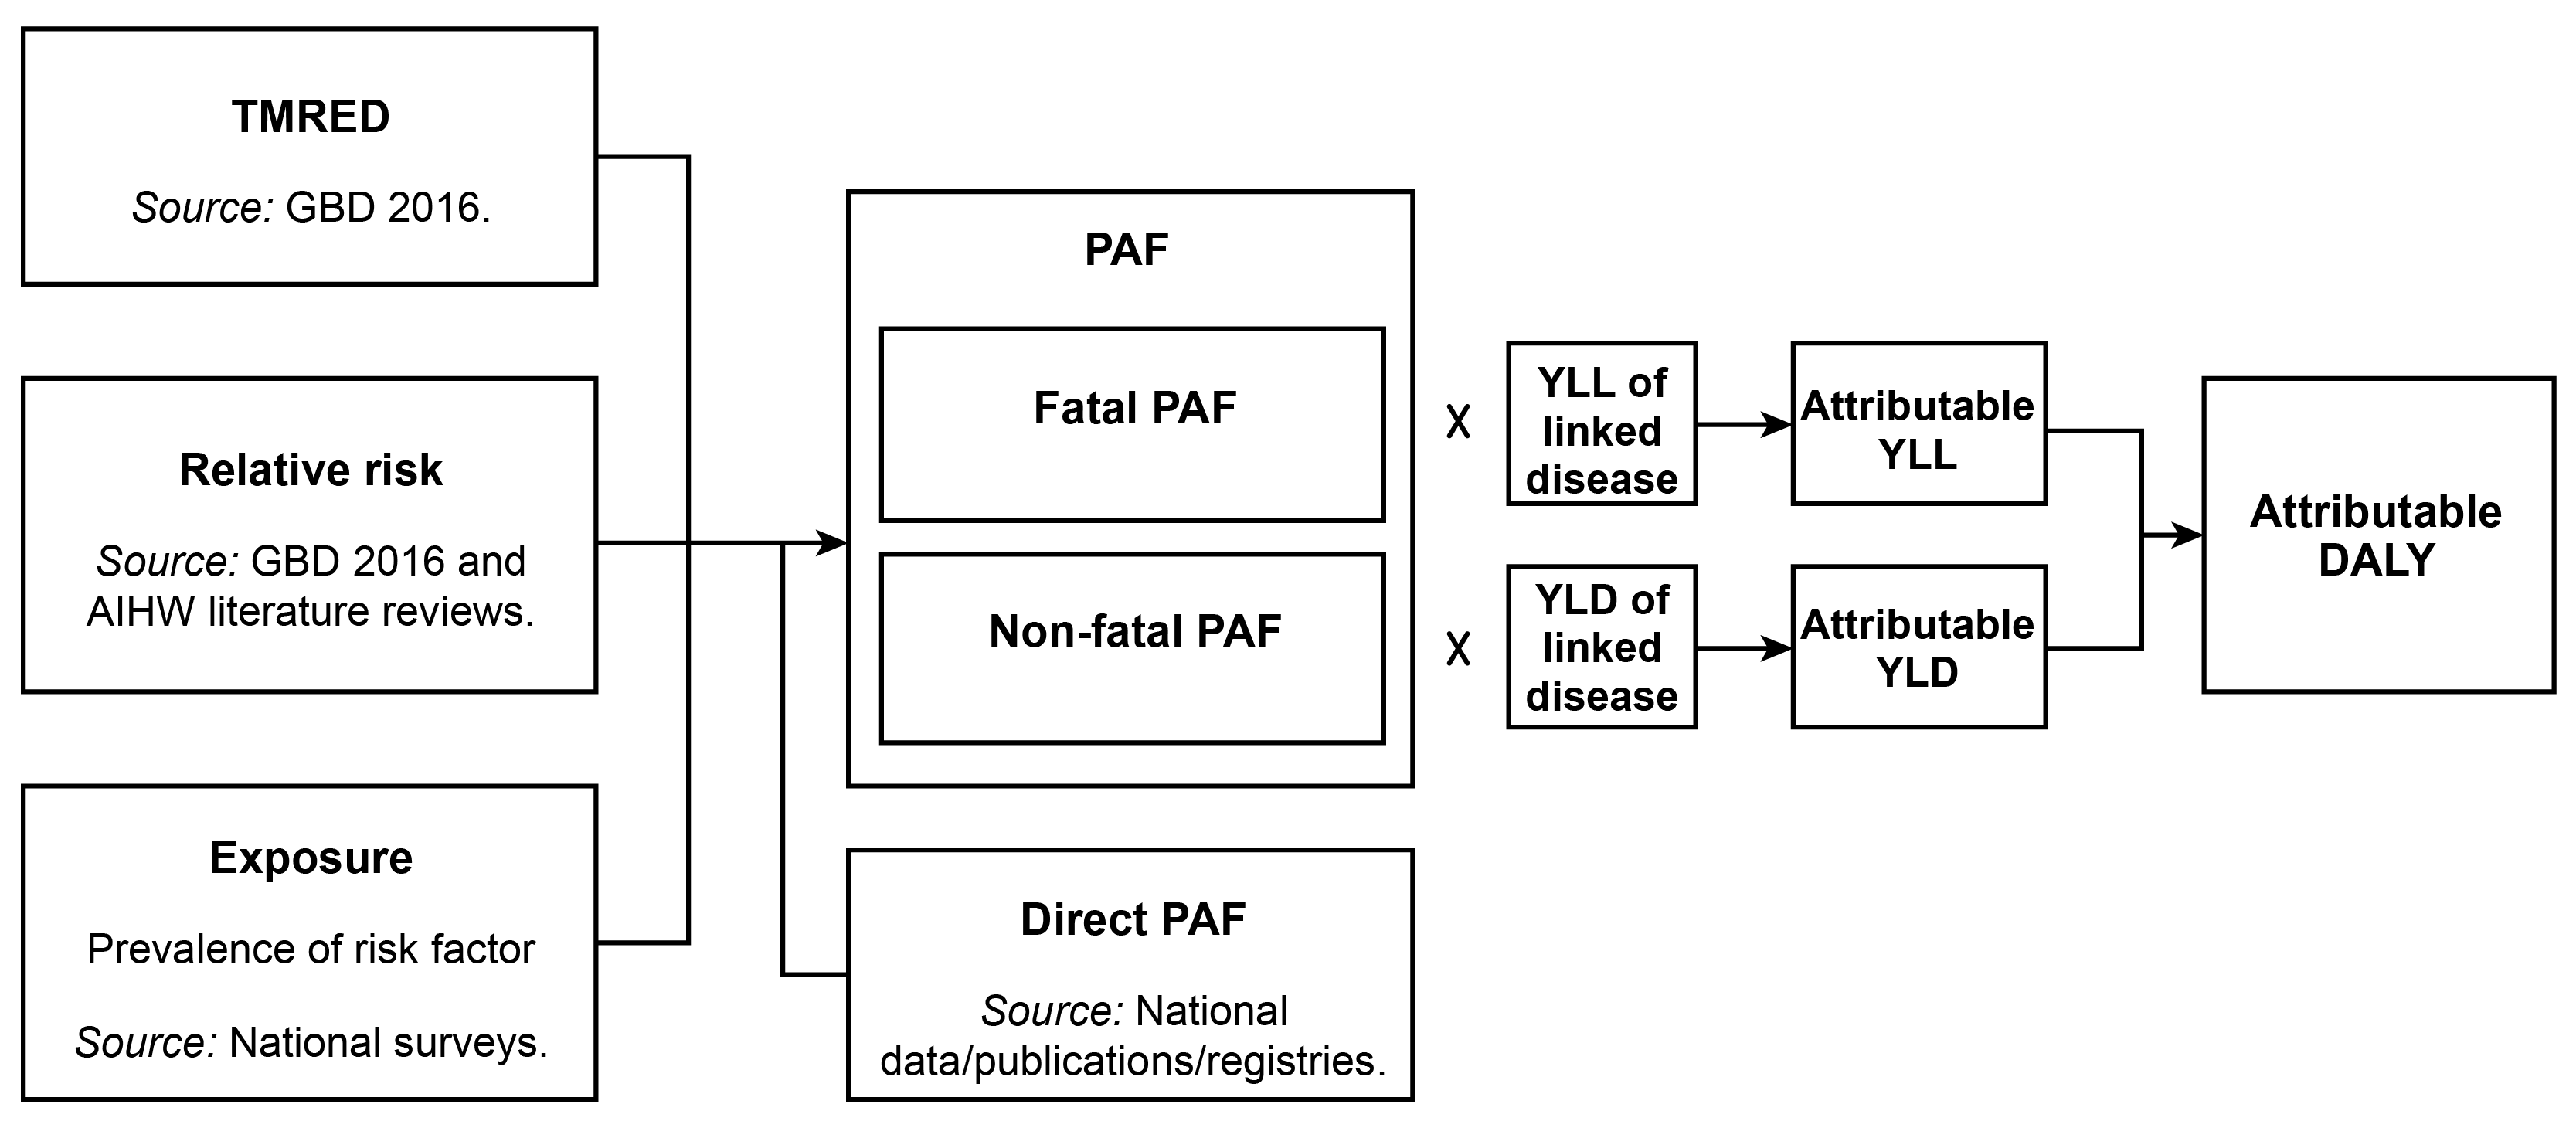
- Estimate the population attributable fractions (PAFs) by either a direct method or the comparative risk assessment method by age and sex:
- if PAFs appropriate to the disease and population in question are available from a comprehensive source (such as a disease register), they are estimated directly from this data source (named a ‘direct PAF’ in the ABDS) and do not require steps 5, 6 and 7, or
- if not, PAFs are created using the comparative risk assessment method, which involves steps 5, 6 and 7.
- Define the amount of increased risk (relative risk) of morbidity or mortality for the linked disease due to exposure to the risk factor.
- Estimate exposure to each risk factor in the population.
- Use these inputs to calculate the PAF. The PAF has a value between 0 and 1, where 0 means there was no burden attributable to the risk factor and 1 means that all the burden for the linked disease was attributable to the risk factor.
The burden attributable to each risk factor is calculated by applying the PAFs by age and sex for each linked disease to the relevant YLL and YLD.
This process is shown in the figure below.
Figure 1: Inputs and processes to calculate attributable burden
The diseases whose burden is associated with physical inactivity are:
- bowel cancer
- breast cancer
- coronary heart disease
- dementia
- depressive disorders
- stroke
- type 2 diabetes mellitus
- uterine cancer
The diseases whose burden is associated with overweight (including obesity) are:
- Acute lymphoblastic leukaemia
- Acute myeloid leukaemia
- Asthma
- Atrial fibrillation and flutter
- Back pain and problems
- Bowel cancer
- Breast cancer
- Cataract and other lens disorders
- Chronic kidney disease
- Chronic lymphocytic leukaemia
- Chronic myeloid leukaemia
- Coronary heart disease
- Dementia
- Gallbladder and bile duct disease
- Gallbladder cancer
- Gout
- Hypertensive heart disease
- Kidney cancer
- Liver cancer
- Myeloma
- Non-Hodgkin lymphoma
- Oesophageal cancer
- Osteoarthritis
- Other leukaemias
- Ovarian cancer
- Pancreatic cancer
- Stroke
- Thyroid cancer
- Type 2 diabetes mellitus
- Uterine cancer
Estimating disease burden in 2030
To estimate disease burden in 2030, fatal and non-fatal burden rates for 2018 were applied to projected Australian population estimates in the year 2030 (AIHW 2021b). For all scenarios, it was assumed that 2018 rates of disease burden (crude YLL, YLD and DALY rates) were to remain the same in 2030. Population estimates for 2030 were sourced from population projections by the Centre for Population (2021). At the time of analysis, this was the only available source that accounted for the early impacts of the COVID–19 pandemic on Australia’s population. The population under the ‘central scenario’ was used for this study, which assumed overseas migration to Australia was significantly affected by the COVID–19 pandemic.
Estimating attributable burden for each scenario in 2030
To examine the impact of different risk factor scenarios on attributable burden between the scenarios for each risk factor, exposure levels were adjusted to reflect the scenario of interest. These scenario-specific population exposures were then used to calculate scenario-specific PAFs which were then applied to the projected burden estimates to estimate attributable burden in 2030. This method involves determining the theoretical minimum risk exposure distribution (TMRED), which is the level of hypothetical exposure that would lead to the lowest conceivable disease burden. The TMREDs for each risk factor are:
for overweight (including obesity): 20–25 kg/m2
- for physical inactivity: 4,200+ MET-mins.
Further details on attributable burden estimation based on ABDS 2018 methods are described elsewhere (AIHW 2021b).
Two scenarios applied to both risk factors are explored in this project:
- Stable scenario: estimates were based on the application of population attributable fractions for the reference year 2018 to the projected disease burden for 2030. This assumes that these remain the same for the year 2030.
- Target scenarios: various scenarios that represent improved population exposure through to 2030 are compared with the stable scenario (in which 2018 exposure is maintained).
- For physical inactivity, various target scenarios that reflect additional minutes of moderate-intensity activity per week, such as going for a brisk walk, were included. These scenarios provide additional granularity on the marginal impacts of increasing activity to assess the burden prevented. As physical activity is measured in terms of METs, the appropriate level of MET-mins was added to respondents in the ABS National Health Survey 2017–18 to reflect changes in exposure. See Table 1 for a summary of the additional MET-mins assigned to respondents to estimate exposure in each scenario.
- For overweight (including obesity), 3 target scenarios were explored. The first 2 scenarios represent a reduction in BMI of 1 kg/m2 and 2 kg/m 2 in the population at risk. In this case, a 1-unit and 2-unit reduction was made to the BMI of respondents in health survey data to re-estimate exposure. The third scenario represents the one where individuals of obese status reduced their BMIs to meet the minimal requirement to be classified as overweight (but not obese). In this case, respondents measuring greater than or equal to 30 kg/m2 were assigned a BMI value of 29.99 kg/m2, placing them in the overweight (but not obese) category, with zero population prevalence of obesity.
Additional time of moderate-intensity activity in scenarios | Additional MET-mins per week based on moderate intensity |
|---|---|
15 mins per week | 75 |
30 mins per week | 150 |
60 mins per week | 300 |
15 mins, 5 days a week | 375 |
30 mins, 5 days a week | 750 |
60 mins, 5 days a week | 1500 |
A trend scenario was also explored for overweight (including obesity) where current trends in exposure were extended to 2030. Exposure to risk within the trend scenario were based on log-linear regression of weighted median BMI using successive ABS National Health Survey data, by sex and 5-year age groups. Results were extrapolated to the year 2030 to determine relative change (that is, the percentage change) in BMI between 2030 and the latest survey year. These changes were then applied to 2017–18 survey data by each age and sex group to determine 2030 projected population exposure.
Limited data were available to inform sufficient projections for a trend scenario of physical activity to 2030. Physical activity in the ABDS is comprised of a number of components including leisure activity, walking for transport, occupational activity, gardening, chores, and strength and toning. The inconsistent availability and quality of some of these components across surveys resulted in unreliable comparisons over time, and therefore projections. Leisure activity and walking for transport are the only components with sufficient time series data to inform trends. However, time series data for other components are inconsistent, particularly occupational activity data which make up a large portion of overall activity (particularly among males). This means that 2030 projections of physical inactivity population exposure were not possible to estimate for this report.
Assumptions and limitations
The projection of disease burden in 2030 uses 2018 disease burden rates (using ABDS 2018 estimates) applied to projected population estimates in 2030. This method assumes that the impacts of changes in BMI and physical activity on YLL and YLD rates are offset by all other drivers of changes in rates of disease burden.
As mentioned in the report, it is important to note that these risk factors are inter-related and may sit on the same causal pathway for disease and other risk factors. Physical activity requires energy expenditure to produce bodily movements, which subsequently has impacts on a person’s weight when this energy expenditure is taken from fat cells, resulting in reductions to BMI (WHO 2018). Similarly, the additional health risk of high levels of BMI can also be moderated by other factors including diet and genetics. The ABDS 2018 employs the use of mediation factors to account for inter-relatedness between risk factors when estimating attributable burden. Adjustments for associations between physical inactivity and high BMI, including considerations for energy balance or replacement, is not examined in this work. As such, the attributable burden estimates for each risk factor assess their direct short-term effects (that is, burden prevented in that year) on their linked diseases and independently of each other. Further improvements in longer-term health outcomes are therefore not captured in the analysis.
All scenarios assume homogeneity in the population for characteristics that may confound the association between these risk factors and linked diseases. However, as health experiences differ between population subgroups, assessment of attributable burden based on population-specific exposure to risk factors may show results different from those presented here. The results in this report refer to Australia’s general population. Specific population groups may therefore experience different patterns of disease burden attributable to risk factors.
The projections used to develop the trend scenarios are based on extrapolations of the most recent health survey data on risk factor exposure. The methods thus assume that the relative risks of developing linked diseases attributable to risk factor exposure remain constant over time, without adjustment for other factors that may also influence risk of disease. This also includes potential developments in identifying additional linked diseases or developments in medical technology, for example, which may improve disease risk despite worsening exposure to risk factors. Similarly, this method to estimate trend scenario risk factor exposure assumes no impacts due to cohort effects in the population.
The target scenarios assume that the improvements in exposure are made and maintained from 2018 until 2030. It is therefore also assumed that any immediate or gradual (due to time lags) health benefits from improving population exposure to these risk factors would be realised by this point.
The target scenario of shifting the population from obese status to overweight (but not obese) represents a conservative scenario of reducing obesity exposure in the population. The BMI of 29.99 kg/m2 assigned to those in the obese population is the highest level of overweight (but not obese) status that satisfies this scenario. Therefore, attributable burden prevented in this target scenario may represent an underestimate where the population minimally meets the target. In practice, individuals achieving this target may realistically decrease their BMI to below 29.99kg/m2 and so may prevent additional attributable burden in 2030.
While measured BMI in the ABS National Health Surveys was used to estimate the prevalence of overweight (including obesity) in the population, physical activity is based on self-reported information by the participants. This relies on people accurately remembering their physical activity levels, which can introduce recall bias in reporting physical activity.
The use of METs as a measure for activity does not account for differences in benefits due to various types of activity. For example, on this scale, strengthening and toning is not distinguished from activity such as walking for transport, where specific health benefits may differ between these types of activities, outside of energy expenditure. Additionally, in using METs as a measure of exposure, it is the total number of additional MET-mins over a week that is important in determining improvements to health risk. For example, 15 minutes of moderate-intensity activity, 5 days a week, amounts to 75 minutes in total. These 75 minutes could be distributed over any number of days to achieve the same benefit. MET calculations are also based on self-reported activity which is prone to bias and recall error.
Among those aged under 20 years, only asthma is included in this study as a disease linked to overweight (including obesity) while physical inactivity attributable burden was only assessed for adults aged 20 years and older. Further work is needed to determine the potential burden prevented among all diseases linked to overweight (including obesity) and physical inactivity in children.
About the Australian Burden of Disease Study
The Australian Burden of Disease Study (ABDS) includes estimates of disease burden of more than 200 diseases and injuries in Australia. Burden of disease analysis is a way of measuring the impact of diseases and injuries on a population (in this report, the population of Australia). It is the difference between a population’s actual health and its ideal health, where ideal health is living to old age in good health (without disease or disability).
Information and reports about burden of disease in Australia, including for Aboriginal and Torres Strait Islander people, are available on the AIHW website.
For further information or for customised data requests please contact the AIHW Burden of Disease team: [email protected]
Key developments since the Australian Burden of Disease Study 2018
Evidence for the association between physical activity and mental health disorders, including depression, is prevalent in the literature, where activity is seen as an important preventive measure and management strategy for people who experience mental ill-health (Harris and Nichols 2019). A meta-analysis conducted by Pearce et al. (2022) has allowed for the quantification of this risk at varying levels of physical inactivity which have been incorporated into this project (Pearce et al. 2022). For the first time in ABDS risk factor attributable burden analysis, depressive disorders as a cause have been included as a disease linked to exposure to physical inactivity. As a result of this addition, attributable burden results due to physical inactivity cannot be compared with those found in previous iterations of the ABDS.
For the first time, national disease burden estimates were projected for the most recent year at the time of publication (2022), which includes estimates of disease burden due to COVID-19 (AIHW 2022). See the Australian Burden of Disease Study 2022 for more information. Risk factor attributable burden was not estimated in ABDS 2022, therefore ABDS 2018 remains the most up-to-date data and methods available for use with this scenario modelling work.
About the ABS National Health Survey
This web report contains results and estimates based on extrapolation of data based on exposure trends from the Australian Bureau of Statistics (ABS) National Health surveys (NHS) 2007–08, 2011–12, 2014–15 and 2017–18.
The 2017–18 NHS is the most recent in a series of Australia-wide health surveys conducted by the ABS that was unaffected by the COVID-19 pandemic. It was designed to collect a range of information about the health of Australians, including:
- prevalence of long-term health conditions
- prevalence of health risk factors such as smoking, overweight and obesity, alcohol consumption and exercise
- use of health services such as consultations with health practitioners and actions people have recently taken for their health
- demographic and socioeconomic characteristics.
The 2017–18 NHS collected data on children and adults living in private dwellings but excluded persons living in non-private dwellings, very remote areas and discrete Aboriginal and Torres Strait Islander communities. For further information, refer to the ABS National Health Survey: First Results, 2017–18.
Due to the pandemic, physical measurements (including height, weight and waist circumference) were not taken at the time of the NHS 2020–21, the most recent NHS. Results from the NHS 2022–23 are yet to be released.