Summary

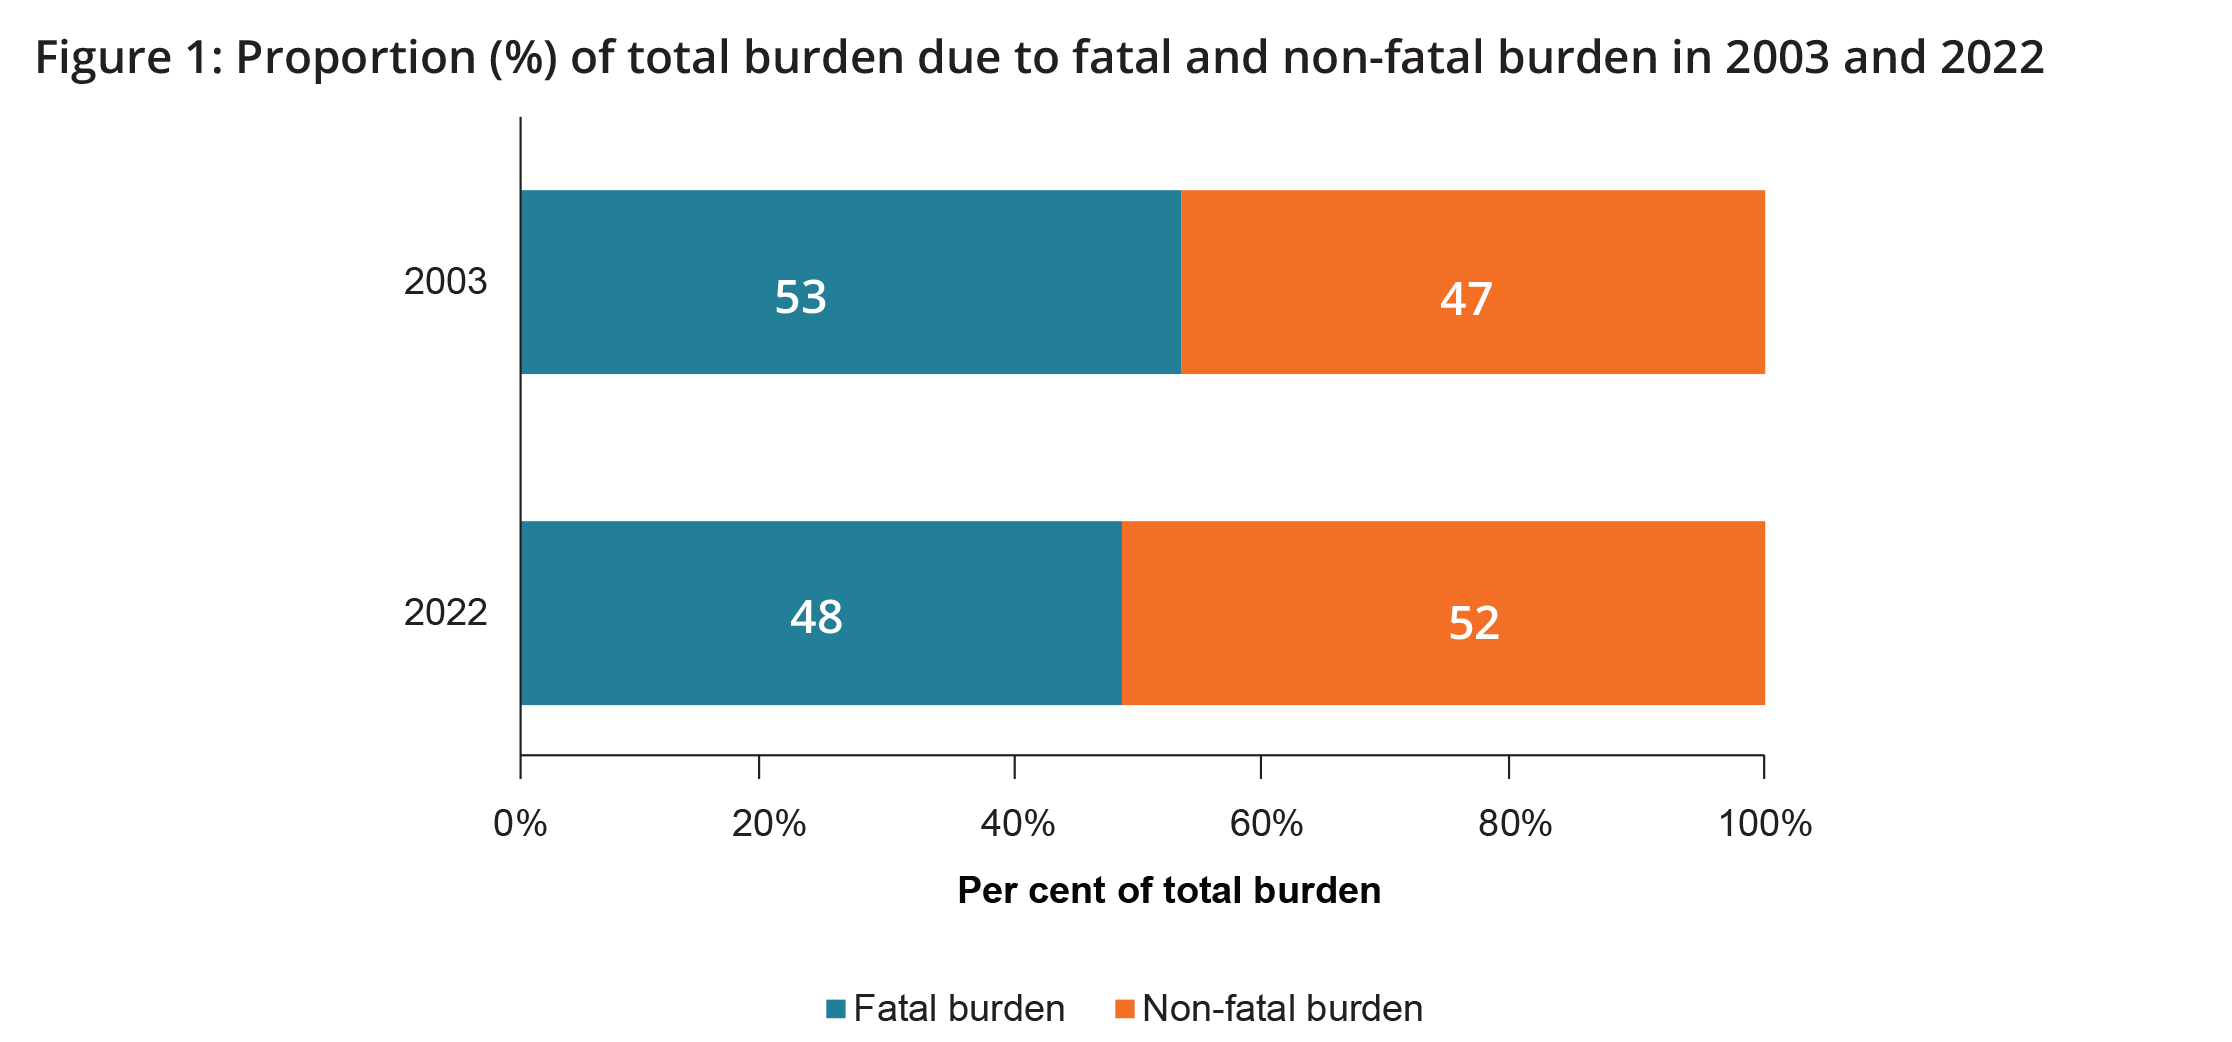
Living with illness (non-fatal)
52%
of total burden

Dying prematurely (fatal)
48%
of total burden
Living with illness or injury caused more disease burden than dying prematurely. Between 2003 and 2022, there has been a moderate shift from fatal burden to non-fatal burden being the biggest contributor to total burden. This is mostly driven by fewer premature deaths in more recent years. See the Burden of disease in Australia and the Fatal vs. non-fatal burden interactive data visualisations to further explore the contribution of fatal and non-fatal burden over time.
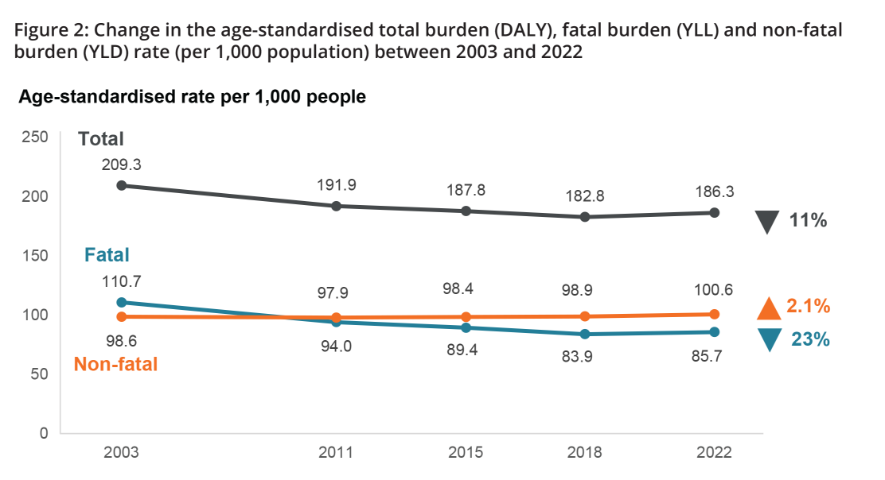
Significant improvements in fatal burden
Over the 19-year period from 2003 to 2022, the rate of total disease burden (the crude rate) remained fairly constant (212 DALY per 1,000 population in 2003 compared with 213 DALY per 1,000 population in 2022). Underlying this was an 8.5% decrease in the rate of fatal burden while the rate of non-fatal burden increased by 11% over that period.
After adjusting for population ageing, there was an 11% decline in the age-standardised rate of total burden between 2003 and 2022. This was driven by a 23% decrease in the rate of fatal burden, as non-fatal burden rates increased slightly. Note that rates for 2022 are higher than 2018 for total, fatal and non-fatal burden. However, when only diseases that were present in the earlier reference years are included (that is, COVID-19 is excluded), fatal and total burden rates were lower for 2022 than 2018.
Crude rates show the actual rate of disease burden in each year. Whereas age-standardised rates show the rate of burden, if the population age structure did not change over time. Given that Australia’s population is ageing, and the incidence of most chronic diseases increases with age, presenting both crude and age-standardised rates is important to determine whether or not changes in disease burden are largely a result of an ageing population.
To further explore changes over time, see the Comparisons over time interactive data visualisation.
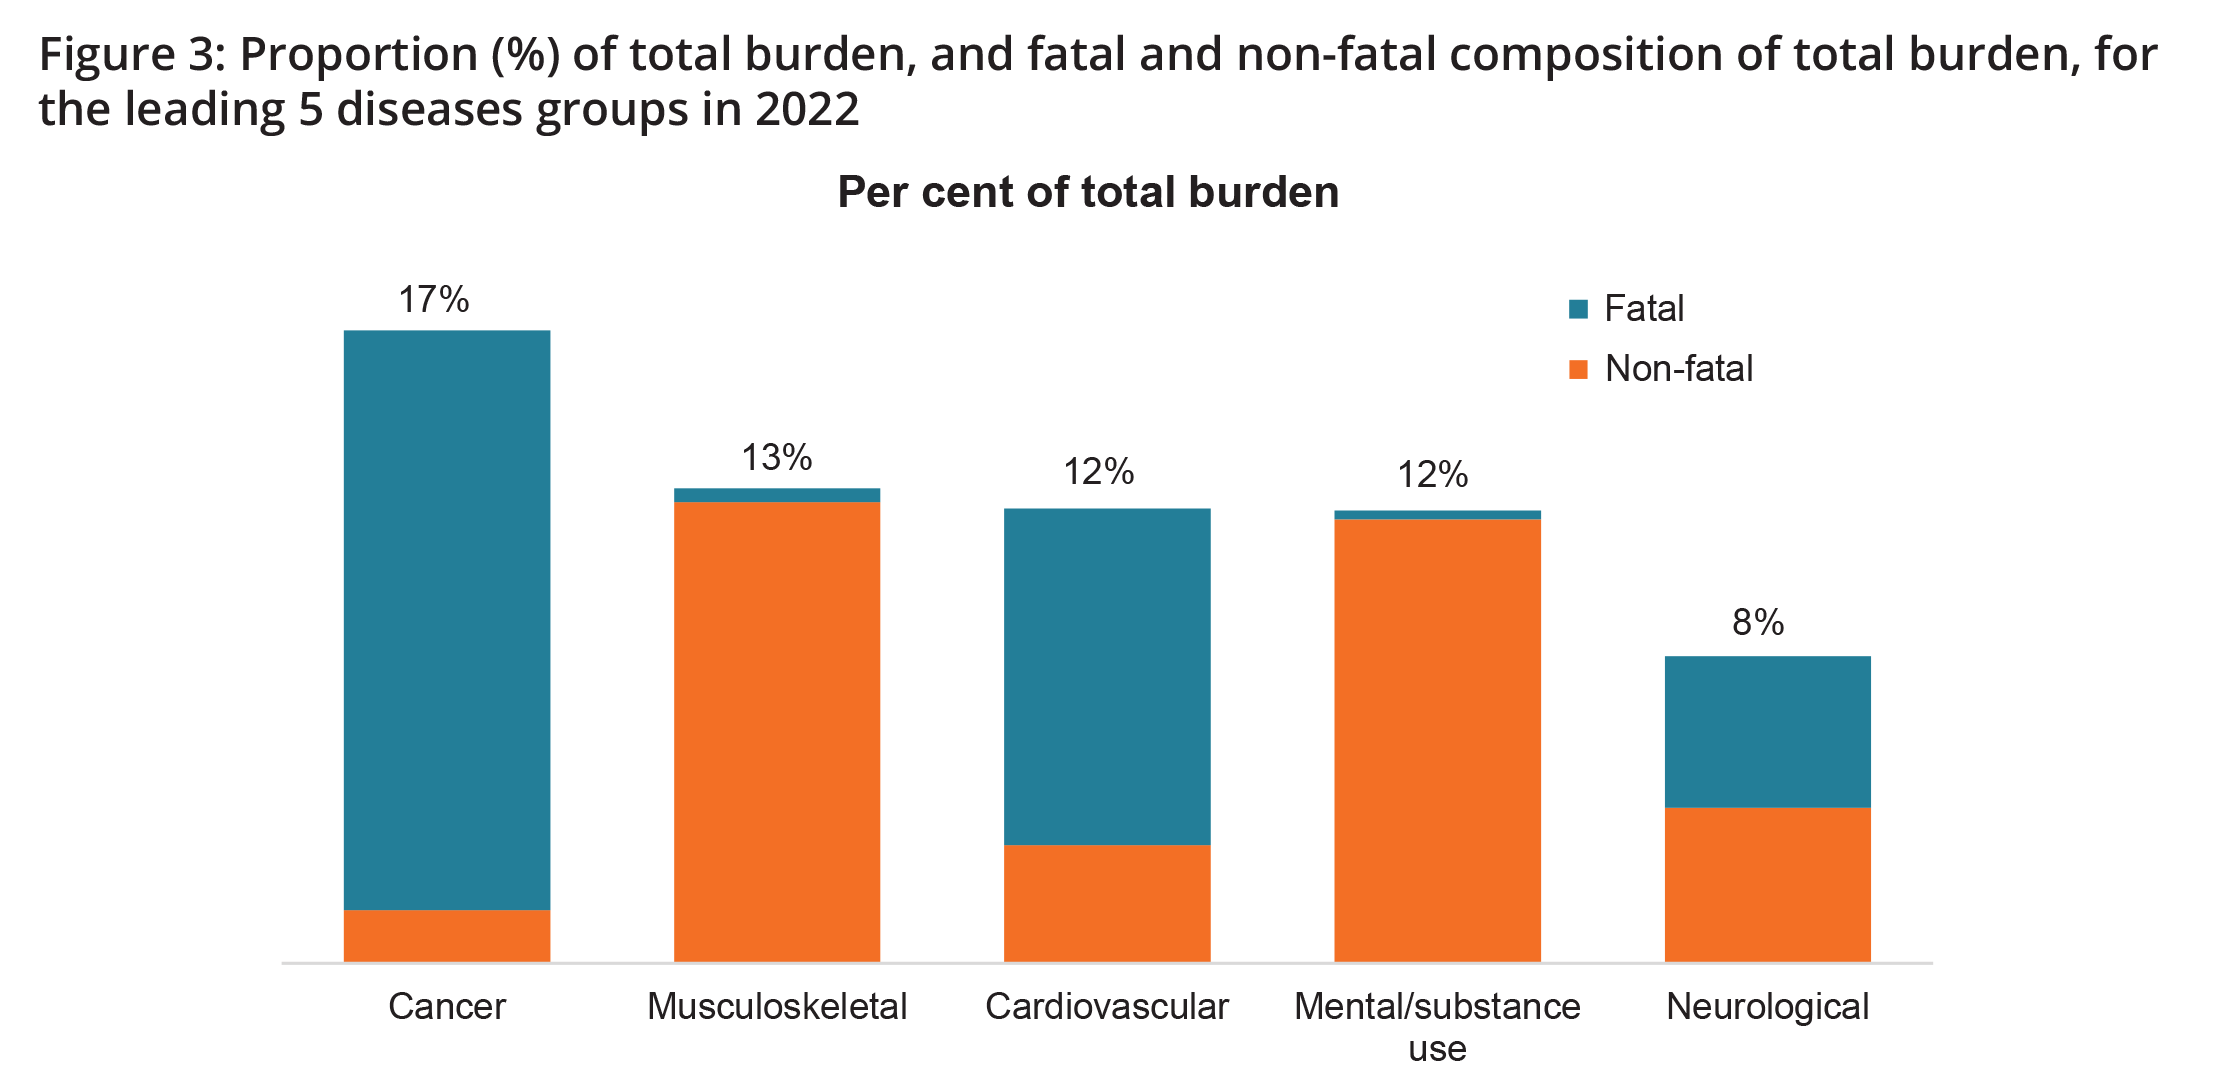
Chronic diseases cause most of the burden
In 2022, the 5 disease groups causing the most burden were cancer, musculoskeletal conditions, cardiovascular diseases, mental health conditions & substance use disorders and neurological conditions.
Together these disease groups accounted for around two-thirds (62%) of the total burden. These disease groups include mostly chronic, or long-lasting, conditions.
Cancer as a disease group contributed the most burden across all years of the Study.
See the Fatal vs non-fatal burden interactive data visualisation to explore the contribution of fatal and non-fatal burden to total burden by disease group or by specific disease or injury.
Coronary heart disease the leading specific cause of burden
When considering individual diseases, coronary heart disease was the leading cause of burden for every reference year in the Study. However, the burden from coronary heart disease showed the largest absolute reduction over time and was mainly driven by large declines in fatal burden.
The leading 5 diseases that caused burden (% of total DALY) in 2022:
- Coronary heart disease (5.5%)
- Dementia (4.4%)
- Back pain & problems (4.2%)
- Chronic obstructive pulmonary disease (COPD) (3.7%)
- Anxiety disorders (2.9%).
See the Disease/injury-specific interactive data visualisation to explore burden for individual diseases and changes in disease burden over time.
COVID-19 caused considerable burden in 2022
COVID-19 is a disease caused by severe acute respiratory syndrome coronavirus 2 (SARS-CoV-2). It is a highly infectious disease and has a wide spectrum of severity.
The total burden from COVID-19 was 151,400 DALY (5.8 DALY per 1,000 population), ranking 8th among the specific diseases in 2022. It contributed 2.7% of the total burden. The burden from COVID-19 was predominantly fatal (73%) and was higher in males. The burden was highest in those aged 75–84 years.
COVID-19 was the 5th leading cause of fatal burden (contributing 4.1%) and 21st leading cause of non-fatal burden (contributing 1.4% in 2022).
Note that estimates of the disease burden due to COVID-19 in 2022 were based on information and data available at the time of analysis. This included data on deaths, cases and hospitalisations up until August 2022. Assumptions were made on the number and severity of COVID-19 cases, the number of cases who developed long COVID and the number of cases and deaths due to COVID-19 in the latter half of 2022 (including that there are no notable changes due to a new variant). Refer to the Technical notes for information on how disease burden due to COVID-19 was estimated.
Given the dynamic and ongoing nature of the pandemic, estimates presented here may be updated in the future as more data become available, and more is learnt about the disease and its impact on the population.
Males and females experience disease burden differently
Overall and for most age groups, males experienced more total burden than females. This was driven by males having higher rates of fatal burden.
In 2022, males experienced 1.1 times the rate of total burden and 1.5 times the rate of fatal burden of females (227 and 200 DALY per 1,000 population and 122 and 84 YLL per 1,000 population, respectively), however, females experienced 1.1 times the rate of non-fatal burden of males (116 and 105 YLD per 1,000 population, respectively). After adjusting for different age structures, males experienced 1.2 times the rate of total burden and 1.6 times the rate of fatal burden of females while rates of non-fatal burden were similar.
In 2022, the leading causes of total burden among males were coronary heart disease, suicide & self-inflicted injuries and back pain & problems. Among females, the leading cause was dementia, followed by back pain & problems and COPD.
Males experienced over 3 times the amount of burden due to suicide & self-inflicted injuries and more burden from coronary heart disease and lung cancer than females, while females experienced more burden from dementia and osteoarthritis.
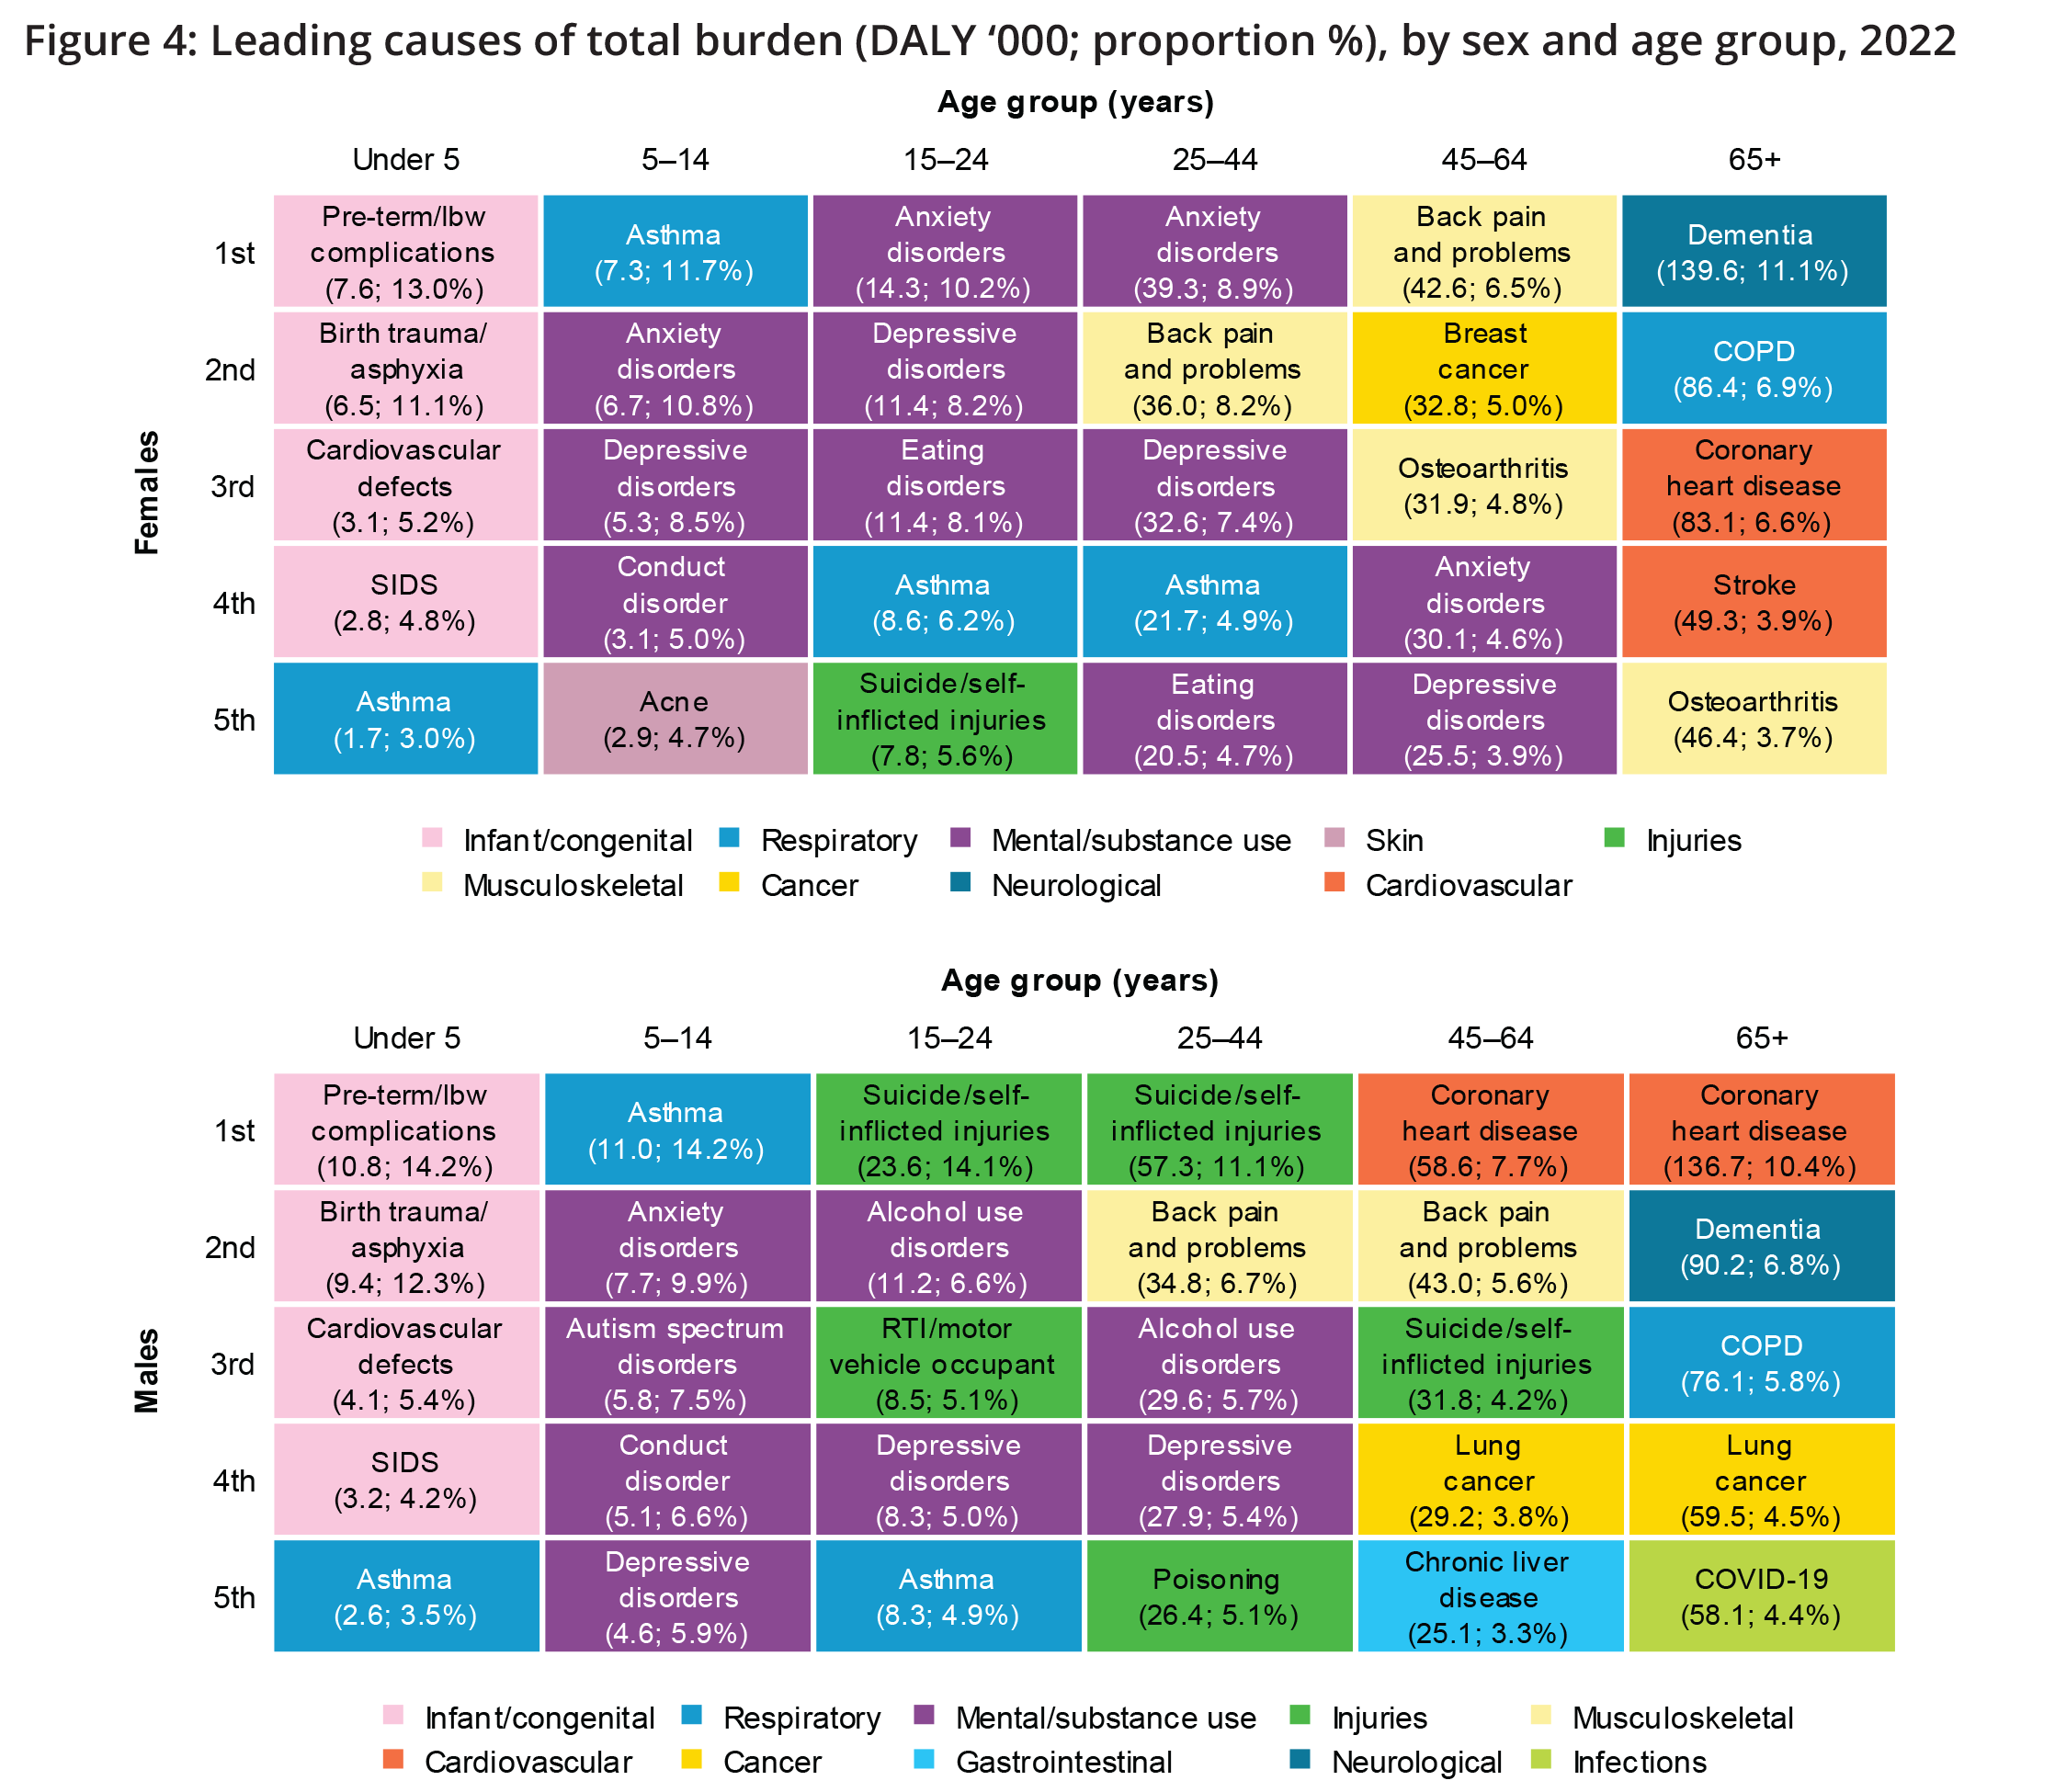
Diseases that caused the most burden over the life course
Australians experience health loss from different diseases and injuries at various stages of life (Figure 4). When looking at the leading causes of total burden in 2022 over the life course:
Infants and children aged under 5:
- Infant & congenital conditions as a group caused the most burden. Pre-term & low birthweight (lbw) complications, birth trauma & asphyxia, cardiovascular defects, sudden infant death syndrome (SIDS) and asthma were the leading 5 specific causes of burden.
Children aged 5–14:
- Mental health conditions and respiratory diseases contributed the most burden. Among boys and girls, asthma was the leading specific cause of burden, followed by anxiety disorders. Depressive disorders and conduct disorder were also among the 5 leading causes. Autism spectrum disorders was among the leading 5 causes for boys, whereas acne was among the leading 5 causes for girls.
People aged 15–24:
- Mental health conditions & substance use disorders, and injuries contributed the most burden. Suicide & self-inflicted injuries was the leading specific cause of burden in males. Anxiety disorders was the leading specific cause in females.
- Depressive disorders and asthma were among the leading 5 individual causes of burden for both males and females in this age group. Alcohol use disorders and road traffic injuries (RTI) – motor vehicle occupants were leading causes among males but not females. Anxiety disorders and eating disorders were leading causes among females but not males.
People aged 25–44:
- Mental health conditions & substance use disorders, musculoskeletal conditions and injuries contributed the most burden.
- Back pain & problems and depressive disorders were among the leading 5 specific causes of burden. Alcohol use disorders and poisoning were in the top 5 causes of burden for men, whereas asthma and eating disorders were among the top 5 causes for women.
People aged 45–64:
- Cardiovascular diseases and musculoskeletal conditions caused the most burden among this age group. Coronary heart disease was the leading specific cause among men and back pain & problems was the leading specific cause in women.
- Among men, back pain & problems, suicide & self-inflicted injuries, lung cancer and chronic liver disease were among the leading 5 specific causes of burden. Among women, breast cancer, osteoarthritis, anxiety and depressive disorders were among the leading 5 specific causes of burden.
People aged 65 and over:
- Cardiovascular diseases, cancers and musculoskeletal conditions were leading causes of burden in the older age groups. Coronary heart disease, dementia and COPD were all among the leading specific causes of burden in men and women.
- Stroke and osteoarthritis were among the 5 leading causes of burden for women while lung cancer and COVID-19 were among the 5 leading causes for men.
See the Leading causes of disease burden interactive data visualisation for more information on the leading causes of total, fatal and non-fatal burden in Australia by sex and age and explore how this has changed over time.
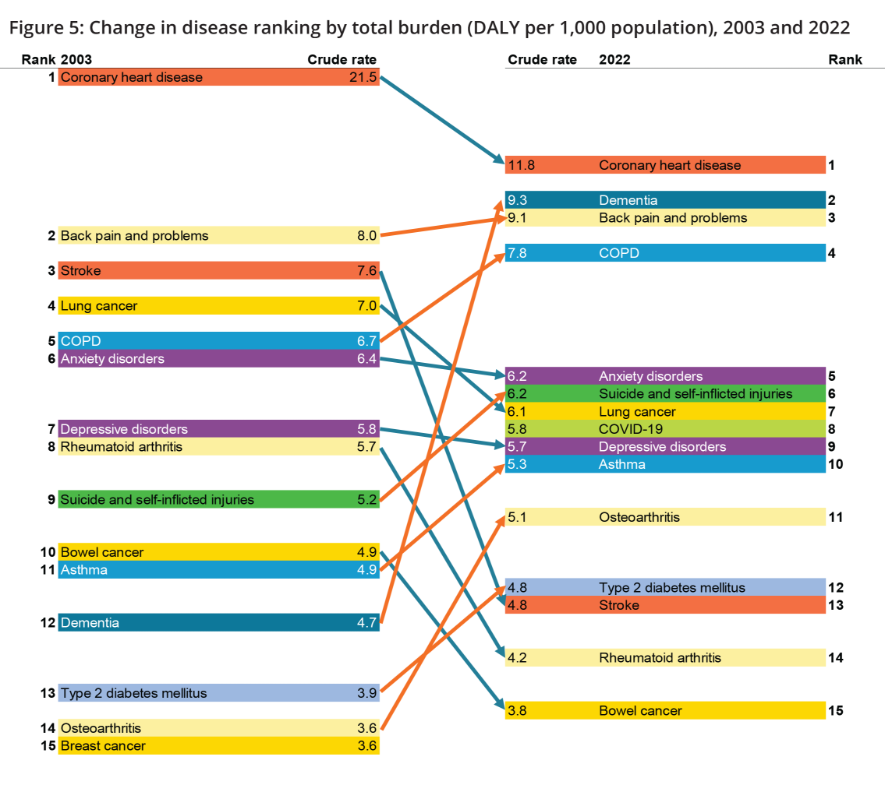
Changes in leading specific causes of disease burden over time
Over time, the leading individual causes of disease burden in Australia have changed (Figure 5). Between 2003 and 2022, the crude rate of total burden:
- decreased for coronary heart disease, stroke, lung, bowel and breast cancer and rheumatoid arthritis. Coronary heart disease and stroke were the leading causes of fatal burden in 2003, however, premature deaths from these causes have decreased over time.
- substantially increased for dementia and its rank increased from the 12th leading cause of total burden in 2003 to the 2nd leading cause in 2022. However, this increase is partly due to changes in practices of coding deaths due to dementia (see Comparisons over time and Technical notes).
- increased for suicide & self-inflicted injuries, back pain & problems, COPD, type 2 diabetes, asthma and osteoarthritis. Back pain & problems was the leading cause of non-fatal burden in 2022.
Age-standardised rates show the rate of burden if the population age structure did not change over time, which can indicate whether changes in disease burden are largely a result of an ageing population. This is important, as the rate of many of the leading causes of disease burden in Australia increase with age.
There were differences in the leading causes of total burden and therefore their ranking when looking at age-standardised burden rates compared with crude burden rates. The rankings of age-related conditions (such as dementia, COPD, some cancers, osteoarthritis and hearing loss) were often lower in more recent years when ranking by age-standardised rates compared with crude rates. This indicates that an ageing population is a factor in changes to Australia’s leading causes of disease burden.
See the Leading causes of disease burden interactive data visualisation to explore changes in the leading causes of disease burden over time (by number and age-standardised rate).
Notes
- Diseases are presented in descending order, from highest to lowest DALY per 1,000 population, with arrows indicating either an increase (orange) or decrease (blue) in total burden crude rate over time.
- ‘Other musculoskeletal conditions’ are excluded from the rankings.
- There were changes in practices of coding deaths due to dementia; therefore, caution is recommended when interpreting changes over time for dementia burden.
Australians living longer but little change in the proportion of life spent in full health
Australians are, on average, living longer and spending more years in full health (meaning no disease or injury). Years lived in full health is also referred to as the health-adjusted life expectancy (HALE). However, years lived in ill health are also increasing, resulting in little change in the proportion of life spent in full health.
Box 1: Interpreting changes in HALE over time
Whether or not the amount of ill health experienced by older Australians has increased has been the subject of ongoing debate. Assessment of how the relationship between life expectancy and HALE has changed over time (by analysing the ratio and difference between the 2 measures) provides an opportunity to examine which of the scenarios of healthy ageing – compression or expansion of morbidity, or equilibrium – provides the best insight into whether longer lives are healthier lives. These 3 health scenarios are described as follows:
Compression of morbidity
In this scenario, increasing life expectancy is accompanied by better health. As the population ages, there is also a delay in the age of onset of disease. As such, we can expect a reduction in the proportion of life spent in ill health (Fries 1980) as most morbidity occurs at the end of life.
Expansion of morbidity
In this scenario, increasing life expectancy is accompanied by more illness and injury before death. As chronically ill people survive for longer, we can expect an increase in the proportion of their lives spent with illness (Gruenberg 1977).
Dynamic equilibrium
In this scenario, the proportion of the lifetime spent living with illness remains relatively constant over time. As life expectancy increases, so does the onset and progression of disease – but as diseases grow more prevalent, they may also be less severe (Howse 2006). If the ratio of HALE to total life expectancy is constant, there is an equilibrium.
Findings from HALE analysis suggest a scenario of equilibrium between 2003 and 2022.
Males and females born in 2022 could expect to live an average of 88% and 87% of their lives in full health respectively (71.6 years of the 81.2 years of average life expectancy for males and 74.1 years of the 85.3 years of average life expectancy for females).
Between 2003 and 2022, the average proportion of life spent in full health changed little for both males (from 89% to 88%) and females (from 88% to 87%). Over this period, males gained 3.1 years in life expectancy and 2.2 years in HALE (Figure 6). The corresponding gains for females were 2.3 years in life expectancy and 1.3 years in HALE. While most of the gains in life expectancy were healthy years, the average time spent in ill health increased by 0.9 years for males and 1.1 years for females.
These changes are illustrated in Figure 6, showing the split in life expectancy that is average number of healthy years (HALE) and average years in ill health. The results suggest that, at the national level, gains in healthy years at birth are largely comparable with gains in life expectancy at birth. It suggests an equilibrium of morbidity in Australia over this period. Of note, these changes may be influenced by data variations over time.
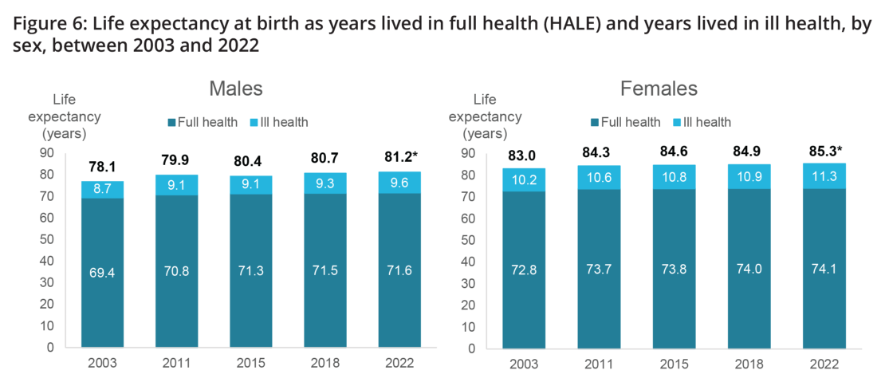
* The life expectancy used to calculate HALE in 2022 was sourced from the 2018–2020 life table (ABS 2021). Life expectancy in Australia has generally increased over time, however a small decline in life expectancy for 2020–2022 is anticipated due to the impact of COVID-19. For more information on HALE and the life expectancies used, see Technical notes.
Changes over time in HALE and life expectancy at age 65 followed a similar pattern as at birth. For people aged 65, life expectancy and HALE increased between 2003 and 2022 by 2.5 and 1.9 years, respectively, for men and by 1.9 and 1.1 years, respectively, for women.
See the Health-adjusted life expectancy interactive data visualisation for more detailed data on the proportion of life spent in full health by age and how this has changed over time.
National Preventive Health Strategy 2021–30: burden of disease targets
The National Preventive Health Strategy 2021–30 (the ‘Strategy’) outlines the long-term approach to prevention in Australia over the next 10 years. The Strategy aims to address the wider determinants of health, promote health equity and decrease the overall burden of disease through a whole-of-systems approach to prevention (Department of Health 2021).
To assess progress over the 10-year period, the Strategy outlines several targets to achieve by the year 2030. There are 6 burden of disease specific targets in the Strategy and data from the Australian Burden of Disease Study 2022 can be used to monitor 3 of the 6 targets:
- the proportion of the first 25 years lived in full health will increase by at least 2 percentage points by 2030
- the proportion of the first 0–4 years of life lived in full health will increase by at least 3.5 percentage points by 2030
- Australians have at least an additional 2 years of life lived in full health by 2030.
Estimates for the remaining 3 indicators involve analysis at subnational level, which was not in the scope of the current report. These targets are:
- Australians in the 2 lowest socioeconomic groups will have at least an additional 3 years of life lived in full health by 2030
- Australians in regional and remote areas will have at least an additional 3 years of life lived in full health by 2030
- Aboriginal and Torres Strait Islander people will have at least an additional 3 years of life lived in full health by 2030.
Refer to the Australian Burden of Disease Study: impact and causes of illness and death in Australia 2018 and Australian Burden of Disease Study: impact and causes of illness and death in Aboriginal and Torres Strait Islander people 2018 for estimates of burden of disease by population group.
Australia’s current performance against the targets
Table 1 shows how the burden of disease measures in 2022 compare with the baseline measures (the year 2018) for each reportable target. Between 2018 and 2022, there has been little change in the proportion of the first 25 years and 0–4 years lived in full health but there were small improvements in the average number of years lived in full health.
| Aim | Target | Sex | 2018 (baseline) | 2022 estimate | Comparison to 2018 |
|---|---|---|---|---|---|
| All Australians have the best start in life | The proportion of the first 25 years lived in full health will increase by at least 2 percentage points by 2030 The proportion of the first 0–4 years of life lived in full health will increase by at least 3.5 percentage points | Persons
Persons | 92.5% of first 25 years were lived in full health
92.0% of first 5 years were lived in full health | 92.1% of first 25 years were lived in full health
91.1% of first 5 years were lived in full health | –0.4(a)
–0.9(a) |
| All Australians live in good health and wellbeing for as long as possible | Australians have at least an additional two years of life lived in full health by 2030 | Males Females | 71.5 years lived in full health 74.0 years lived in full health | 71.6 years lived in full health 74.1 years lived in full health | 0.1 years 0.1 years |
(a) This is the difference in the proportion of the first 25 or 5 years lived in full health between 2022 and the baseline (2018).
Note that estimates for 2022 are projections so progress against the targets may change as 2022 data become available. COVID-19’s impacts on burden and the population may affect progress against these targets.