Page highlights

What is osteoporosis?

  • Osteoporosis is a chronic condition defined by low bone mineral density, which increases the risk of fractures.
  • Osteopenia refers to bone mineral density that is lower than normal but not low enough to be classified as osteoporosis.

How common is osteoporosis?

An estimated 924,000 (3.8%) people in Australia reported having osteoporosis or osteopenia in 2017–18. The true prevalence, including undiagnosed cases, is likely to be higher than this.

Impact of osteoporosis

  • People with osteoporosis or osteopenia had around double the rates of reporting ‘fair’ to ‘poor’ health (15%), ‘high’ to ‘very high’ psychological distress (26%) and ‘moderate’ to ‘very severe’ bodily pain (57%), compared with people without the conditions after adjusting for age.
  • 29% of fall burden was attributed to low bone mineral density, equivalent to 0.4% of total disease burden in 2018.
  • In 2018–19, an estimated $1.2 billion or 29% of expenditure for falls was attributed to low bone mineral density, representing 1.9% of total health system expenditure.
  • Osteoporosis contributed to 2,366 deaths or 6.5 deaths per 100,000 population in 2021, representing 1.4% of all deaths.

Treatment and management of osteoporosis and minimal trauma fractures

  • In 2021–22, there were 9,500 hospitalisations with a principal diagnosis of osteoporosis (89 hospitalisations per 100,000 population) for people aged 45 and over.
  • There were105,000 hospitalisations for minimal trauma fractures in people aged 45 and over in 2021–22, 28% of these were hip fractures.
  • The rate of minimal trauma hip fractures increased from 2015–16 to 2017–18 and then decreased gradually but consistently thereafter possibly reflecting measures to reduce risk factors and prevent falls.

What is osteoporosis?

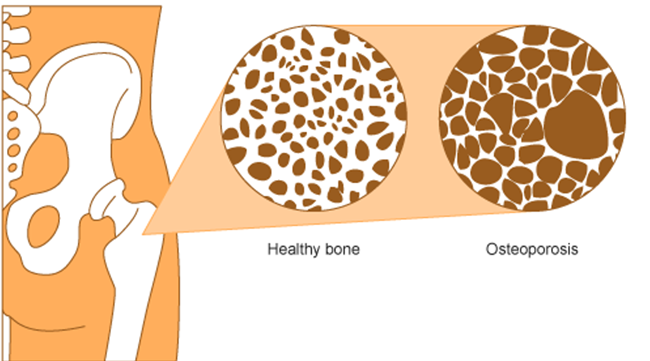
Osteoporosis (meaning 'porous bones') is a condition that arises when bones become less dense, lose minerals such as calcium and are more fragile (Figure 1) (Health Direct 2023; Healthy Bones Australia 2023). As a result, even a minor bump or accident can cause a fracture (broken bone). Such events might include falling out of a bed or chair, or tripping and falling while walking. Fractures due to osteoporosis can result in chronic pain, disability, loss of independence and premature death (Bliuc et al. 2013).

When bone density is lower than normal but not low enough to be classified as osteoporosis, it is known as osteopenia, which can progress to osteoporosis.

Figure 1: Comparison of healthy bone and bone with osteoporosis

This figure shows a comparison of a healthy bone and one with osteoporosis.

Risk factors associated with the development of osteoporosis include increasing age, being female, family history of the condition, low vitamin D levels, low intake of calcium, low body weight, smoking, excess alcohol consumption, physical inactivity, long-term corticosteroid use and reduced oestrogen level (Ebeling et al. 2013).

Preventing osteoporosis

Osteoporosis is largely a preventable disease. The goal of the prevention and treatment of osteoporosis is to maintain bone density and reduce a person’s overall fracture risk (RACGP 2018).

Primary prevention of osteoporosis involves supplementing diet to get sufficient calcium and vitamin D, and behaviour modification such as regular weight-bearing and resistance exercise, keeping alcohol intake low and not smoking, and fall reduction strategies, such as addressing vision impairment or making home modifications (RACGP 2018). Managing osteoporosis includes a diverse range of medicines as treatment options – see What medicines are used to treat osteoporosis?

Diagnosing osteoporosis

Diagnosis of osteoporosis requires an assessment of bone mineral density (BMD). The most commonly used technique is a specialised X-ray known as a 'Dual energy X-ray Absorptiometry (DXA) scan' to determine bone mineral density (BMD) in the hips and spine (IOF 2017). Scan results are expressed as T-scores which compare a person's BMD with the average of young healthy adults (Table 1) (WHO 1994).

Table 1: Diagnosing osteoporosis using bone density testing
 NormalOsteopeniaOsteoporosis
T-Score1 to -1-1 to -2.5-2.5 or lower

Source: WHO Study Group 1994.

Generally, osteoporosis is under-diagnosed. Because osteoporosis has no overt symptoms, it is often not diagnosed until a fracture occurs. It is therefore difficult to determine the true prevalence of the condition (that is, the number of people with the condition). Information about 'diagnosed cases' is likely to underestimate the actual prevalence of the condition.

How common is osteoporosis?

An estimated 924,000 (3.8%) people in Australia reported having osteoporosis or osteopenia, according to the 2017–18 Australian Bureau of Statistics (ABS) National Health Survey (NHS) (ABS 2018).

Prevalence by age and sex

According to the NHS, in 2017–18, the prevalence of osteoporosis and osteopenia collectively:

  • increased greatly with age, from 0.3% of people aged under 44, to 20% of people aged 75 and over
  • was higher among women compared with men (6.2% and 1.4%, respectively)
  • was highest for women aged 75 and over (29%) (Figure 2).

Figure 2: Prevalence of self-reported osteoporosis by age and sex, 2017–18
This figure shows that the prevalence of osteoporosis or osteopenia was higher for females for all age groups compared with males.

Note: Refers to people who self-reported that they were diagnosed by a doctor or nurse as having osteoporosis or osteopenia (current and long term) and also people who self-reported having osteoporosis or osteopenia.

Source: AIHW analysis of ABS 2019a (Osteoporosis 2023 Supplementary data table 1.1).

Prevalence in Aboriginal and Torres Strait Islander (First Nations) people

The Australian Institute of Health and Welfare (AIHW) uses ‘First Nations people’ to refer to Aboriginal and/or Torres Strait Islander people in this report.

According to self-reported data from the ABS National Aboriginal and Torres Strait Islander Health Survey (NATSIHS), in 2018–19, about 18,900 (2.3%) First Nations people reported having osteoporosis (ABS 2019b). 

After adjusting for differences in age structures, osteoporosis prevalence was:

  • the same for females, with no difference by Indigenous status (both 5.1%)
  • 1.9 times as high in First Nations males compared with non-Indigenous males (Figure 3)
  • twice as high for First Nations females compared with First Nations males (5.1% and 2.5%, respectively) 
  • almost the same for First Nations people and non-Indigenous people (3.9% and 3.3%, respectively).

Figure 3: Prevalence of osteoporosis by Indigenous status and sex, 2018–19This figure shows there is little difference in the prevalence of osteoporosis for First Nations people compared with non-Indigenous people.

Note: Rates are age-standardised to the Australian population as at 30 June 2001.

Source: ABS 2019b (Osteoporosis 2023 Supplementary data table 1.2). 

Impact of osteoporosis

How does osteoporosis affect quality of life?

Quality of life can be severely compromised for people with osteoporosis, particularly if they fall and sustain a fracture. Wrist and forearm fractures may affect the ability to write, type, prepare meals, perform personal care tasks and manage household chores. Fractures of the spine and hip can affect mobility, making activities such as walking, bending, lifting, pulling or pushing difficult. Hip fractures, in particular, often lead to a marked loss of independence and reduced wellbeing.

According to the NHS, in 2017–18, after adjusting for age, people aged 45 and over with diagnosed osteoporosis or osteopenia were: 

  • less likely to describe their health as ‘excellent’ or ‘very good’, and 2.7 times as likely to report having ‘fair’ to ‘poor’ health compared with people without the conditions (15% and 5.4%, respectively) (Figure 4) 
  • twice as likely to experience ‘high’ or ‘very high’ levels of psychological distress compared with those without the conditions (26% and 13%, respectively) (Figure 5) 
  • 1.7 times as likely to experience ‘moderate’ to ‘very severe’ bodily pain compared with those without the conditions (57% and 33%, respectively) (Figure 6).

Figure 4: Self-assessed health of people aged 45 and over with and without osteoporosis, 2017–18

This figure shows that people aged 45 and over with osteoporosis or osteopenia are more likely to describe their health as ‘good’ compared with people without the condition.

Note: Rates are age-standardised to the Australian population as at 30 June 2001.

Source: AIHW analysis of ABS 2019a (Osteoporosis 2023 Supplementary data table 2.1).

Figure 5: Psychological distress experienced by people aged 45 and over with and without osteoporosis, 2017–18This figure shows people aged 45 and over with osteoporosis or osteopenia are less likely to experience ‘low’ levels of psychological distress compared with people without the condition.

Notes:

  1. Psychological distress is measured using the Kessler Psychological Distress Scale (K10), which involves 10 questions about negative emotional states experienced in the previous 4 weeks. The scores are grouped into Low: K10 score 10–15, Moderate: 16–21, High: 22–29, Very high: 30–50.
  2. Rates are age-standardised to the Australian population as at 30 June 2001.

Source: AIHW analysis of ABS 2019a (Osteoporosis 2023 Supplementary data table 2.3).

Figure 6: Pain(a) experienced by people aged 45 and over with and without osteoporosis, 2017–18This figure shows people aged 45 and over with osteoporosis or osteopenia are less likely to experience no bodily pain compared with people without the condition.

(a) Bodily pain experienced in the 4 weeks prior to interview. 

Note: Rates are age-standardised to the Australian population as at 30 June 2001.

Source: AIHW analysis of ABS 2019a (Osteoporosis 2023 Supplementary data table 2.2).

Burden of disease

What is burden of disease?

Burden of disease is measured using the summary metric of disability-adjusted life years (DALY, also known as the total burden). One DALY is one year of healthy life lost to disease and injury. DALY caused by living in poor health (non-fatal burden) are the ‘years lived with disability’ (YLD). DALY caused by premature death (fatal burden) are the ‘years of life lost’ (YLL) and are measured against an ideal life expectancy. DALY allows the impact of premature deaths and living with health impacts from disease or injury to be compared and reported in a consistent manner (AIHW 2022a).

Burden of falls attributed to low bone mineral density

In 2018, falls represented 1.5% of total disease burden in Australia. Almost a third (29%) of fall burden was attributed to low bone mineral density, or 0.4% of total disease burden in Australia. Note that this does not represent the complete burden of low bone mineral density, just the proportion associated with falls.

This estimate reflects the amount of burden for falls that could have been avoided if no one in Australia had low bone mineral density.

Variation by age and sex

Burden attributed to low bone mineral density was estimated for people aged 35 and over. The rate of burden:

  • increased greatly with age, from 9.3 DALY per 100,000 population for people aged 35–44, to 1,500 DALY per 100,000 population for people aged 85 and over
  • was 1.5 times greater for females compared with males.

Trends over time

Between 2003 and 2018, the age standardised rate of fall burden attributed to low bone mineral density increased by 16% (from 0.59 DALY to 0.69 DALY per 1,000 population), which is equivalent to a 1.0% per year increase on average.

Further information is available in the Australian Burden of Disease Study 2018: Interactive data on risk factor burden (AIHW 2021).

Health system expenditure

In 2018–19, an estimated 29% of expenditure for falls was attributed to low bone mineral density, equating to $1.2 billion, or 1.9%, of total health system expenditure. Further detail is available in Health system spending per case of disease and for certain risk factors (AIHW 2022b).

How many deaths were associated with osteoporosis?

Osteoporosis was recorded as an underlying and/or associated cause for 2,366 deaths or 6.5 deaths per 100,000 population in Australia in 2021, representing 1.4% of all deaths and 26% of all musculoskeletal deaths. Note that this does not include osteopenia.

Osteoporosis was the underlying cause for 183 deaths (7.7% of all osteoporosis deaths) and an associated cause only, for 2,183 deaths (92% of all osteoporosis deaths).

Variation by age and sex

In 2021, osteoporosis mortality (as the underlying and/or associated cause), in comparison to all deaths, was relatively concentrated amongst:

  • older people (91% of osteoporosis deaths were among people aged 75 and over, compared with 67% of total deaths) 
  • females (79% of osteoporosis deaths were among females, compared with 48% of total deaths) (Figure 7).

Figure 7: Age distribution for osteoporosis mortality, by sex, 2011 to 2021

This figure shows that death rates due to osteoporosis increased after the age group 65–69 and were highest for people aged 85 and over in 2021.

Trends over time

Between 2011 and 2021, age standardised osteoporosis mortality rates per 100,000 population (underlying and/or associated cause):

  • decreased for females for most of the period (from 10 in 2011 to 7.9 in 2020, and then increased to 8.8 in 2021)
  • were relatively stable for males (3.1 and 3.2 in 2011 and 2021, respectively)
  • were between 2.5 and 3.3 times higher for females compared with males for all years (Figure 8).

Figure 8: Trends over time for osteoporosis mortality, 2011 to 2021  

This figure shows there were 2,300 deaths with an underlying and/or associated cause of osteoporosis in 2021. 

Variation between population groups

In 2021, after adjusting for differences in age structure, osteoporosis mortality rates (underlying and/or associated cause) were:

  • 1.2 times higher for people living in Outer regional areas, compared with people living in Remote and very remote areas (7.2 and 5.8 deaths per 100,000 population, respectively)
  • 1.3 times higher for people living in the lowest socioeconomic areas (with the highest level of disadvantage), compared with people living in the highest socioeconomic areas (with the lowest level of disadvantage) (6.8 and 5.4 deaths per 100,000 population, respectively).

For more information on mortality data, see the Chronic musculoskeletal condition mortality data tables 2023.

Treatment and management of osteoporosis and minimal trauma fractures

Treatment recommendations for osteoporosis are often based on an estimate of a person’s risk of breaking a bone in the next 10 years using information such as a bone density test. If the risk is not high, treatment might not include medication and might focus instead on modifying risk factors for bone loss and falls.

Once a patient has experienced a fracture, bone protection medicine is indicated for individuals with a significantly increased risk of further fractures (Ebeling et al. 2023).

What medicines are used to treat osteoporosis?

There is a diverse range of medications available to manage osteoporosis. Treatment selection is guided by factors such as sex, menopausal status, medical history, whether it is for primary or secondary fracture prevention, patient preference and eligibility for government subsidy (Bell et al. 2012).

For more information on medications recommended for osteoporosis,  see Chapter 14 of Guidelines for preventive activities in general practice (RACGP 2018) and Osteoporosis & You (Healthy Bones Australia 2021).

Hospitalisations for osteoporosis

Data from the National Hospital Morbidity Database (NHMD) show that in 2021–22, there were 10,100 hospitalisations with a principal diagnosis of osteoporosis, and 32,500 hospitalisations with a principal or additional diagnosis (any diagnosis) of osteoporosis, representing 0.3% of all hospitalisations. Note that this does not include osteopenia.

The rest of this section discusses hospitalisations with a principal diagnosis of osteoporosis for people aged 45 and over, unless otherwise stated. However, charts and tables also include statistics for any diagnosis of osteoporosis, and all ages.

For people aged 45 and over, in 2021–22:

  • there were 9,500 osteoporosis hospitalisations, representing 0.1% of all age-specific hospitalisations in Australia, and 89 hospitalisations per 100,000 population
  • osteoporosis accounted for 71,600 bed days, representing 0.3% of all age-specific bed days
  • 65% of osteoporosis hospitalisations were overnight stays, with an average length of 11 days (Figure 9).

Variation by age and sex

In 2021–22, osteoporosis hospitalisations rates:

  • increased steeply with age (10 per 100,000 population aged 45–49, compared with 480 per 100,000 population aged 85 and over) 
  • were 2.8 times more common among females compared with males (130 and 46 per 100,000 population aged 45 and over, respectively) (Figure 9).

Figure 9: Age distribution for osteoporosis hospitalisations, by sex, 2021–22

This figure shows there were 2,600 hospitalisations with a principal diagnosis of osteoporosis for people aged 85 or over in 2021-22.

Trends over time

From 2011–12 to 2021–22, for osteoporosis hospitalisations among people aged 45 and over:

  • the rate fluctuated, between a low of 65 per 100,000 population in 2014–15 and a high of 89 per 100,000 population in 2021–22 
  • the proportion of overnight stays increased from 50% to 65%
  • the average length of overnight stays remained relatively stable, ranging between 10.3 and 11.6 days (Figure 10).

Figure 10: Trends over time for osteoporosis hospitalisations, 2011–12 to 2021–22

This figure shows that between 2011–12 to 2021–22, the number of hospitalisations with a principal diagnosis of osteoporosis increased from 6,400 to 10,100.

Hospitalisations for minimal trauma fractures

People with osteoporosis can be hospitalised for a range of reasons, including minimal trauma fractures. Other factors such as high bone turnover, low body weight and a tendency to fall, also increase minimal trauma fracture risk. These fractures can occur from a minor bump, fall from a standing height or an event that would not normally result in a fracture if the bone was healthy. Minimal trauma fractures generate substantial costs to the community, including with direct costs in terms of hospital treatment.

Osteoporosis is not common before the age of 45, therefore results below show minimal trauma fractures occurring in people over this age. The results below also exclude hospitalisations where the patient was transferred from another hospital, to more accurately represent the number of these injuries that resulted in hospital admission. For people aged 45 and over, in 2021–22:

  • there were 105,000 minimal trauma fracture events resulting in hospitalisation with fracture as the principal diagnosis, representing 980 hospitalisations per 100,000 population
  • hip was the most common fracture site, accounting for 28% of minimal trauma fracture hospitalisations (see minimal trauma hip fracture section for more detail)  

Variation by age and sex

In 2021–22, for people aged 45 and over, minimal trauma fracture hospitalisations:

  • increased steeply with age (165 per 100,000 population aged 45–49 compared with 6,000 per 100,000 population for people aged 85 and over)
  • were 2.1 times more common among females compared with males (1,300 and 620 per 100,000 population, respectively).

Figure 11: Trends over time for minimal trauma fracture hospitalisations, by fracture site and sex, 2015–16 to 2021–22

This figure shows minimal trauma fracture hospitalisations for persons aged 45 and over are higher for females for all fracture sites compared with males.

Hospitalisations for minimal trauma hip fractures

Minimal trauma hip fracture is one of the most serious and debilitating outcomes of osteoporosis (Ip et al. 2010).

Hip fractures are serious medical emergencies that require time-critical care, and often require hospitalisation and surgery, and may be a source of ongoing pain and disability. These fractures have a considerable impact on individuals, the community and the Australian health system (Watts et al. 2013).

Note that the results below exclude hospitalisations where the patient was transferred from another hospital, to more accurately represent the number of these injuries that resulted in hospital admission.

For people aged 45 and over, in 2021–22:

  • there were 29,000 minimal trauma hip fracture events resulting in hospitalisation with hip fracture as the principal diagnosis, representing 270 hospitalisations per 100,000 population

Variation by age and sex

In 2021–22, for people aged 45 and over, minimal trauma hip fracture hospitalisations:

  • increased steeply with age (10 per 100,000 population aged 45–49, compared with 2,200 per 100,000 population aged 85 and over)
  • were 1.8 times more common among females compared with males (350 and 190 per 100,000 population aged 45 and over, respectively) (Figure 12).

Trends over time

For minimal trauma hip fracture hospitalisations of people aged 45 and over, from 2015–16 to 2021–22:

  • the rate peaked in 2017–18 at 300 hospitalisations per 100,000 population and decreased consistently thereafter, which may reflect measures to reduce risk factors and prevent falls among the at-risk population (RACGP 2018)

Figure 12: Age distribution for minimal trauma fracture hospitalisations, by sex, 2015–16 to 2021–22

This figure shows minimal trauma fracture hospitalisations for people aged 85 and over are higher for hip fractures compared with other fracture sites.

Using linked data to monitor hip fracture care pathways

Linked data can provide a more complete picture of patient outcomes following a hip fracture and allows for the count of people rather than separations. This avoids double counting due to hospital transfers or changes in care type. Analysis of linked hospitals, death and residential aged care data found that among people aged 45 and over:

  • there were around 16,300 to 17,100 first hip fracture patients each year, with a total of 67,200 first hip fracture patients between July 2013 and June 2017. While the number of hip fractures increased in each year of the reference period, the rate of first hip fractures declined slightly
  • less than half of first hip fracture patients (43%) who were alive one year after their hip fracture had at least one prescription dispensed for an osteoporosis-related medication in the year after their hip fracture
  • the median length of stay in the acute phase of care continuous from the time of hip fracture was 8 days, compared with 20 days when all care following the hip fracture was included (including acute, rehabilitation and any other care in the same hospital stay)
  • over the year following first hip fracture, 3.0% of surgical patients were hospitalised with a second hip fracture
  • 26% of first hip fracture patients died within 1 year of admission to hospital (AIHW 2023). 

See Hip fracture care pathways in Australia for more information.