Health – status and functioning
As the number of older people in Australia continues to grow, supporting their health and wellbeing is becoming even more important. While understanding health conditions is one way to measure how older people are faring, so too is understanding their overall health status, functioning, life expectancy and death. The burden of disease on the lives of older people is also important.
Throughout this page, ‘older people’ refers to people aged 65 and over. Where this definition does not apply, the age group in focus is specified. The ‘Older Aboriginal and Torres Strait Islander people’ feature article defines older people as aged 50 and over. This definition does not apply to this page, with Indigenous Australians aged 50–64 not included in the information presented.
Self-assessed health
According to the 2017–18 Australian Bureau of Statistics (ABS) National Health Survey (NHS), an estimated 3 in 4 (74%) older Australians (aged 65 and over) reported their health as good, very good or excellent including:
- 42% who reported their health as being very good or excellent
- 32% who reported their health as being good (ABS 2018).
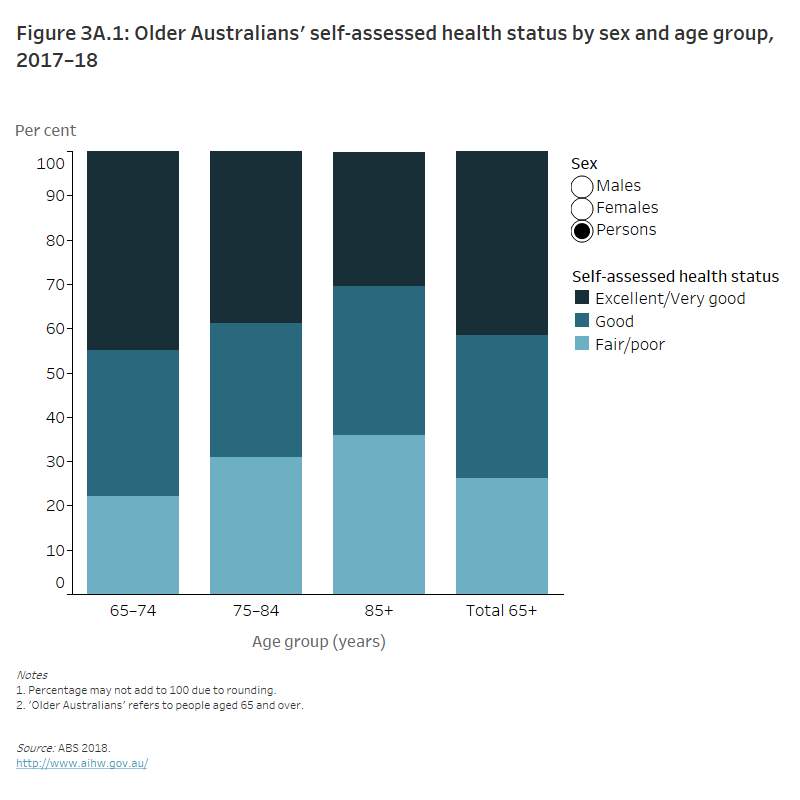
Older men and women self-assessed their health similarly. Around 2 in 5 older men (41%) and older women (43%) reported their health as very good or excellent, and 1 in 4 older men (27%) and women (26%) reported their health as being fair or poor (ABS 2018). Older people aged 65–74 were more likely to report their health as very good or excellent than older people aged 75 and over, and less likely to report their health as fair or poor (ABS 2018) (Figure 3A.1).
Figure 3A.1: Older Australians’ self-assessed health status by sex and age group, 2017–18
The stacked column graph shows the percentage of people with a self-assessed health status as fair or poor increased with age. 22% of people aged 65–74 assessed their health status as fair or poor compared with 36% of people aged 85 and over in 2017–18. However, on average people aged 65 and over were more likely to have an excellent or very good self-assessed health status (42%).
Disability
According to the 2018 ABS Survey of Disability, Ageing and Carers (SDAC), half (50%) of older Australians (aged 65 and over) had disability. In the SDAC, a person is considered to have disability if they have at least one of a list of limitations, restrictions or impairments, which has lasted, or is likely to last, for at least six months. The prevalence of disability among older Australians has remained relatively stable in recent years, at 51% in 2015 (ABS 2019).
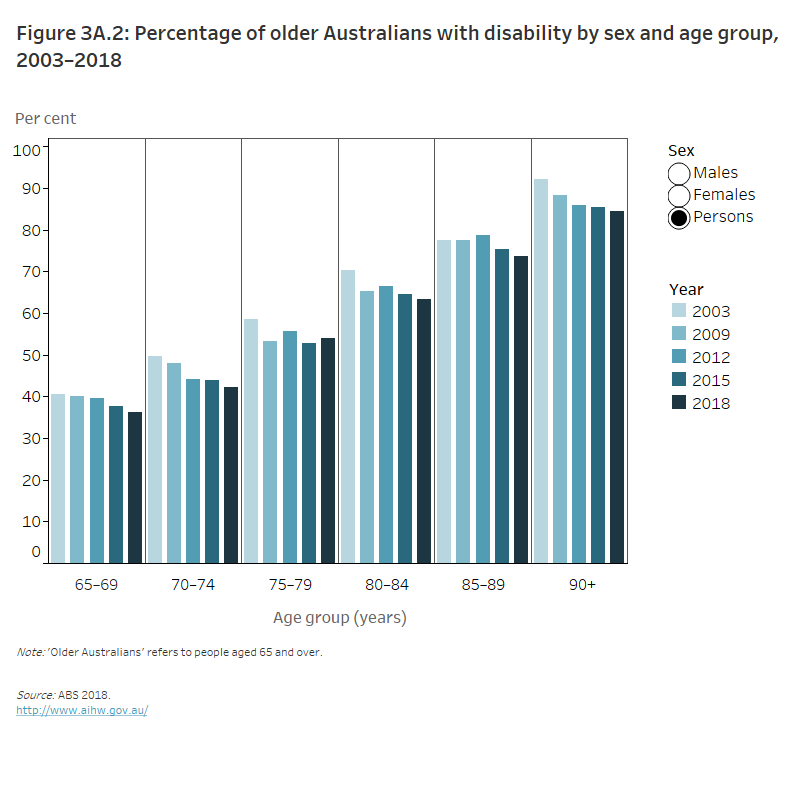
The rate of disability increased with age in 2018, rising from 36% of people aged 65–69 to 85% of those 90 and over (Figure 3A.2). The need for assistance at older ages is likely a trigger for needing formal support services such as aged care. See Aged care for more information.
Figure 3A.2: Percentage of older Australians with disability by sex and age group, 2003–2018
The column graph shows the percentage of people with disability increased with age across all of the years. However, these percentages decreased in each of the age groups across the years and amongst men and women. The percentage of people aged 90 and over who had a disability decreased from 92% in 2003 to 85% in 2018, these percentages being similar amongst both men and women.
Older people experience different levels of disability. The severity of disability is defined by whether a person needs help, has difficulty, or uses aids or equipment with 3 core activities of communication, mobility or self-care, and is grouped for mild, moderate, severe and profound limitation. In 2018, nearly 1 in 5 (18%) older Australians (aged 65 and over) had severe or profound disability (that is, they sometimes or always needed help with self-care, mobility or communication) (AIHW 2020).
In 2018, 49% of older men and 50% of older women had disability, and 15% of older men and 20% of older women had severe or profound disability (ABS 2019; AIHW 2020).
Life expectancy
Life expectancy is one way to understand how long, on average, people can be expected to live based on current mortality rates. The measure is not a prediction, rather it is useful for comparisons between population groups and for considering changes over time. It is a common way to assess a population’s overall health.
Life expectancy in Australia has improved dramatically for both sexes in the last century. This is particularly the case for life expectancy at birth. Compared with children born in 1881–1890, both boys and girls born in 2018–2020 can expect to live around 34 years longer.
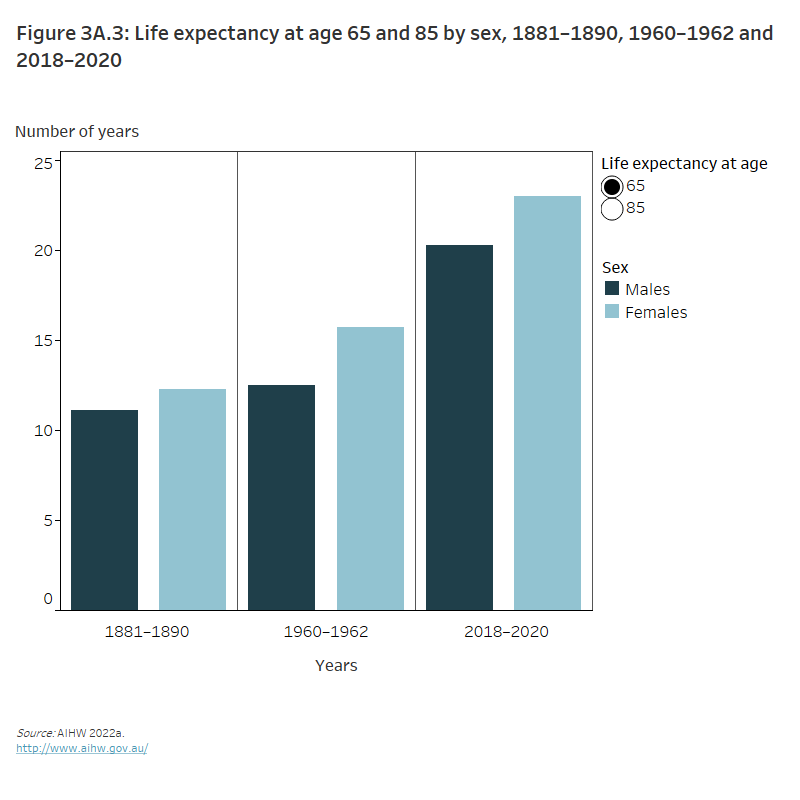
Another way to measure life expectancy is through the remaining life expectancy at a given age. Men aged 65 in 2018–20 could expect to live another 20.3 years (an expected age at death of 85.3 years), and women aged 65 in 2018–20 could expect to live another 23.0 years (an expected age at death of 88.0 years) (Figure 3A.3).
Figure 3A.3: Life expectancy at age 65 and 85 by sex, 1881–1890, 1960–1962 and 2018–2020
The column graph shows the number of years’ men and women were expected to live for when they are aged 65 and 85 in 1881–1890 1960–1962 and 2018–2020. From 1881 the life expectancy of both men and women increased, however women had the greatest life expectancy across all the years. In 2018-2020 men who were aged 65 were expected to live for another 20 years compared with women aged 65 who were expected to live for another 23 years.
Health-adjusted life expectancy
Health-adjusted life expectancy extends the concept of life expectancy by considering the time spent living with ill health due to disease and injury. It reflects the length of time an individual at a specific age could, on average, expect to live in full health. It is most meaningful when compared with life expectancy.
Health-adjusted life expectancy for males and females born in 2018 was 71.5 and 74.1 years, respectively. Between 2003 and 2018, increases in health-adjusted life expectancy for people aged 65 were slightly smaller than those seen for life expectancy alone: health-adjusted life expectancy increased by 1.7 years for men aged 65 (as life expectancy increased by 2.1) and by 0.9 years for women (as life expectancy increased by 1.4 years). There was a small decrease in the proportion of life expectancy as healthy years over time for women (from 75% in 2003 to 74% in 2018), whereas for men there was a small increase (from 75% in 2003 to 76% in 2018) (AIHW 2021a).
Disability-free life expectancy
Increases in life expectancy hopefully accompany an increase in the number of healthy years people live. Disability-free life expectancy is a measure that provides the estimated number of years people can expect to live without disability.
It is important to note that disability does not necessarily equate to poor health or illness. Expected years living with disability should not be considered as being of less value than years without disability (AIHW 2020).
In Australia, the overall disability-free life expectancy has increased in recent years.
Men aged 65 in 2018 can expect to live, on average, another:
- 9 years without disability
- 11 years with some level of disability, including around 3.5 years with severe or profound disability.
Women aged 65 in 2018 can expect to live, on average, another:
- 10 years without disability
- 12 years with some level of disability, including around 5.5 years with severe or profound disability.
For people aged 65 in 2018, this equates to living just over half of their remaining lives with some level of disability (53% for men and 54% for women).
Over time, the number of estimated years living without disability at any age has increased for both men and women. Between 2003 and 2018, the gender gap in the expected years living without disability narrowed in most age groups. The gap for years living without severe or profound disability remained stable for most age groups. In the older age groups, however, the gap for years living without disability and living without severe or profound disability remained relatively stable, changing by no more than 0.2 years across the 65–69, 70–74, 75–79, 80–84 and 85 and over age groups (AIHW 2020).
For more information, see People with disability in Australia 2020.
Causes of death
In Australia in 2020, there were around 132,500 deaths of people aged 65 and over (82% of all deaths) (Table 3A.1). The median age at death was 79 for males and 85 for females (AIHW 2022a).
|
Age group (years) |
Men |
Women |
People |
% of total |
|---|---|---|---|---|
|
65–69 |
6,518 |
4,084 |
10,602 |
8.0 |
|
70–74 |
9,424 |
6,099 |
15,523 |
11.7 |
|
75–79 |
10,870 |
7,618 |
18,488 |
14.0 |
|
80–84 |
12,692 |
10,721 |
23,413 |
17.7 |
|
85–89 |
13,063 |
13,777 |
26,840 |
20.3 |
|
90–94 |
10,065 |
14,556 |
24,621 |
18.6 |
|
95–99 |
3,446 |
7,608 |
11,054 |
8.3 |
|
100+ |
420 |
1,530 |
1,950 |
1.5 |
|
Total 65+ |
66,498 |
65,993 |
132,491 |
100.0 |
Notes
- Year refers to year of registration of death. Deaths registered in 2020 are based on preliminary data and are subject to further revision by the Australian Bureau of Statistics (ABS).
- 'Older Australians' refers to people aged 65 and over.
Source: AIHW 2022a.
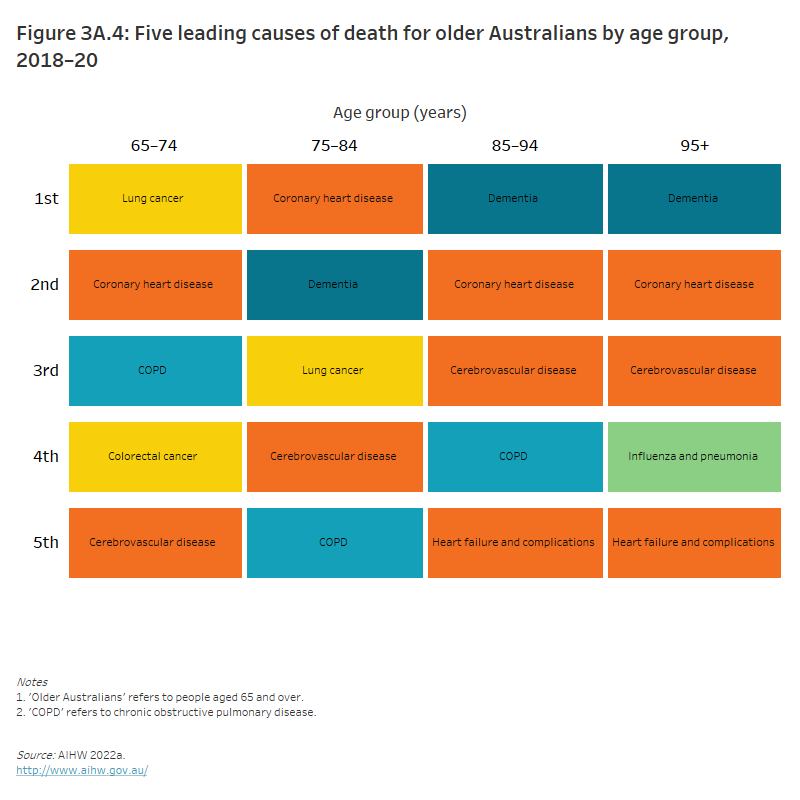
Coronary heart disease is the overall leading cause of death among older Australians. However, there were differences in the leading cause of death across the older age groups (Figure 3A.4). During 2018–20, the leading cause of death for people aged 65–74 was lung cancer (8,000), followed by coronary heart disease (7,500). Coronary heart disease was the leading cause of death for people aged 75–84 (12,600). For people aged 85 and over, dementia including Alzheimer's disease was the leading cause of death (30,700), followed by coronary heart disease (25,000) (AIHW 2022a).
Men and women also had different leading causes of death. For men, coronary heart disease was the leading cause across all older age groups. For women aged 65–74, the leading cause was lung cancer and for all other older age groups, it was dementia including Alzheimer’s disease (AIHW 2022a).
Figure 3A.4: Five leading causes of death for older Australians by age group, 2016–18
The ranked box chart shows the five leading causes of death for older Australians by age groups in 2016–2018. The top three leading causes of death moved from chronic obstructive pulmonary disease, coronary heart disease and lung cancer in those aged 65–74 to cerebrovascular disease, coronary heart disease and dementia in all age groups 75 and over.
COVID-19 deaths
Australia’s older population has been disproportionately impacted by the spread of the COVID-19 virus throughout the country. The risk of serious illness as a result of contracting COVID-19, resulting in hospitalisation, intensive care admission, or death, is much higher in older people in general, and particularly in those with underlying health conditions. This has had devastating consequences in residential aged care settings, as the close proximity between residents increased the risk of virus transmission among people who were already in poorer health than the general population. Although vaccination rollout and improved infection prevention and control methods have reduced the impact of COVID-19 in residential aged care over time, approximately one-third of COVID-19-related deaths in Australia to date have occurred in people living in residential aged care facilities.
For further information related to older Australians and COVID-19, including access to advice and support resources, see the Australian Government’s My Aged Care website. For more information regarding COVID-19 outbreaks in Australian residential aged care facilities, see the latest weekly report.
Suicide
Suicide can affect anyone, regardless of age, personal characteristics or family background. Although it is a relatively rare cause of death, it can have devastating and long-lasting effects on those left behind. The numbers and rates of deaths by suicide change over time as social, economic and environmental factors influence suicide risk.
The AIHW recognises that each of the numbers reported here represents an individual.
In 2020, there were 516 deaths from intentional self-harm for people aged 65 and over. Three in 4 of these deaths were among older men (76%, 392 deaths), and 1 in 4 (24%, 124 deaths) were among older females (ABS 2021). The deaths among older people represented 16% of total deaths from intentional self-harm (across all ages) (Table 3A.2).
|
Age group (years) |
Men |
Women |
Total |
|---|---|---|---|
|
65–69 |
106 |
30 |
136 |
|
70–74 |
89 |
31 |
120 |
|
75–79 |
71 |
24 |
95 |
|
80–84 |
52 |
19 |
71 |
|
85+ |
74 |
20 |
94 |
|
Total (all age groups) |
2,384 |
755 |
3,139 |
Source: ABS 2021.
The proportion of deaths by suicide is highest among people of young or middle age, and decreases progressively in older age groups. While the counts are lower in older age groups, deaths by suicide have a significant impact on older age groups. Taking into account the underlying population structure, the highest rates of deaths by suicide were among men aged 85 and over (36.2 deaths per 100,000 population) (ABS 2021).
For more information, see Suicide & self-harm monitoring.
Burden of disease
Burden of disease combines the years of healthy life lost due to living with ill health (YLD or non-fatal burden) with the years of life lost due to dying prematurely (YLL or fatal burden). Total burden is reported using disability-adjusted life years (DALY).
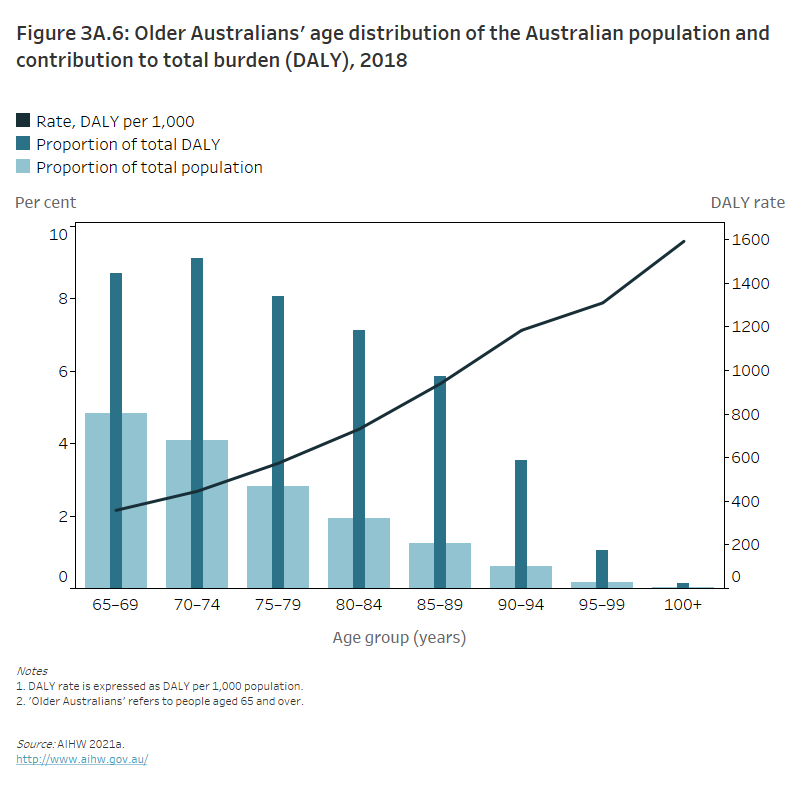
In 2018, older people (aged 65 and over) lost more than 2.1 million years of healthy life (DALY) due to illness or premature death. This has increased since 2003, from 1.7 million DALY. However, in 2018, the Australian population had a higher proportion of older people (16%) than in 2003 (13%). Age-standardised rates of DALY for older people have gone down from 84.3 per 1,000 in 2003, to 69.1 per 1,000 in 2018. In 2018, the years of healthy life lost for older people represented 44% of total DALY in Australia. The YLL accounted for 58% of DALY (1.3 million YLL), with YLD contributing 42% (904,000 YLD) (AIHW 2021a). To learn more about the methodology applied in burden of disease analysis, please refer to Australian Burden of Disease Study 2018: methods and supplementary material (AIHW 2021b).
Older Australians contribute to a large share of the total burden of disease and this increases with age (Figure 3A.6). For example, people aged 65–69 made up 5% of the population, but contributed to 9% of the total burden, while people aged 70 and over made up 11% of the population, but contributed to 35% of the total burden.
Figure 3A.6: Older Australians’ age distribution of the Australian population and contribution to total burden (DALY), 2018
The column and line graph shows the proportion of the total population of people aged 65 and over decreases as people get older, similar to the proportion of total burden (DALY), however this peaked in those aged 70–74 where the proportion of total DALY was 9.1%. In 2018 the DALY rate per 1,000 increased with age with people aged 100 and over having a DALY rate of 1,592 per 1,000.
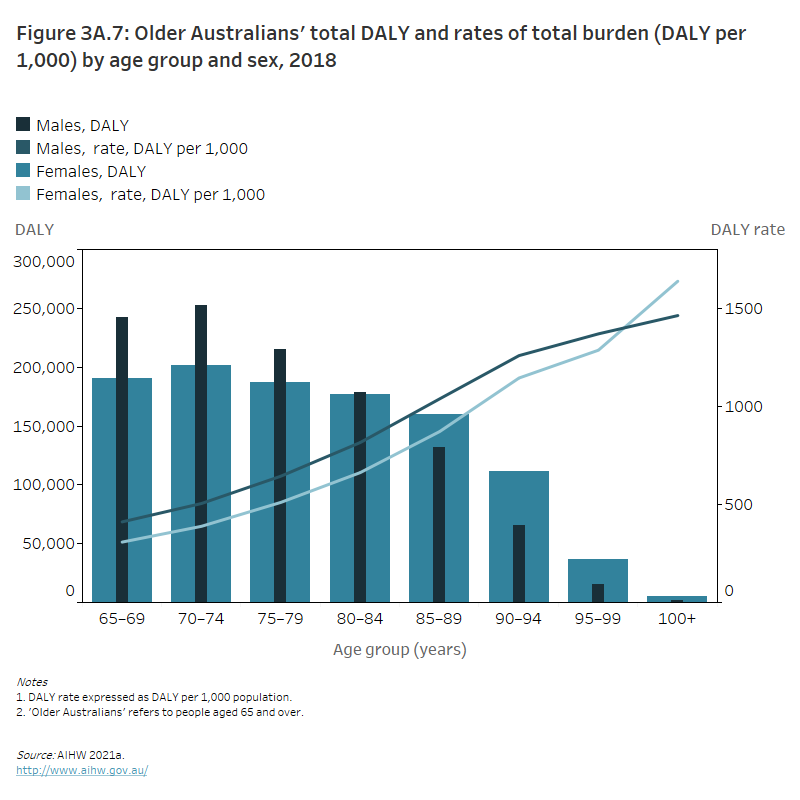
In 2018, the burden was spread relatively evenly between the sexes. Older men (aged 65 and over) accounted for just over half (51%) of the burden, while older women accounted for 49%. Men contributed to more burden than women between the ages of 65 and 84 (around 888,000 DALY compared with 755,000 DALY, respectively), whereas women contributed to more burden than men from the age of 85 (313,000 DALY compared with 214,000 DALY, respectively) (AIHW 2021a) (Figure 3A.7).
Figure 3A.7: Older Australians' total DALY and rates of total burden (DALY per 1,000) by age group and sex, 2018
The column and line graph shows that men aged 65–84 had a higher DALY compared with women in these age groups, however in the 85 and over age groups women had a higher DALY compared with men. DALY decreased as ages increased in both men and women, however the DALY rate increased with age for both men and women.
Leading causes of burden of disease (groups)
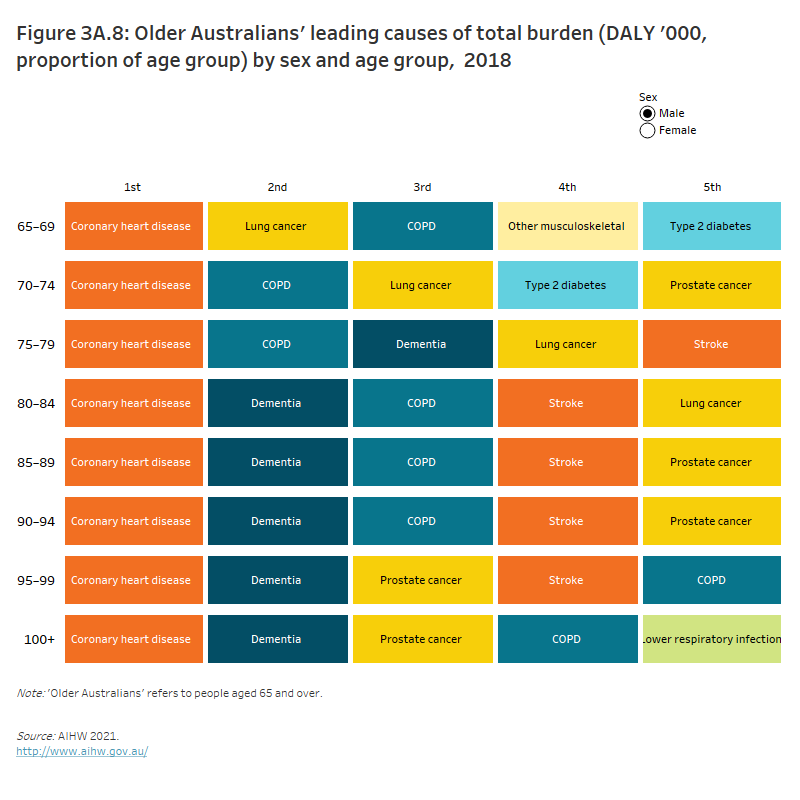
In 2018, cancer and other neoplasms, cardiovascular diseases, and neurological conditions were the leading disease groups causing total burden (fatal and non-fatal combined) for older Australians, followed by musculoskeletal conditions, and respiratory diseases (Figure 3A.8). Among these top disease groups, the rate of burden per 1,000 people increased with age – except for cancer and other neoplasms where the rate was highest for 80–84 year olds and musculoskeletal conditions where the rate was highest for 75-79 year olds (AIHW 2021a).
Figure 3A.8: Older Australians’ leading causes of total burden (DALY ‘000, proportion of age group) by sex and age group, 2018
The ranked box chart shows the top five leading causes of total burden for men and women. The leading cause of total burden amongst men across all age groups was coronary heart disease. However, the leading cause of total burden in women changed from other musculoskeletal and chronic obstructive pulmonary disease amongst those aged 65–79 to dementia amongst women aged 80 and over.
Injuries
Most injuries, whether unintentional or intentional, are preventable (WHO 2014). Injuries can be minor with full recovery, or more serious and causing lasting health problems. While some more serious injuries lead to hospital admittance or emergency department visits, others lead to death.
Injuries can happen to anyone, but older people are at particularly high risk of hospitalisation and death for certain injuries. As a result, overall injury hospitalisation and death rates are higher for older people than younger people. In 2019–20, 1 in 3 (33%) hospitalised injury cases involved older Australians (aged 65 and over). There were 173,000 cases of hospitalised injury for older people. This included 103,300 cases of hospitalised injury for women and 69,700 for men, noting that sex is not reported in the remainder of cases. From about the age of 65, injury hospitalisation rates rise considerably from 2,027 per 100,000 for the 65–69 age group to 16,280 per 100,000 for the 95-and-over age group (AIHW 2022b).
For both males and females, rates of hospitalised injury were highest in older people (aged 65 and over), compared with other life-stage age groups. Males had higher rates of hospitalised injury than females in all age groups from 0–64, and were similar for those aged 65–69 (2,037 and 2,017 per 100,000 population, respectively). From ages 70–74 and over, women had higher rates (AIHW 2022b).
In 2019–20, injury death rates were highest for older Australians (aged 65 and over), compared with other life-stage age groups. In 2019–20, there were 7,122 injury deaths among older Australians, 71% of which were due to falls. Almost all (97%) female deaths due to falls involved those aged 65 and over (AIHW 2022b).
Where do I go for more information?
For more information on health status and functioning, see:
Elsewhere in this report, information about older people’s health is available on health risk factors, health service use and selected health conditions.
ABS (Australian Bureau of Statistics) 2018. National Health Survey: first results, 2017–18. ABS cat. no. 4364.0. Canberra: ABS. Viewed 2021.
ABS 2019. Survey of Disability, Ageing and Carers: Summary of Findings, 2018. ABS cat. no. 4430.0. Canberra: ABS. Viewed 2021.
ABS 2021. Causes of death, Australia, 2020. ABS cat. no. 3303.0. Canberra: ABS. Viewed 2022.
AIHW 2020. People with disability in Australia. Cat. no. DIS 72. Canberra: AIHW. Viewed 2021.
AIHW 2021a. Australian Burden of Disease Study 2018: impact and causes of illness and death in Australia. Canberra: AIHW. Viewed 2021.
AIHW 2021b. Australian Burden of Disease Study 2018: methods and supplementary material. Canberra: AIHW. Viewed 2021.
AIHW 2022a. Deaths in Australia. Cat. no. PHE 229. Canberra: AIHW. Viewed 2022.
AIHW 2022b. Injury in Australia. Cat. no. INJCAT 213. Canberra: AIHW. Viewed 2022.
WHO (World Health Organization) 2014. Injuries and violence: the facts, 2014. Geneva: WHO. Viewed 2021.


