Summary
On this page:
- How common is overweight and obesity?
- How does overweight and obesity vary by population groups?
- How does overweight and obesity change over time?
- How does Australia compare internationally?
- What are the health impacts of overweight and obesity?
- Impacts of COVID-19 on overweight and obesity
- Where do I go for more information?
How common is overweight and obesity?
Overweight and obesity refers to excess body weight. It is a risk factor for many chronic conditions and is associated with higher rates of death (AIHW 2019).
The interactive graphs in the following sections allow you to explore the prevalence of overweight and obesity in Australian children and adults, and the variations by population groups, and across remoteness and socioeconomic areas.
For more information on how to measure overweight and obesity, please see Measuring overweight and obesity and Causes of overweight and obesity.
Why is the most recent data from 2017–18?
Estimates of Body Mass Index (BMI) are based on nationally representative measured height and weight data from the Australian Bureau of Statistics (ABS) 2017–18 National Health Survey (NHS).
Due to the COVID-19 pandemic, physical measurements (including height, weight and waist circumference) were not taken at the time of the most recent NHS 2020–21. While self-reported height and weight were collected as part of the survey, self-reported data underestimates actual levels of overweight or obesity based on objective measurements (ABS 2018f).
As self-reported and measured rates of overweight and obesity should not be directly compared, the figures presented on this page reflect the latest nationally representative data based on measured height, weight and waist circumference.
For more information, please see Technical notes.
Children and adolescents
Based on the latest available data, of children and adolescents aged 2–17 (ABS 2018c):
- One in 4 (25%) are living with overweight or obesity. This is approximately 1.2 million children and adolescents.
- 17% are living with overweight but not obesity.
- 8.2% are living with obesity.
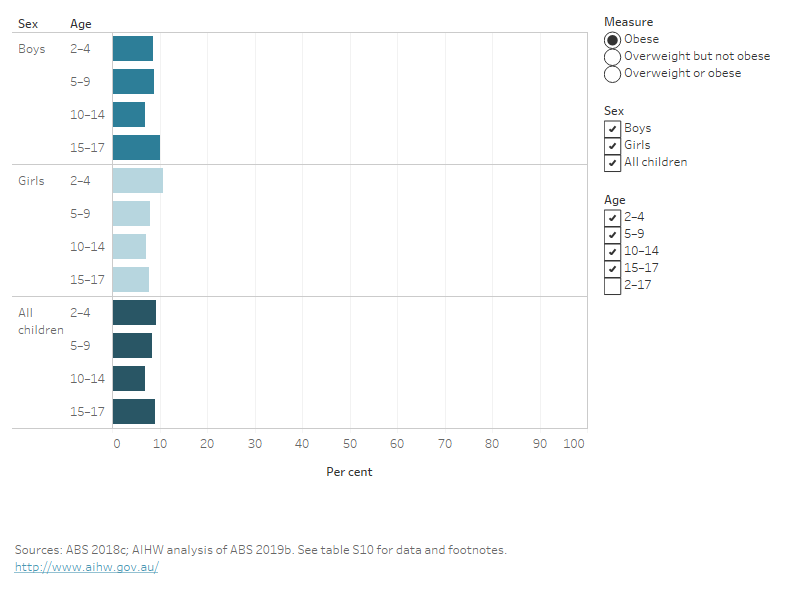
The rates of overweight and obesity are similar for boys and girls across age groups (Figure 1).
See Overweight and obesity among Australian children and adolescents for more information on this age group.
Figure 1: Proportion of children and adolescents aged 2–17 living with overweight and obesity, by age group and sex, 2017–18
This bar chart shows the prevalence of 3 measures of overweight and obesity for children and adolescents in 2017–18: overweight and obesity combined, obesity alone, and overweight but not obese. Data are shown for boys, girls and all children in the following age groups: 2–4, 5–9, 10–14 and 15–17. The chart shows similar rates of overweight and obesity across age groups for boys and girls.
Adults
Based on the latest available data, of adults aged 18 and over (ABS 2018e):
- Two in 3 (67%) are living with overweight or obesity. This is approximately 12.5 million adults.
- 36% are living with overweight but not obesity.
- 31% are living with obesity.
- 12% are living with severe obesity, which is defined in this report as having a BMI of 35 or more.
For all measures of overweight and obesity, men had higher rates than women did:
- 75% of men and 60% of women are living with overweight or obesity.
- 42% of men and 30% of women are living with overweight but not obesity.
- 33% of men and 30% of women are living with obesity.
Overweight and obesity is distributed differently among men and women, as shown in the BMI calculator.
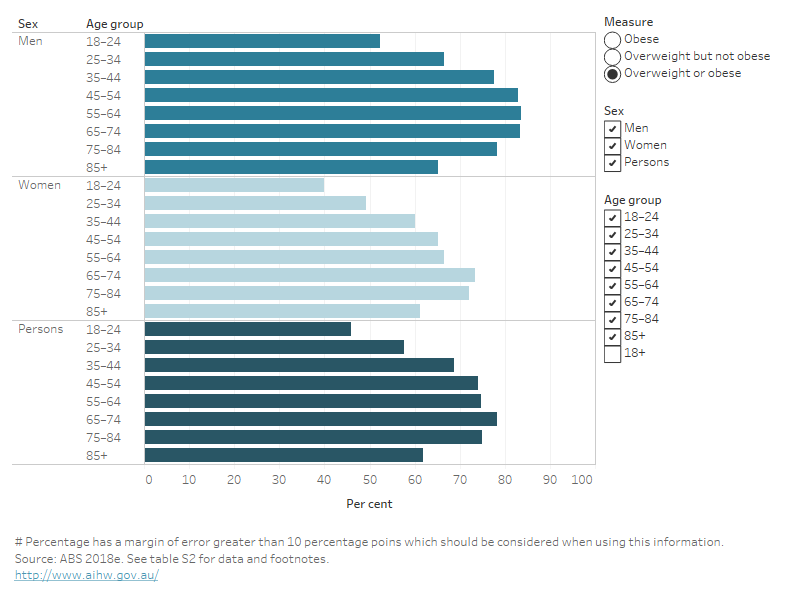
The proportion of adults living with overweight or obesity generally increases with age. This is seen in both men and women (Figure 2):
- For men, the proportion increases from 52% at 18–24 to 83% at 45–54. It then plateaus until 65–74, and then decreases to 65% at age 85 years and over.
- For women, the proportion increases from 40% at 18–24 to 73% at 65–74. It then decreases to 61% at age 85 years and over.
Obesity is also more common in older age groups – 18% of men and 14% of women aged 18–24 year are living with obesity, compared with 42% of men and 39% of women aged 65–74 (Figure 2).
Figure 2: Proportion of adults living with overweight and obesity, by age group and sex, 2017–18
This bar chart shows the prevalence of 3 measures of overweight and obesity for adults aged 18 and over in 2017–18: overweight and obesity combined, obesity alone, and overweight but not obese. Data are shown for men and women in 8 age groups, from 18 to 85 and over. Across age groups for men, overweight and obesity increased with age from 52% at 18–24 to 83% at 45–54, plateaued until 65–74, and then decreased to 65% at age 85 years and over. Across age groups for women, the proportion who were overweight or obese increased with age from 40% at 18–24 to 73% at 65–74, and decreased to 61% at age 85 years and over.
Waist circumference
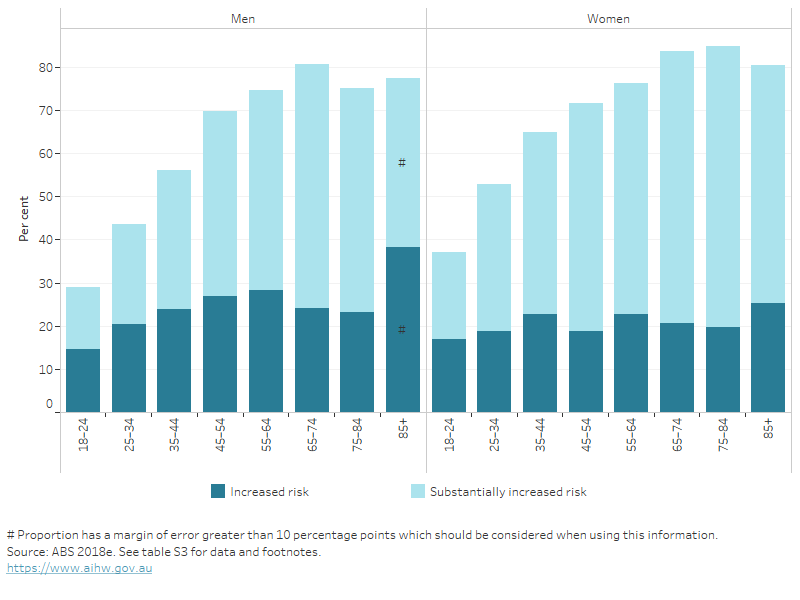
Based on the latest available data, 60% of men and 66% of women aged 18 and over have a waist circumference that indicated an increased or substantially increased risk of metabolic complications. The proportion of adults with a waist circumference that indicate a substantially increased risk of metabolic complications tends to increase with age, up until about age 65–74 for men and 75–84 for women (Figure 3).
Figure 3: Proportion of adults with a waist circumference indicating increased risk of metabolic complications, by age group and sex, 2017–18
This stacked bar chart shows the proportion of men and women who had a waist circumference indicating an increased or a substantially increased risk of metabolic complication, in 8 age groups, from 18 to 85 and over. It shows that the proportion of persons with a substantially increased risk tend to increase with age, up until about age 65–74 for men and 75–84 for women.
Aboriginal and Torres Strait Islander Australians
Among Aboriginal and Torres Strait Islander children and adolescents aged 2–17, 38% are living with overweight or obesity, according to the latest data from the 2018–19 ABS National Aboriginal and Torres Strait Islander Health Survey. This is an increase from the 31% estimated from the previous Australian Aboriginal and Torres Strait Islander Health Survey in 2012–13 (ABS 2015a, ABS 2019c). It is also higher than the 24% of non-Indigenous children and adolescents estimated from the National Health Survey in 2017–18 (ABS 2019b).
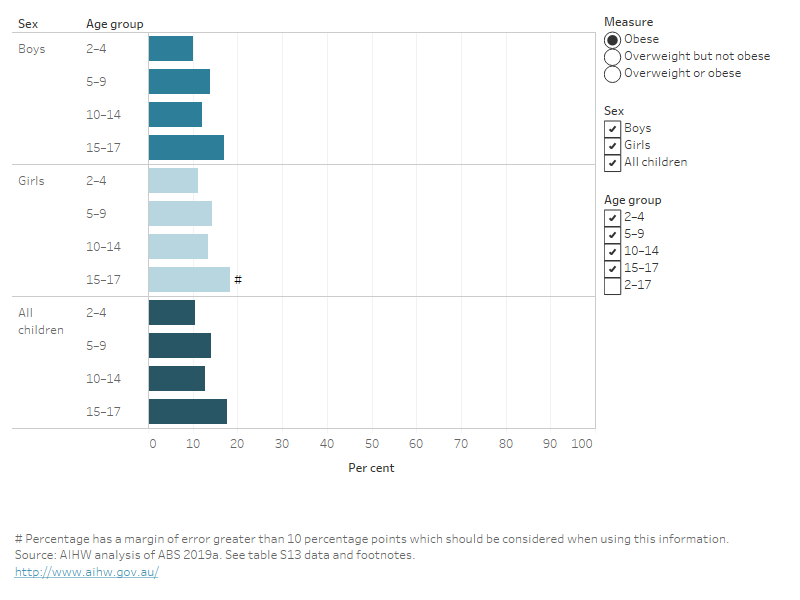
The proportion of Indigenous boys living with overweight or obesity increases with age from 21% of those aged 2–4 years to 33% of those aged 5–9 and 45% of those aged 10–14. For girls, there are no significant differences in the proportion living with overweight or obesity across age groups (ABS 2019a) (Figure 4).
See Overweight and obesity among Australian children and adolescents for more information.
Figure 4: Proportion of Indigenous children and adolescents aged 2–17 living with overweight and obesity, by age group and sex, 2018–19
This bar chart shows the prevalence of 3 measures of overweight and obesity for Indigenous children and adolescents in 2018–19: overweight and obesity combined, obesity alone, and overweight but not obese. Data are shown for boys, girls and all children in the following age groups: 2–4, 5–9, 10–14 and 15–17. The chart shows more variation across age groups for boys than for girls, with overweight and obesity increasing from 21% at age 2–4, to 45% at age 10–14 for boys, and ranging between 37% and 42% for girls.
Based on the latest available data, of Indigenous Australians aged 18 and over:
- 74% are living with overweight or obesity, increasing from 69% in 2012–13.
- 45% are living with obesity, increasing from 40% in 2012–13 (ABS 2014a, ABS 2019c).
After adjusting for differences in the age structure of Indigenous and non-Indigenous populations, Indigenous adults are 1.2 times as likely to be living with overweight or obesity as non-Indigenous adults (77% compared with 66%), and 1.5 times as likely to be living with obesity (47% compared with 31%) (ABS 2019c).
When comparing between Indigenous men and women, there are no statistically significant differences between the proportion living with overweight or obesity, and the proportion living with overweight alone. However, slightly more Indigenous women are living with obesity (48%) than Indigenous men (43%) (ABS 2019c).
The proportion of overweight or obesity generally increases with age. This was seen in both Indigenous men and women (ABS 2019c) (Figure 5):
- For Indigenous men, the proportion increases from 56% at 18–24 to 72% at 25–34 and 81% at 35–44. It peaks at 84% at 55 years and over.
- For Indigenous women, the proportion increases from 60% at 18–24 to 73% at 25–34. It peaks at 83% at 45–54.
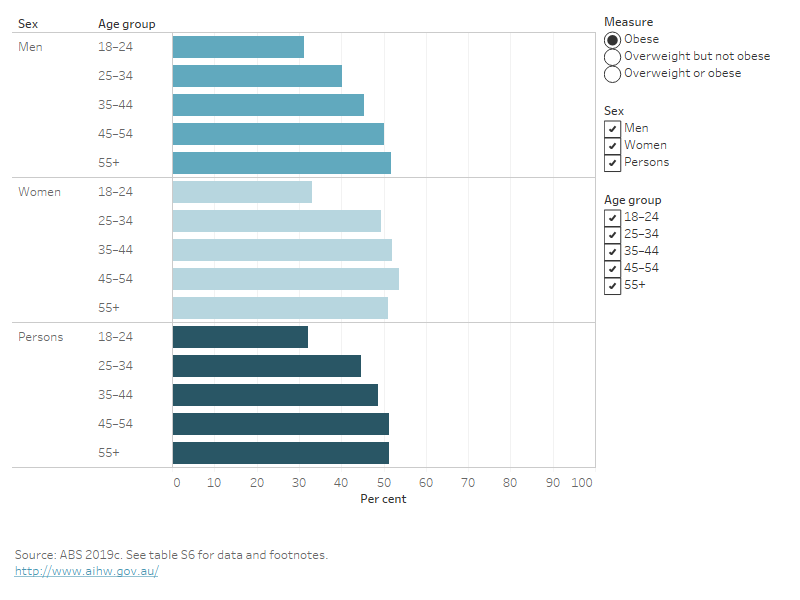
For obesity alone, the proportion also increases with age. The proportion of Indigenous adults aged 18–24 living with obesity is 32% compared with the 51% of Indigenous adults aged 45 and over (Figure 5) (ABS 2019c).
Figure 5: Proportion of Indigenous adults living with overweight and obesity, by age group and sex, 2018–19
This bar chart shows the prevalence of 3 measures of overweight and obesity for Indigenous adults aged 18 and over in 2018–19: overweight and obesity combined, obesity alone, and overweight but not obese. Data are shown for men and women in 5 age groups, from 18 to 55 and over. For both men and women, the prevalence of overweight and obesity was lower for younger Indigenous adults aged 18–24 (59% overall) compared with those aged 55 and over (82% overall).
How does overweight and obesity vary by population groups?
An important factor associated with poorer health outcomes, including higher rates of overweight and obesity is the area in which an individual lives, such as remoteness area and the relative socioeconomic advantage and disadvantage of the area (AIHW 2018a).
Remoteness areas
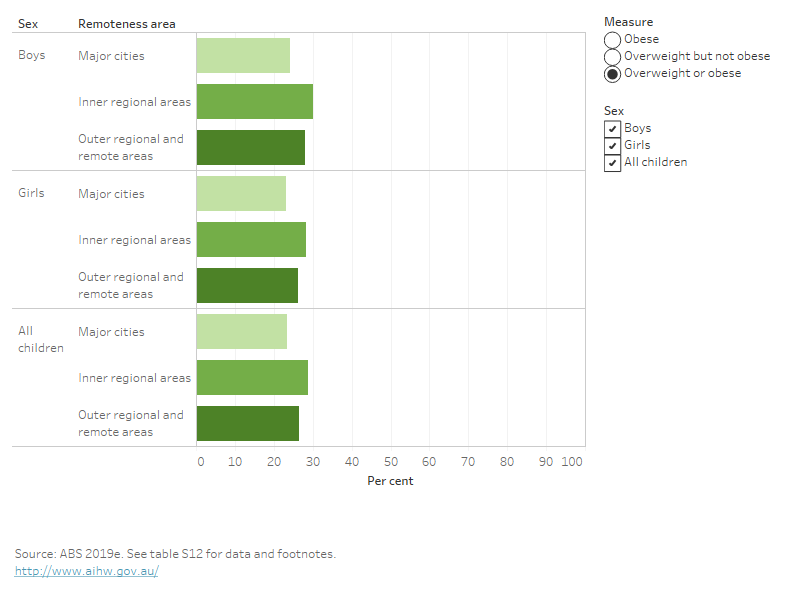
Based on the latest available data, a higher proportion of Australian children and adolescents aged 2–17 in Inner regional areas is living with overweight or obesity compared with those in Major cities (29% and 24%, respectively) (Figure 6). For children and adolescents in Outer regional and remote areas, the proportion is 27%. This pattern is similar for boys and girls (ABS 2019e).
Figure 6: Proportion of children and adolescents aged 2–17 living with overweight and obesity, by remoteness area, 2017–18
This bar chart shows that, in 2017–18, for both boys and girls, the proportion of children and adolescents aged 2–17 who were overweight or obese was generally highest in Inner regional areas (29% overall), followed by Outer regional and remote areas, and lowest in Major cities (23% overall). However, not all of these differences were statistically significant.
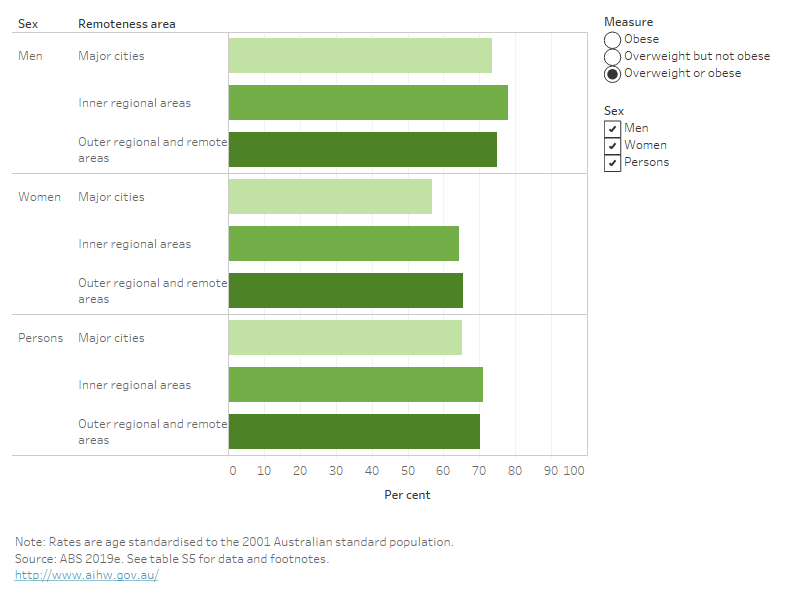
The proportion of Australians aged 18 and over who are living with overweight or obesity varies by remoteness areas (Figure 7). After adjusting for age (ABS 2019e):
- a greater proportion in the Outer regional and remote (70%) and Inner regional areas (71%) are living with overweight and obesity, compared with those in Major cities (65%).
- a greater proportion of men in Inner regional areas (78%) is living with overweight and obesity, compared with those in Major cities (73%).
- a greater proportion of women in Outer regional and remote (65%) and Inner regional areas (64%) are living with overweight and obesity, compared with those in Major cities (57%).
Figure 7: Age-standardised proportion of adults living with overweight and obesity, by remoteness area, 2017–18
This bar chart shows that after adjusting for age, in 2017–18, women living in Outer regional and remote areas, or Inner regional areas, were more likely to be overweight or obese than those living in Major cities. Men living in Inner regional areas were more likely to be overweight or obese than men living in Major cities.
Socioeconomic areas
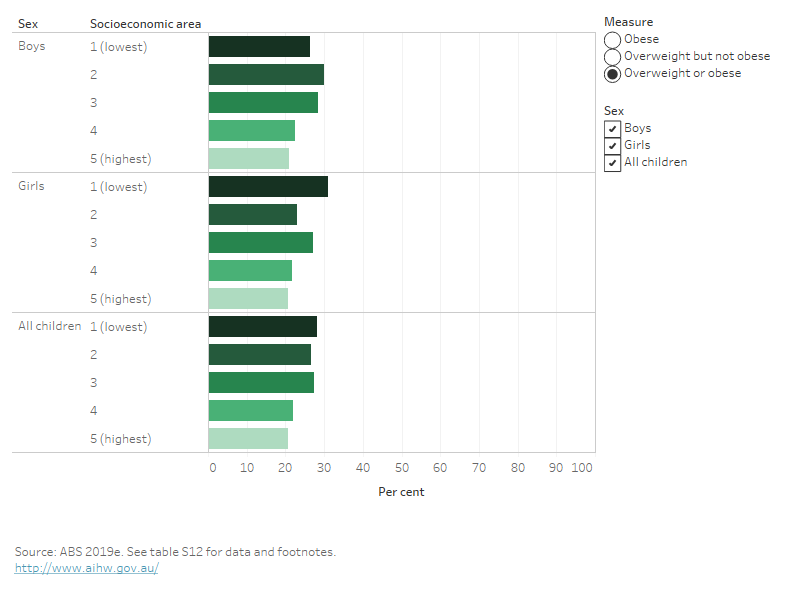
Based on the latest available data, children and adolescents aged 2–17 in the lowest socioeconomic areas are more likely to be living with overweight or obesity (28%) than those in the highest socioeconomic areas (21%) (Figure 8). The proportion of those living with obesity in this age group is also higher for those in the lowest socioeconomic areas (11%) compared with the highest socioeconomic areas (4.4%) (ABS 2019e).
Among girls, the proportion living with overweight or obesity is higher for those in the lowest socioeconomic areas (31%) compared with those living in the highest socioeconomic areas (21%). Among boys, the proportion living with overweight or obesity does not differ significantly between the lowest and highest socioeconomic areas (Figure 8).
Figure 8: Proportion of children and adolescents aged 2–7 living with overweight and obesity, by socioeconomic area, 2017–18
This bar chart shows the prevalence of overweight and obesity across 5 socioeconomic areas (with area 1 representing the most disadvantaged areas, and area 5 representing the lease disadvantaged areas). It shows that, in 2017–18, for boys and girls, the most disadvantaged areas had a higher prevalence of overweight and obesity than the least disadvantaged areas (although the differences weren’t statistically significant).
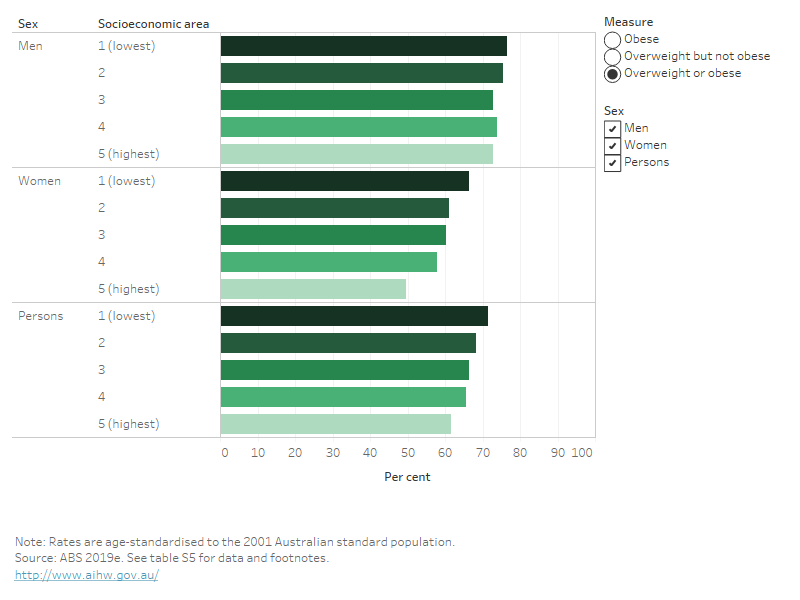
The proportion of Australians aged 18 and over who are living with overweight or obesity varies by socioeconomic areas. After adjusting for age (Figure 9):
- a greater proportion in the lowest socioeconomic areas (72%) are living with overweight or obesity, compared with those in the highest socioeconomic areas (62%).
- a greater proportion of men in the lowest socioeconomic areas (77%) are living with overweight or obesity, compared with those in the highest socioeconomic areas (73%).
- a greater proportion of women in the lowest socioeconomic areas (66%) are living with overweight or obesity, compared with those in the highest socioeconomic areas (50%).
For both men and women, the prevalence of obesity is the underlying reason for the difference by socioeconomic areas. Among men, the age-adjusted proportion of those living with obesity is 37% in the lowest socioeconomic areas, compared with 26% in the highest areas. Among women, 38% are living with obesity in the lowest socioeconomic areas, compared with 22% in the highest areas, after adjusting for age (Figure 9).
Figure 9: Age-standardised proportion of adults living with overweight and obesity, by socioeconomic area, 2017–18
This bar chart shows the prevalence of overweight and obesity, after adjusting for age, across 5 socioeconomic areas (with area 1 representing the most disadvantaged areas, and area 5 representing the lease disadvantaged areas). It shows that, in 2017–18, for men and women, the most disadvantaged areas had a higher prevalence of overweight and obesity than the least disadvantaged areas, with a larger difference observed for women.
Primary Health Networks
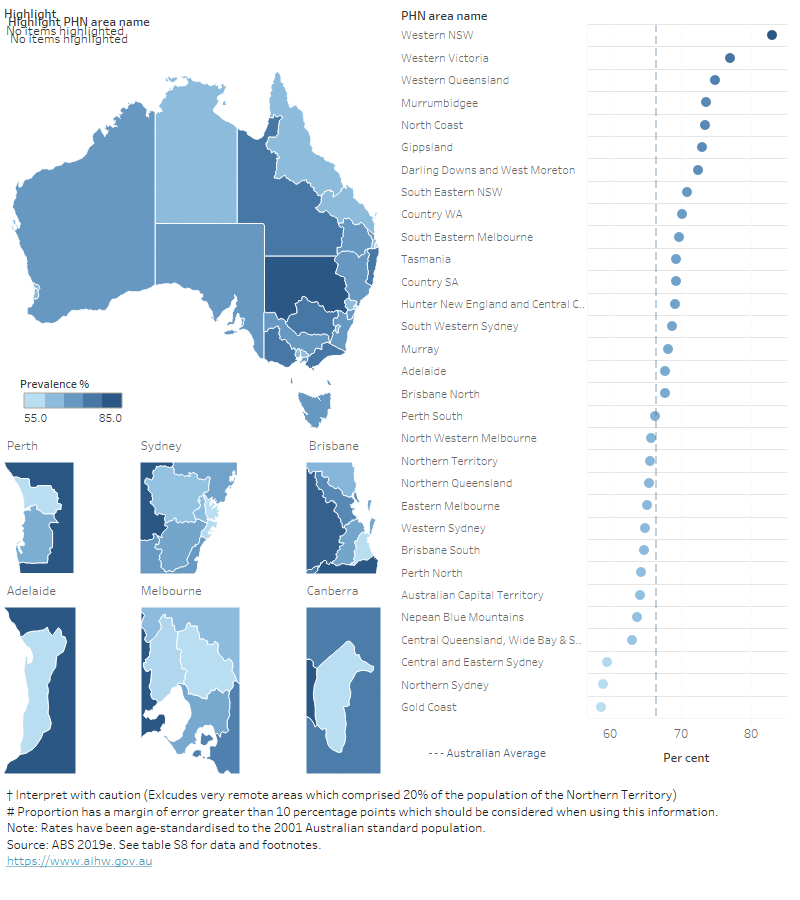
In 2017–18, after adjusting for age, the Western New South Wales PHN area had the highest prevalence of overweight an obesity, with 4 in 5 adults living with overweight or obesity (83%). The Gold Coast PHN area had the lowest prevalence, with about 3 in 5 adults living with overweight or obesity (59%) (Figure 10).
Figure 10: Age-standardised proportion of overweight and obesity in persons aged 18 and over, by Primary Health Network (PHN) areas, 2017–18
This figure shows a map of Australia with the proportion of overweight and obese adults displayed for each Primary Health Network (PHN) area. It also shows a list of PHNs with their prevalence of overweight and obese adults shown in relation to the Australian average. It shows that of 31 PHN areas, the Western NSW PHN area had the highest prevalence of overweight and obesity (83%), while the Gold Coast PHN area had the lowest (59%).
How does overweight and obesity change over time?
Children and adolescents
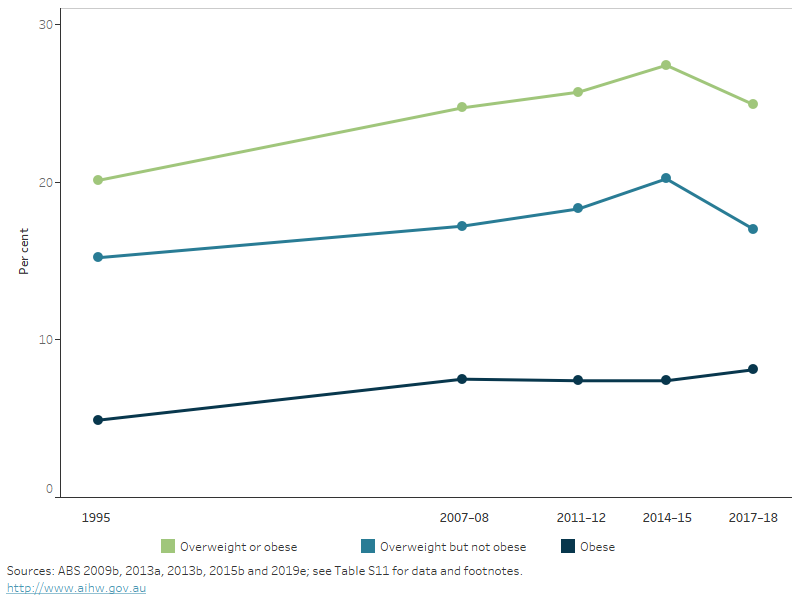
The proportion of children and adolescents living with overweight or obesity increased between 1995 and 2007–08 (from 20% to 25%), then remained relatively stable from 2007–08 to 2017–18 (ABS 2009b, ABS 2013a, ABS 2013b, ABS 2015b, ABS 2019b) (Figure 11).
Similarly, the proportion of children and adolescents living with obesity increased from 4.9% in 1995 to 7.5% in 2007–08, then remained relatively stable to 2017–18 (81%). The proportion living with overweight (but not obesity) in children rose between 1995 and 2014–15 (from 15% to 20%), then declined to 17% in 2017–18.
Figure 11: Proportion of overweight and obesity in children and adolescents aged 5–17, 1995 to 2017–18
This line chart shows 3 separate lines for the proportion of children and adolescents who were overweight or obese, overweight but not obese, and obese in 1995, 2007–08, 2011–12, 2014–15 and 2017–18. Overweight and obesity increased between 1995 and 2007–08 (from 20% to 25%), then remained relatively stable from 2007–08 to 2017–18.
Adults
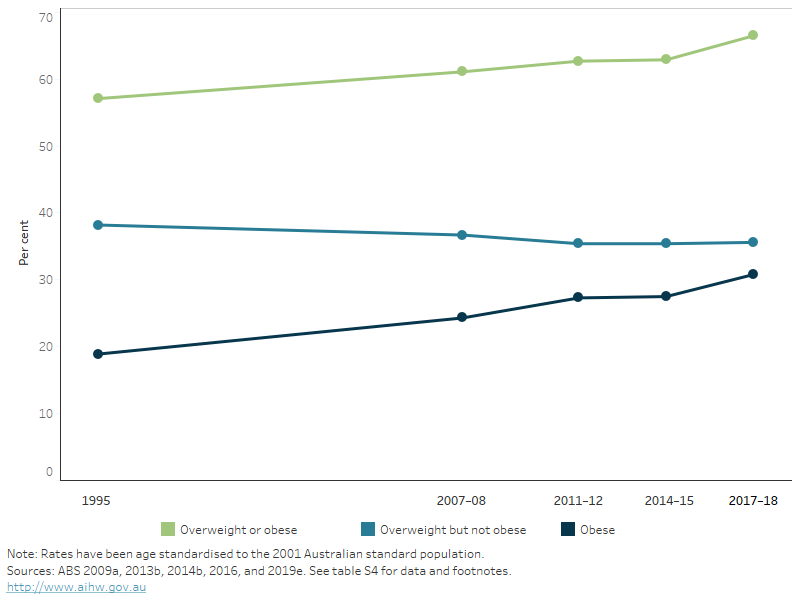
After adjusting for different population age structures over time, the proportion of adults aged 18 and over living with overweight or obesity increased from 57% in 1995 to 67% in 2017–18. Over this time, the proportion of the population living with obesity almost doubled, from 19% in 1995 to 31% in 2017–18. The proportion living with overweight but not obesity declined from 38% to 36% (Figure 12).
Figure 12: Age-standardised proportion of overweight and obesity in persons aged 18 and over, 1995 to 2017–18
This line chart shows 3 separate lines for the age-standardised proportion of adults who were overweight or obese, overweight but not obese, and obese in 1995, 2007–08, 2011–12, 2014–15 and 2017–18. The prevalence of overweight and obesity increased from 57% in 1995 to 67% in 2017–18, while the prevalence of obesity increased from 19% to 31% over this period.
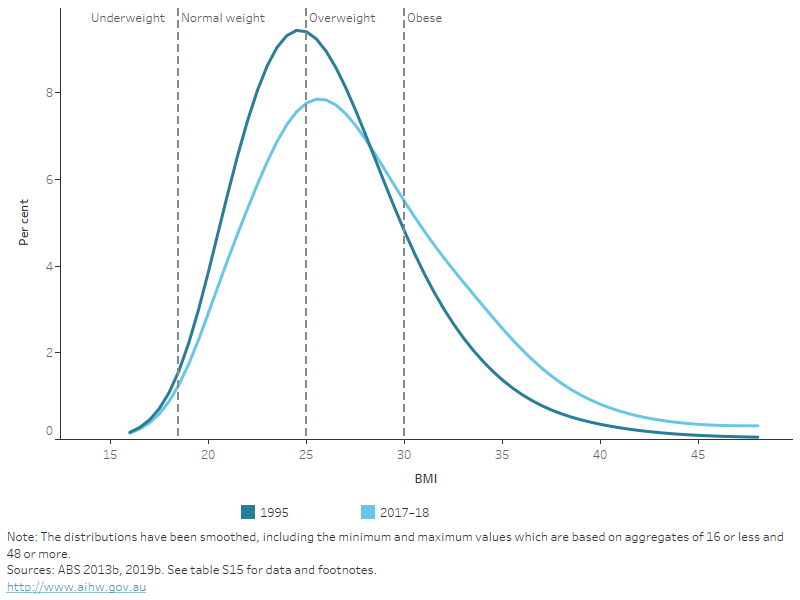
The distribution of BMI in adults shifted towards higher BMIs from 1995 to 2017–18, due to an increase in obesity in the population over time (Figure 13).
Figure 13: Distribution of BMI among persons aged 18 and over, 1995 and 2017–18
This chart shows the smoothed distributions of BMI among adults in 1995 and 2017–18, with the BMI cut-off points for underweight, normal weight, overweight and obese also shown on the chart. Compared with 1995, the 2017–18 distribution has shifted to the right, indicating an increase in obesity over time.
Birth cohorts
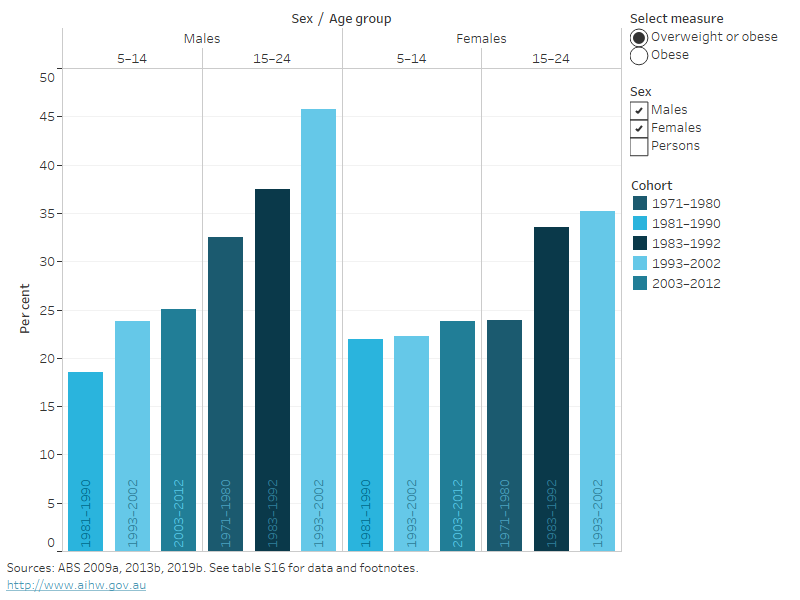
Birth cohort analysis looks at how health outcomes differ between birth cohorts, which is a group of people born in the same year or years. This type of analysis can be used to identify groups of people more at risk of a health outcome (AIHW 2020a). Analyses comparing the prevalence of overweight or obesity in Australians across three different time points (1995, 2007–08 and 2017–18) show that those born more recently are more likely to be living with overweight or obesity than people at the same age in previous years (AIHW 2020a, AIHW 2020b).
For the age group 5–14, those born most recently (in 2003–2012) are (Figure 14):
- more likely to be living with overweight or obesity (25%), compared with those born in 1981–1990 at the same age (20%)
- more likely to be living with obesity (7.7%), compared with those born in 1981–1990 at the same age (5.1%)
- not significantly more likely to be living with overweight or obesity than those born in 1993–2002.
For the age group 15–24, those born most recently (in 1993–2002) are (Figure 14):
- more likely to be living with overweight or obesity (41%) than those born in 1983–1992 at the same age (36%) and those born in 1971–1980 at the same age (28%)
- more likely to be living with obesity than those born in 1971–1980 at the same age (8.4%).
When comparing the 1993–2002 birth cohort as they aged from 5–14 to 15–24, the prevalence of overweight and obesity increased (from 23% to 41%). Obesity also increased, from 6.4% to 14% (Figure 14) (ABS 2009a).
Figure 14: Proportion of overweight and obesity in children, adolescents and young adults aged 5–24, by birth cohort and age group; measured at 1995, 2007–08 and 2017–18
This bar chart shows the prevalence of overweight and obesity for different birth cohorts at age 5–14 and age 15–24, for males and females. It shows that at age 5–14, boys born in 2003–2012 were more likely to be overweight or obese than boys born in 1981–1990 at the same age (25% compared with 19%). At age 15–24, males born in 1993–2002 were more likely to be overweight or obese than males born in 1971–1980 at the same age (46% compared with 32%), as were females (35% of females born in 1993–2002, compared with 24% of females born in 1971–1980). However, only males had a significant increase in overweight and obesity between the 1983–1992 and 1993–2002 cohorts (increasing from 38% to 46%). When comparing the 1993–2002 birth cohort as they aged from 5–14 to 15–24, the prevalence of overweight and obesity increased with age for males (from 24% to 46%) and females (from 22% to 35%).
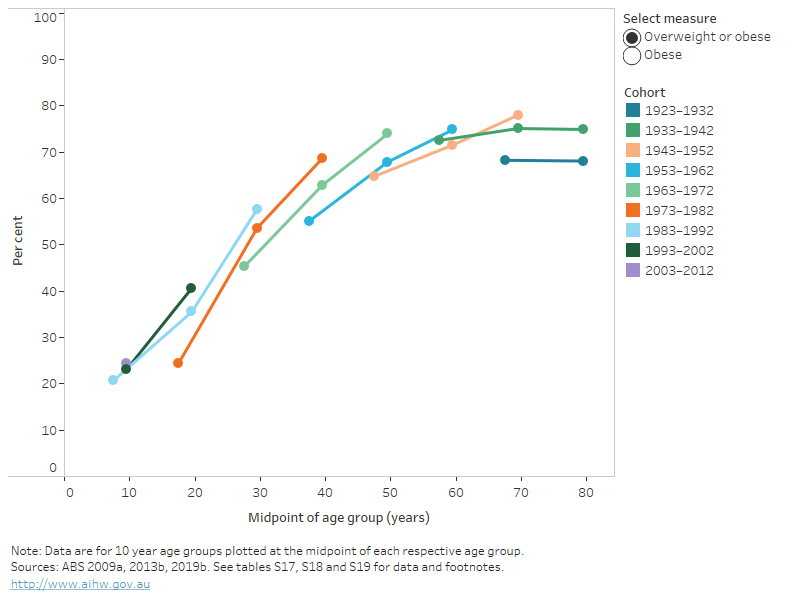
For adults aged 18 and over, those born most recently are more likely to be living with obesity than those born 10 years earlier. The largest absolute difference was at age 75–84, where an additional 11 in every 100 adults were living with obesity at age 75–84 in 2017–18 (37%) compared with those at the same age in 2007–08 (26%) (Figure 15).
Between 1995, 2007–08 and 2017–18, the prevalence of obesity increased for almost all birth cohorts. The largest absolute change in the prevalence of obesity over the 22 years was among the 1973–1982 birth cohort. The prevalence of obesity in this birth cohort nearly tripled from 6.5% when they were aged 13–22 (in 1995) to 19% when they were aged 25–34 (in 2007–08), then increased to 31% when they were aged 35–44 (in 2017–18) (Figure 15).
To learn more on birth cohort analyses, see Overweight and obesity in Australia: an updated birth cohort analysis and Overweight and obesity among Australian children and adolescents.
Figure 15: Prevalence of overweight and obesity over time, by birth cohort and age group; 1995, 2007–08 and 2017–18
This line chart shows the prevalence of overweight and obesity and obesity for 9 birth cohorts, with data for each cohort shown at the midpoint of the cohort’s age group at up to 3 time points (1995, 2007–08 and 2017–18). For most birth cohorts, the prevalence of overweight and obesity generally increased with age over time, and the group with the highest prevalence is 65–74-year-olds in 2017–18 with 40% having obesity and 78% being overweight or obese.
How does Australia compare internationally?
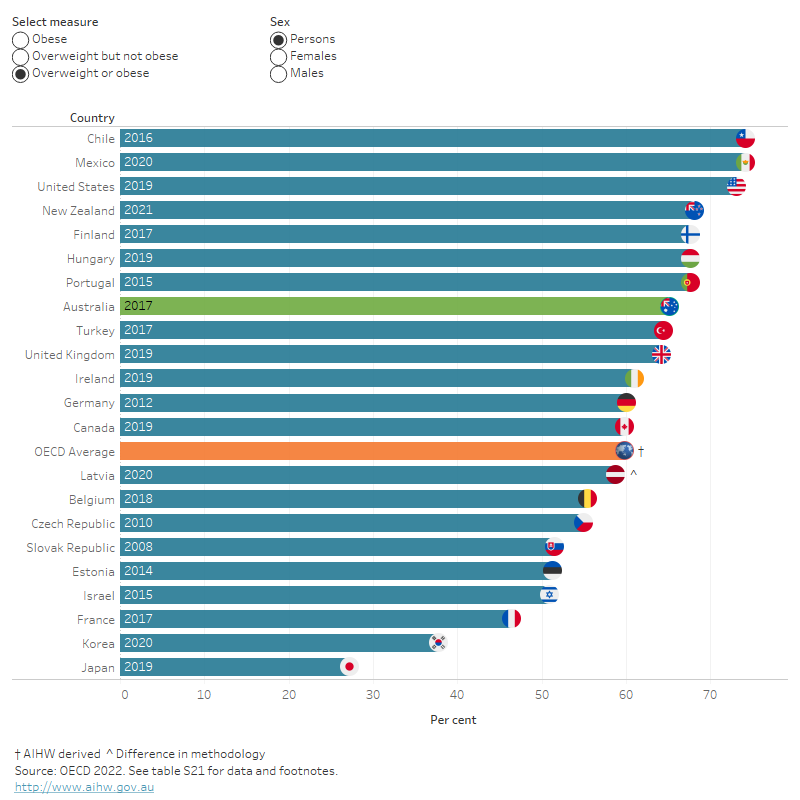
International comparisons of the prevalence of overweight and obesity can be made for member countries of the Organisation for European Co-operation and Development. Comparisons for measured body weight are based on data from 2021 or the latest available year (OECD 2022).
Australia ranked 9th out of 21 countries with available data for the proportion of people aged 15 and over who were living with overweight or obesity (65%) – this was greater than the OECD average of 60%.
When comparing the proportion of obesity in men and women across OECD countries, Australia had the 4th highest proportion of men living with obesity (32%), behind New Zealand (33%), Hungary (36%) and the United States (44%). The proportion of obesity in women in Australia was 9th highest out of 21 countries (29%) – higher than the OECD average of 26% for women (Figure 16).
Figure 16: Proportion of overweight or obesity in persons aged 15 years and over, OECD countries, 2021 or nearest year
This bar chart shows the proportion of people aged 15 and over who were overweight or obese in OECD countries in 2021 or the nearest year data were available, for males, females and persons. It shows Australia had the 6th highest proportion for overweight and obesity combined (65%), and the 5th highest proportion for obesity (30%). These were higher than the OECD averages of 59% and 24% respectively.
Notes:
Self-reported overweight and obesity data have been omitted due to concerns about reliability of estimates.
Results are for 2021 or the nearest available year of data, for countries with available data. All data are sourced from the OECD Health Statistics 2022 website, published on 30 November 2022.
The ‘OECD average’ for each indicator has been calculated by the AIHW from the latest year of data available for each of the 37 OECD member countries with available data for that indicator. It was not possible to calculate confidence intervals to indicate variability around estimates from the published data available.
Variation between indicator results for each country may occur due to differences in data collection, the data quality and the years of data available. For more information on indicator methodology and country-specific data sources used, please see OECD Health Statistics 2022 Definitions, Sources and Methods document.
Australia is among a number of OECD member countries in which the prevalence of overweight and obesity has increased over recent decades (Figure 17). These increases have been driven by the increased proportion of people who are living with obesity (OECD 2022). This upward trend is expected to continue – OECD projections show a steady increase in obesity rates until at least 2030.
Figure 17: Proportion of overweight or obesity in persons aged 15 years and over, OECD countries, 2000 to 2021
This line chart shows the proportion of people aged 15 and over who were overweight or obese in OECD countries each year from 2000 to 2021 (or the nearest year data were available). It shows that Japan and Korea had much lower rates of overweight and obesity than other countries, with Japan having the lowest prevalence across all years of data (ranging from about 24% to 27%). The country with the highest prevalence of overweight and obesity is Mexico at 75% in 2018.
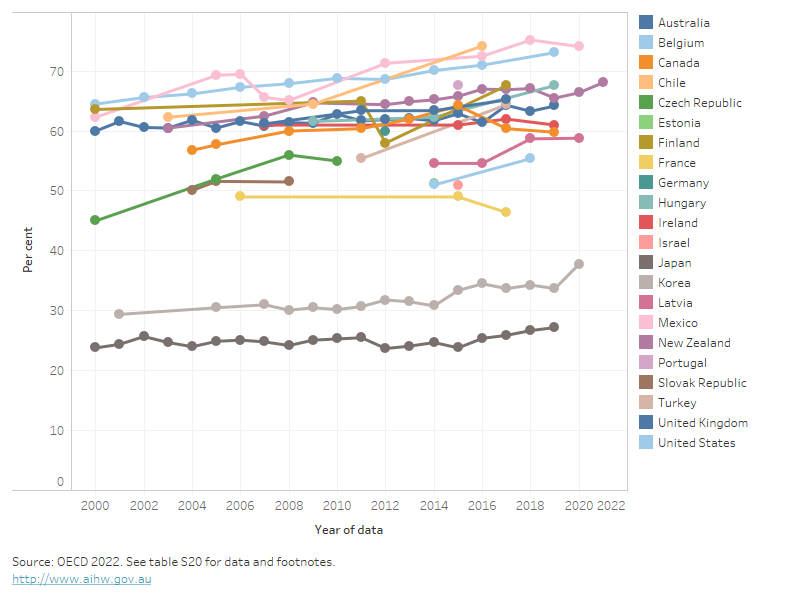
Notes:
- Unconnected markers represent countries for which data were available for only 1 of the years presented
- Data are sourced from the OECD Health Statistics 2022 website, published on 30 November 2022. Results are presented for years of available data for each country, between 2000 and 2021.
- Results are based on overweight and obesity classifications based on measured height and weight only (self-reported data have been excluded due to concerns about reliability).
- Variation in results between countries may occur due to differences in data collection and data quality. For more information on indicator methodology and country-specific data sources used, please see OECD Health Statistics 2022 Definitions, Sources and Methods document.
For more information, see International health data comparisons, 2022.
What are the health impacts of overweight and obesity?
Burden of disease is a measure of the years of healthy life lost from living with ill health or dying prematurely from disease and injury. A portion of this burden is due to modifiable risk factors. Burden of disease analysis estimates the contribution of these risk factors to this burden.
Overweight (including obesity) is the 2nd leading risk factor (after tobacco use) contributing to ill health and death, responsible for 8.4% of the total disease burden in Australia, in 2018 (AIHW 2019). Overweight (including obesity) is linked to 30 diseases, including 17 types of cancers, 4 cardiovascular diseases, 3 musculoskeletal conditions, type 2 diabetes, dementia, asthma and chronic kidney disease.
In 2018, overweight (including obesity) was responsible for:
- 55% of type 2 diabetes disease burden.
- 51% of hypertensive heart disease.
- 49% of uterine cancer.
- 43% of gout.
- 42% of chronic kidney disease.
Overweight (including obesity) contributed to around 16,400 deaths (10% of all deaths) (AIHW 2019).
The total disease burden attributable to overweight (including obesity) in 2018 was 2.2 times greater in the lowest socioeconomic group compared with the highest socioeconomic group (AIHW 2019).
See Australian Burden of Disease Study 2018: Interactive data on risk factor burden for more information on the burden of disease associated with overweight and obesity.
Impacts of COVID-19 on overweight and obesity
Nationally representative data on people’s weight in Australia during COVID-19 are not currently available. However, emerging research suggests that COVID-19 might have had an impact on the weight of some Australians.
Data from SiSU health check stations across Australia between January 2020 to December 2020 showed that on average, more people gained weight than lost weight. An average weight of 3.0 kgs per member was gained, by those who gained weight during 2020. This is a swing from net weight loss of 3.0 kgs per member during 2019. The prevalence of people with a BMI greater than 25 (classified as overweight or obese) has also increased when comparing the pre-COVID period (January 2017 to March 2020) and COVID period (April 2020-August 2021). This was seen across all age groups, except for the 65–74 and 75 and over age groups, indicating widespread population weight gain (Hannebery, et al. 2021).
It should be noted that users of SiSU health check stations tend to be younger, female and more socioeconomically advantaged than the general Australian population.
To learn more about how the pandemic has affected the population's health in the context of longer-term trends, please see ‘Chapter 2 Changes in the health of Australians during the COVID-19 period' in Australia's health 2022: data insights.
Where do I go for more information?
For more information on overweight and obesity, see:
- Overweight and obesity in Australia: a birth cohort analysis
- Overweight and obesity in Australia: an updated birth cohort analysis
- Overweight and obesity among Australian children and adolescents
Visit Overweight and obesity to see more on this topic.
ABS (Australian Bureau of Statistics) (2009a) Microdata: National Health Survey, Basic and Expanded CURF, 2007–08 (Reissue), AIHW analysis of Expanded microdata, accessed 5 April 2023.
ABS (2009b) National Health Survey: Summary of Results, 2007-2008 (Reissue), [Table 12: Health risk factors: Children aged 5 to 17 years], abs.gov.au, accessed 5 April 2023.
ABS (2013a) Australian Health Survey: Updated Results, 2011–2012, [Table 5: Body Mass Index by age and sex – Australia, states and territories], abs.gov.au, accessed 19 October 2020.
ABS (2013b) Microdata: National Nutrition Survey, 1995, AIHW analysis of Basic microdata, accessed 19 October 2020.
ABS (2014a) Australian Aboriginal and Torres Strait Islander Health Survey: Updated Results, 2012–13, [Table 8: Body Mass Index by age, Indigenous status and sex, 2012–13 – Australia], abs.gov.au, accessed 19 October 2020.
ABS (2014b) Microdata: Australian Health Survey, core content – risk factors and selected health conditions, 2011–12, AIHW analysis of Expanded microdata, accessed 30 October 2020.
ABS (2015a) Microdata: Australian Aboriginal and Torres Strait Islander Health Survey – Risk Factors and Selected Health Conditions, 2012–13, AIHW analysis of Expanded microdata, accessed 21 October 2020.
ABS (2015b) National Health Survey: First Results, 2014–15, [Table 16: Children's Body Mass Index, waist circumference, height and weight - Australia], abs.gov.au, accessed 19 October 2020.
ABS (2016) Microdata: National Health Survey, 2014–15, AIHW analysis of Expanded microdata, accessed 8 October 2020.
ABS (2018c) National Health Survey: First results, [Table16.3: Children's Body Mass Index, waist circumference, height and weight], abs.gov.au, accessed 9 October 2020.
ABS (2018e) National Health Survey: First results, [Table 8.3: Body Mass Index, waist circumference, height and weight], abs.gov.au, accessed 8 October 2020.
ABS (2018f) Self-reported height and weight, abs.gov.au, accessed 5 April 2023.
ABS (2019a) Microdata: National Aboriginal and Torres Strait Islander Health, Australia, 2018–19, AIHW analysis of Detailed microdata, accessed 21 October 2020.
ABS (2019b) Microdata: National Health Survey, 2017–18, AIHW analysis of Detailed microdata, accessed 8 October 2020.
ABS (2019c) National Aboriginal and Torres Strait Islander Health Survey, [Table 18: Health risk factors - diet, body mass, blood pressure, physical activity], abs.gov.au, accessed 19 October 2020.
ABS (2019e) National Health Survey, 2017-18, Customised data report, abs.gov.au, accessed 8 April 2023.
AIHW (Australian Institute of Health and Welfare) (2018a) Australia's health 2018, aihw.gov.au, accessed 5 April 2023.
AIHW (2019) Australian Burden of Disease Study: impact and causes of illness and death in Australia 2015, aihw.gov.au, accessed 19 October 2020.
AIHW (2020a) Overweight and obesity among Australian children and adolescents, aihw.gov.au, accessed 5 April 2023.
AIHW (2020b) Overweight and obesity in Australia: an updated birth cohort analysis, aihw.gov.au, accessed 5 April 2023.
Flitcroft L, Sun Chen W and Meyer D (2020) 'The Demographic Representativeness and Health Outcomes of Digital Health Station Users: Longitudinal Study', Journal of Medical Internet Research, 22(6):e14977, 10.2196/14977.
Hannebery P, Wei N, Streets F and Fay S (2021) 'Canary in the mine: A unique analysis of the impact of the COVID-19 pandemic on the physical and mental health of Australians', SiSU Health, sisuhealthgroup.com.
OECD (Organisation for Economic Co-operation and Development) (2017) OECD OBESITY UPDATE 2017, oecd.org, accessed 6 March 2023.
OECD (2022) OECD Health Statistics 2022, oecd.org, accessed 6 March 2023.


