Study population
The study population included 132,000 people aged 65 years and over who died from underlying cause of predictable deaths (not sudden deaths) in 2021–22.
Of these, 56% received at least one selected aged care service in the last year of life:
- 41% were living in residential aged care
- 15% were living in the community, using home care (10%) or residential respite care (5.3%).
Figure 1: Study population by use of selected aged care services in the last year of life
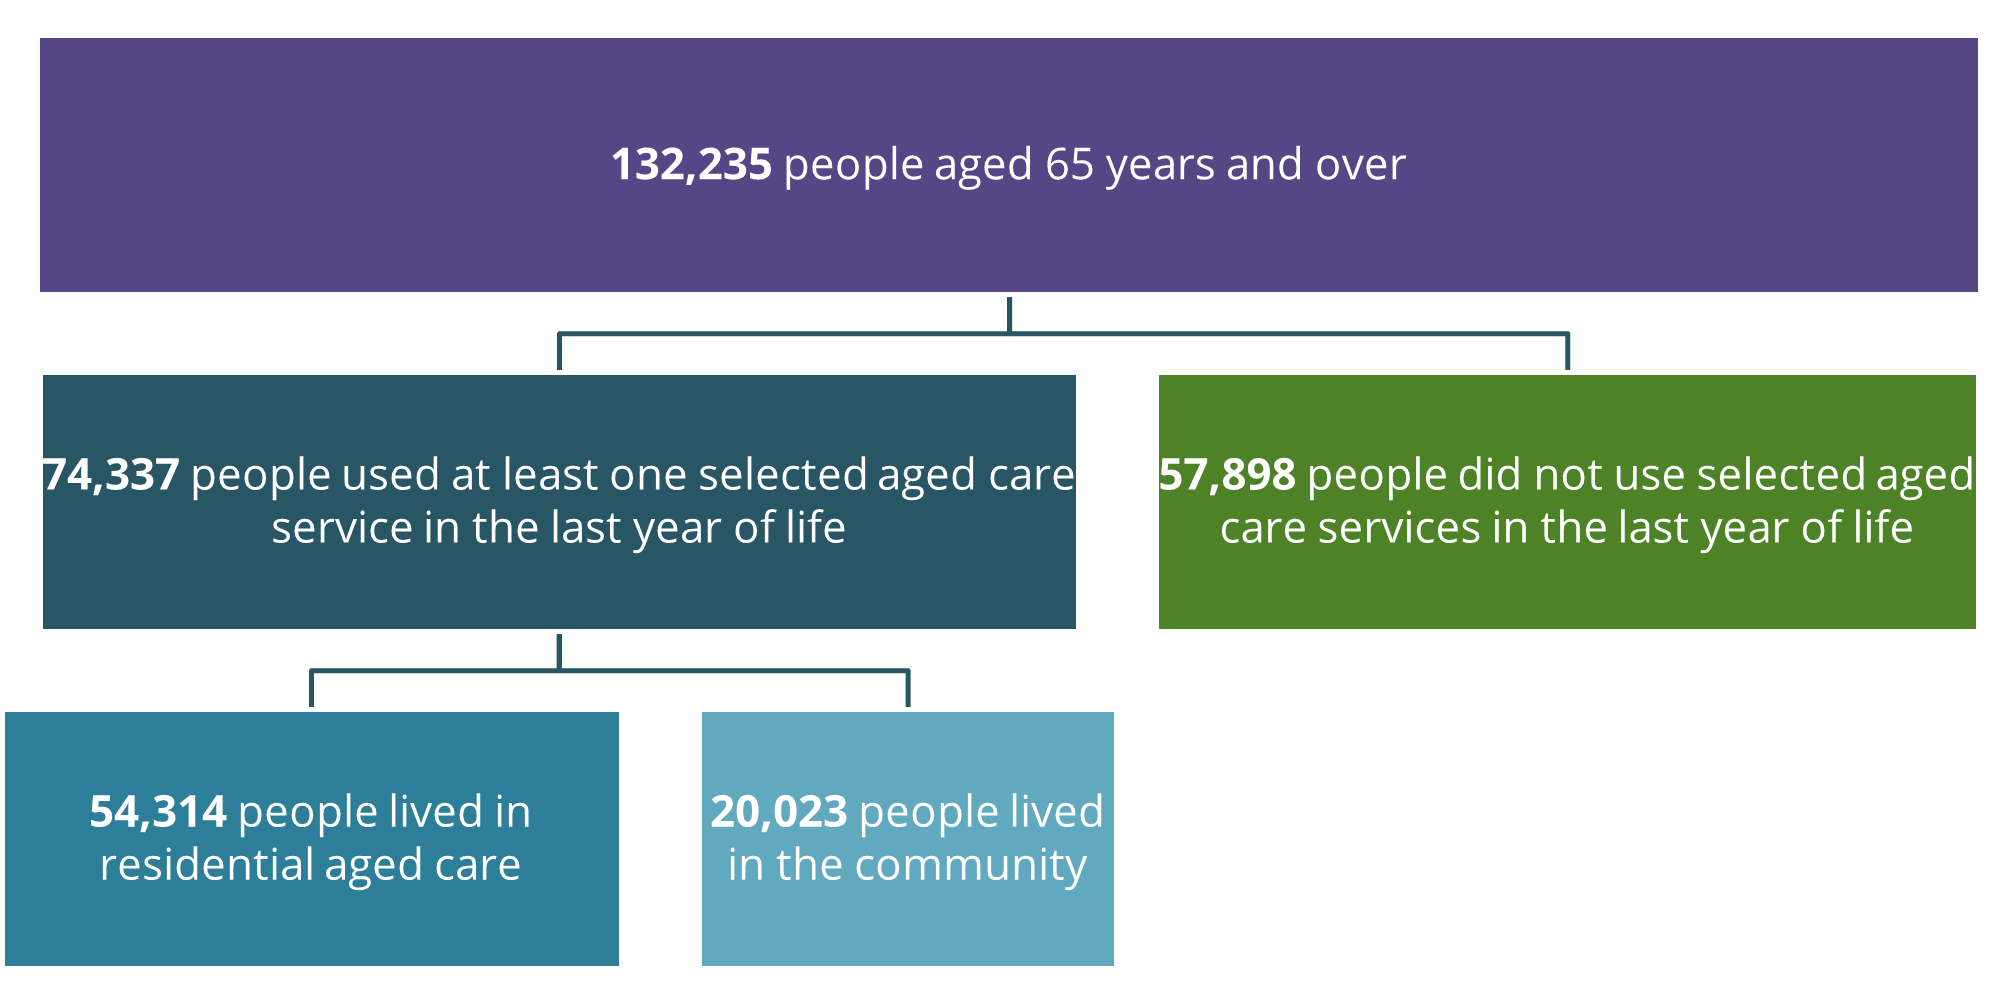
Source: National Health Data Hub. Data tables: Table 1
In this report, aged care service use in the 12 months before death was classified into three mutually exclusive categories using a hierarchical approach: people living in residential aged care, people using residential respite care, and people using home care. Individuals were assigned to the highest level of care received, and people who did not access any of these services were classified as receiving none of the selected aged care services. This method reflects the continuum of care in the last year of life and accounts for individuals who may access multiple services as their needs change. See Appendix B for further details.
Sociodemographic characteristics
Among the 132,000 people in the study population:
- People living in residential aged care were older than people using home care and residential respite care and those not receiving any of the selected aged care services – median age at death of 89, 86 and 80 years, respectively.
- A greater proportion of people living in residential aged care were female (59%). In contrast, more males than females did not receive any of the selected aged care services (59%; Figure 1). Among people using home care and residential respite care, the ratio of males to females was equal (50%).
- People living in residential aged care were slightly less likely to be in the most disadvantaged areas (quintile 1) compared with people using home care and residential respite care and those not receiving any of the selected aged care services (21%, 24% and 25%, respectively).
End-of-life disease trajectories
People who die from an underlying cause of predicable death (not sudden deaths) – including people who die from cancer, organ failure, and frailty and dementia – are considered to benefit from palliative care (see Appendix B for further details).
Among the 132,000 people in the study population, all of whom died from predictable deaths, when broken down by end-of-life disease trajectories (Figure 1):
- approximately 1 in 2 (47%) followed an organ failure trajectory, and of these almost 9 in 10 (88%) died from heart disease or stroke.
- 1 in 3 (33%) died from cancer, and people living in residential aged care were less likely to die from cancer compared with people in other settings (18% compared with 33% for people using home care and residential respite care and 48% for people not receiving any of the selected aged care services).
- more than 1 in 10 (11%) followed a frailty and dementia trajectory, and this is 2.4 times as common for people living in residential aged care (20%) compared with people using home care and residential respite care (8.2%).
Figure 2: Study population by end-of-life disease trajectory
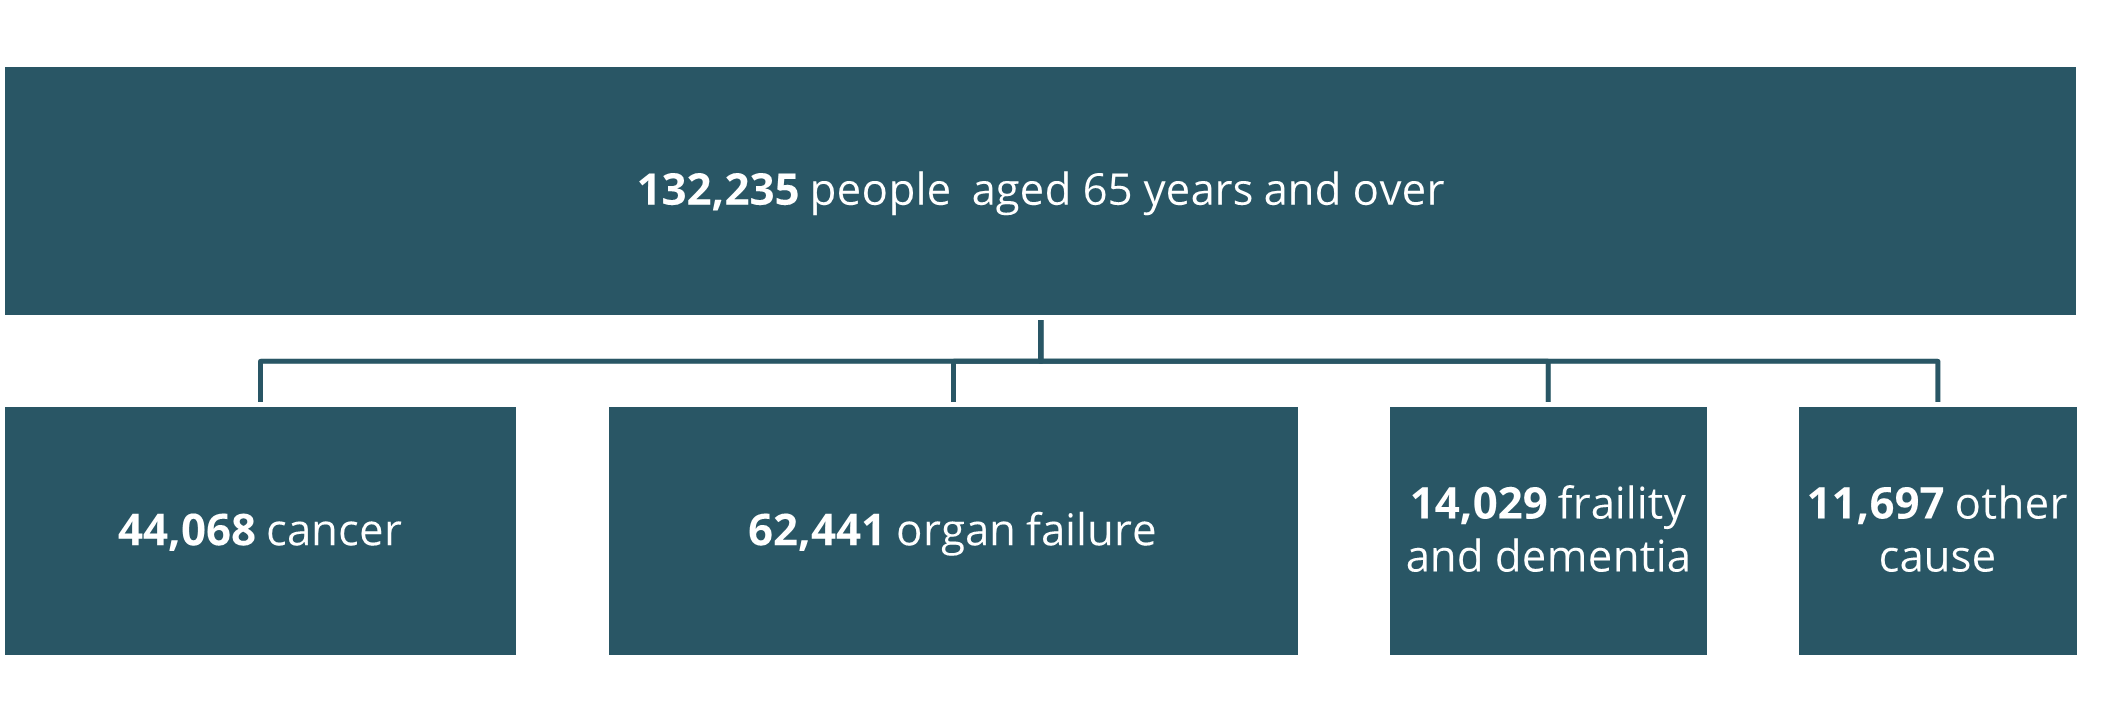
Source: National Health Data Hub. Data tables: Table 1
Figure 3: Sociodemographic characteristics of the study population by aged care service use, 2021–22
This chart shows the sociodemographic characteristics of the study population by aged care service type use. It shows breakdowns by sex, age, cause of death and socioeconomic status.
