Rates
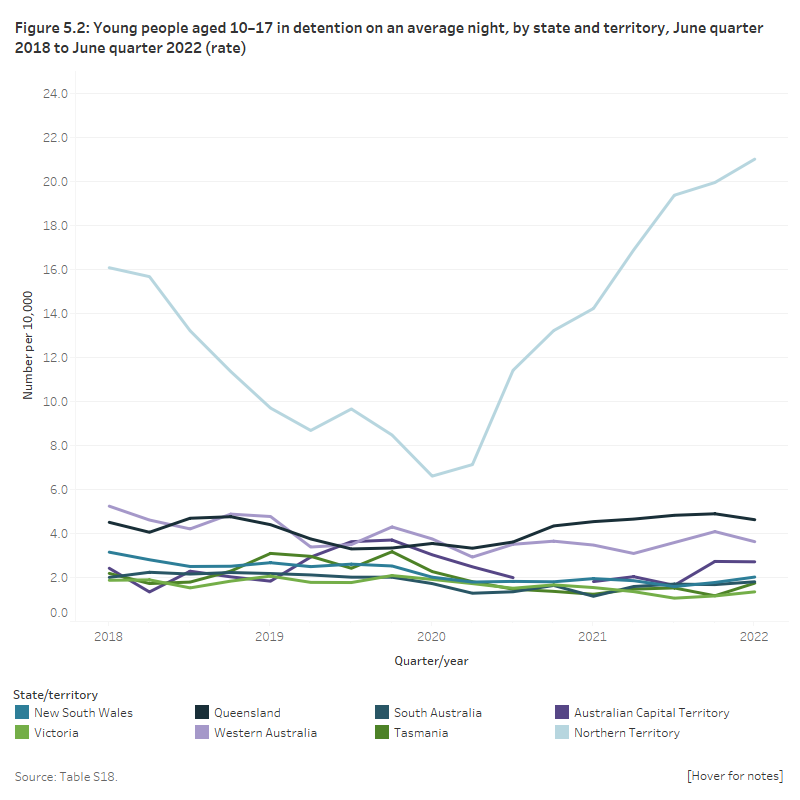
On an average night in the June quarter 2022, the rate of young people aged 10–17 in detention ranged from 1.3 per 10,000 in Victoria to 21 per 10,000 in the Northern Territory. Queensland had the second highest rate of young people aged 10–17 in detention at 4.6 per 10,000. Rates in Victoria (1.1–2.1 per 10,000) and South Australia (1.1–2.2 per 10,000) were generally lower than other states and territories (Figure 5.2).
Over the 4-year period, the Northern Territory consistently had the highest rate of young people in detention on an average night each quarter (6.6–21 per 10,000 aged 10–17). This rate was at its peak in the June quarter 2022 (21 per 10,000) and lowest in the June quarter 2020 (6.6 per 10,000). In this period, there were declines in the rate of young people in detention on an average night in New South Wales, Victoria, Western Australia and South Australia (Table S18).
In the Northern Territory, from the June quarter 2020 to the June quarter 2022 there continued to be a sharp increase in the rate of young people in detention on an average night from 6.6 per 10,000 in the June quarter 2020 to 21 per 10,000 in the June quarter 2022 (Figure 5.2).
Figure 5.2: Young people aged 10–17 in detention on an average night, by state and territory, June quarter 2018 to June quarter 2022 (rate)
This line graph presents 8 lines showing the rate of young people per 10,000 aged 10–17 in detention in each state and territory on an average night over the 4-year period. It shows that the Northern Territory consistently had the highest rate of young people in detention on an average night, all other states and territories reported a rate below 6 per 10,000.

Rates for young people aged 10–13 for states and territories are not reported, as numbers in most jurisdictions are too low for rates to be reliably calculated.
|
Quarter |
Detention type |
NSW |
Vic |
Qld |
WA |
SA |
Tas |
ACT |
NT |
Australia |
|---|---|---|---|---|---|---|---|---|---|---|
|
June quarter 2018 |
Sentenced |
1.2 |
0.8 |
0.6 |
2.3 |
0.8 |
— |
— |
11.5 |
1.1 |
|
June quarter 2021 |
Sentenced |
0.6 |
0.2 |
0.5 |
1.2 |
— |
— |
— |
4.3 |
0.5 |
|
June quarter 2022 |
Sentenced |
0.4 |
0.2 |
0.5 |
1.0 |
0.7 |
— |
— |
3.5 |
0.5 |
|
June quarter 2018 |
Unsentenced |
2.0 |
1.1 |
3.9 |
2.9 |
1.2 |
1.4 |
1.6 |
4.6 |
2.2 |
|
June quarter 2021 |
Unsentenced |
1.4 |
1.3 |
4.1 |
2.3 |
1.0 |
1.1 |
1.4 |
9.9 |
2.1 |
|
June quarter 2022 |
Unsentenced |
1.6 |
1.1 |
4.1 |
2.7 |
1.1 |
1.2 |
2.1 |
17.5 |
2.3 |
|
June quarter 2018 |
Total |
3.2 |
1.9 |
4.5 |
5.2 |
2.0 |
2.2 |
2.4 |
16.1 |
3.4 |
|
June quarter 2022 |
Total |
1.9 |
1.5 |
4.5 |
3.5 |
1.1 |
1.2 |
1.8 |
14.2 |
2.6 |
|
June quarter 2022 |
Total |
2.0 |
1.3 |
4.6 |
3.6 |
1.8 |
1.7 |
2.7 |
21.0 |
2.8 |
Notes
- Rates are for young people aged 10–17. Numbers include young people aged 18 or over who are under youth justice supervision. For numbers of young people aged 10–17 only, refer to the supplementary tables.
- Trends among small populations should be interpreted with caution. Numbers tend to fluctuate from quarter to quarter due to random variation, and this might affect the appearance and interpretation of trends.
- Rates are calculated from the unrounded average nightly populations, and are not published when there are fewer than 5 young people in the numerator. There might be instances when a numerator is presented as 5 due to rounding, and the rate is not calculated (see ‘Technical Notes’).
- For Queensland, the June quarter 2018 and the June quarter 2021 are not comparable, due to legislation to increase the age limit in the youth justice system from 16 to 17 enacted in the March quarter 2018. This change resulted in an increase in young people aged 17 under youth justice supervision.
Source: tables S18, S36, and S54.
Sentenced and unsentenced detention
On an average night in the June quarter 2022, the rate of young people aged 10–17:
- in unsentenced detention ranged from 1.1 per 10,000 in South Australia and Victoria to 17.5 per 10,000 in the Northern Territory
- in sentenced detention ranged from 0.2 per 10,000 in Victoria to 3.5 per 10,000 in Northern Territory (among the states and territories for which data is available, Table 5.2).
Over the 4‑year period, the rate of young people in unsentenced detention on an average night declined in New South Wales (2.0 to 1.6 per 10,000) (Table 5.2). Trends could not be reliably determined in Tasmania and the Australian Capital Territory, while other states showed no clear trend.
In the Northern Territory, the rate of young people in unsentenced detention on an average night sharply increased from the June quarter 2018 to the June quarter 2022 (4.6 to 17.5 per 10,000, respectively) (Table 5.2).
Between the June quarter 2018 and the June quarter 2022, the rate of young people in sentenced detention fell in New South Wales, Victoria, Queensland, Western Australia, South Australia and the Northern Territory. Trends could not be reliably determined in Tasmania and the Australian Capital Territory.
Young Aboriginal and Torres Strait Islander people
On an average night in the June quarter 2022, the rate of young Indigenous Australians aged 10–17 in detention ranged from 12 per 10,000 in Victoria to 46 per 10,000 in Northern Territory.
The non-Indigenous rate ranged from 0.8 per 10,000 in New South Wales and Western Australia to 2.1 per 10,000 in Australian Capital Territory (tables S1, S6, and S18).
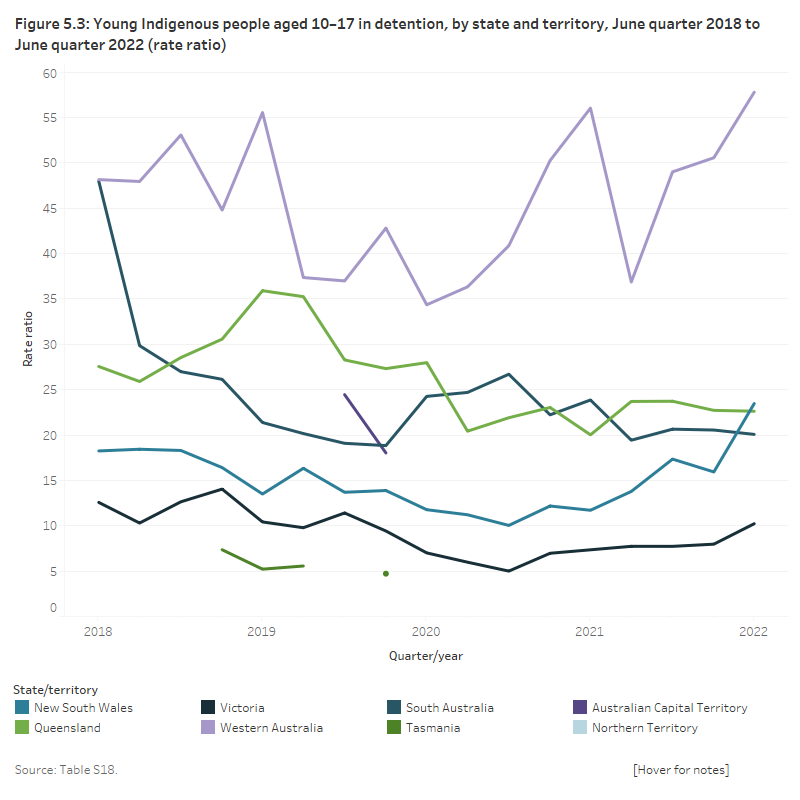
Among the states and territories for which rate ratios could be calculated, the rate ratio ranged from 10 times the non-Indigenous rate in Victoria to 58 times in Western Australia in the June quarter 2022 (Table S18).
Over the 4‑year period, the rate of young Indigenous Australians aged 10–17 in detention has fallen in New South Wales, Victoria, Western Australia, and South Australia; leading to subsequent declines in the rate ratios for these states except for New South Wales and Western Australia (Table S18). The rate ratio was lowest in Victoria, at 5.0–14, and highest in Western Australia, at 34–58 (Figure 5.3).
Due to the small rates of young non‑Indigenous Australians in detention, notably in Western Australia and South Australia, variances can cause large fluctuations in the rate ratio.
For most quarters, rate ratios could not be calculated for:
- Tasmania and the Australian Capital Territory, due to the small number of Indigenous Australians
- Northern Territory, due to the small number of non-Indigenous Australians.
Figure 5.3: Young people aged 10–17 in detention, by selected states, June quarter 2018 to June quarter 2022 (rate ratio)
This line graph presents lines for 5 Australian states (New South Wales, Victoria, Queensland, Western Australia, and South Australia), showing the level of Indigenous over-representation in youth detention. The rate ratio was highest in Western Australia for most quarters over the 4‑year period, except June quarter 2018, when both South Australia and Western Australia had the highest rate. Victoria had the lowest rate ratio over the 4-year period. Due to insufficient numbers, for most quarters the rate ratio could not be calculated for the Australian Capital Territory, Tasmania, and the Northern Territory.


