Children on care and protection orders
Key findings: Children on a care and protection order, 2020–21
Care and protection orders (CPOs) are legal orders or arrangements that place some responsibility for a child’s welfare with child protection authorities. In Australia, state and territory governments are responsible for statutory child protection. Their respective departments work with children and families to protect them from abuse, neglect or other harm (AIHW 2021).
Between 2014–15 and 2019–20, the rate of children on care and protection orders increased from 9.1 per 1,000 children to 11 per 1,000 children (AIHW 2021). Of the 60,900 children on care and protection orders at 30 June 2020, most were living in home-based care, either with relative/kinship carers (36%) or in foster care (28%). While many children are moved into out-of-home care, others remain living at home with family support provided by community-based agencies.
Pathways into homelessness for children on care and protection orders are complex. For example, children who present alone may have absconded from their home due to family violence, abuse or neglect (Noble-Carr & Trew 2018). Children may also seek support from SHS agencies with their carers.
Family and domestic violence is one of the main reasons that families at risk of homelessness seek assistance from SHS agencies. It is also one of the leading reasons for statutory intervention, and SHS agencies often work with the same families and children as child protection authorities (MICAH Projects 2016). Linked data has been used to describe the characteristics of children and young people who received both child protection (an investigated notification, care and protection order or out-of-home care) and specialist homelessness services (SHS) (AIHW 2016). Compared with children who accessed only SHS, children who accessed both child protection and SHS were more likely to have experienced family and domestic violence (53%, compared with 44%). For more information about children on care and protection orders, see Child protection Australia 2019–20.
Reporting children on care and protection orders in the Specialist Homelessness Services Collection (SHSC)
A client is reported as being under a care and protection order (CPO) if they are under 18 and have provided any of the following information in any support period during the reporting period.
They reported that they were under a CPO and had the following care arrangements:
- residential care
- family group home
- relatives/kin/friends who are reimbursed
- foster care
- other home-based care (reimbursed)
- relatives/kin/friends who are not reimbursed
- independent living
- other living arrangements
- parents, or
They have reported ‘transition from foster care/child safety residential placements’ as a reason for seeking assistance or the main reason for seeking assistance.
For more information, see Technical notes.
Figure CPO.1: Characteristics of children on care and protection orders
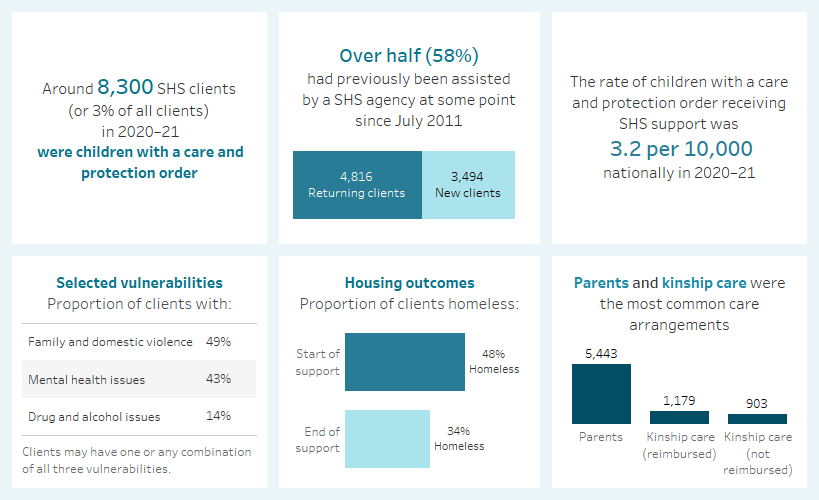
This interactive image describes the characteristics of around 8,300 children on a care and protection order who received SHS support in 2020–21. Most clients were aged 0–9 years. More than a third were Indigenous. Most presented with a single parent. The majority of clients had previously been assisted by a SHS agency since July 2011. Half were at risk of homelessness at the start of support. Most were in major cities.

This interactive stacked bar graph shows children on a care and protection order by placement type and age group. The most common care arrangement was with parents, followed by kinship care, foster care, other living arrangements, independent living, residential care, family group home and other home-based care.

Selected vulnerabilities
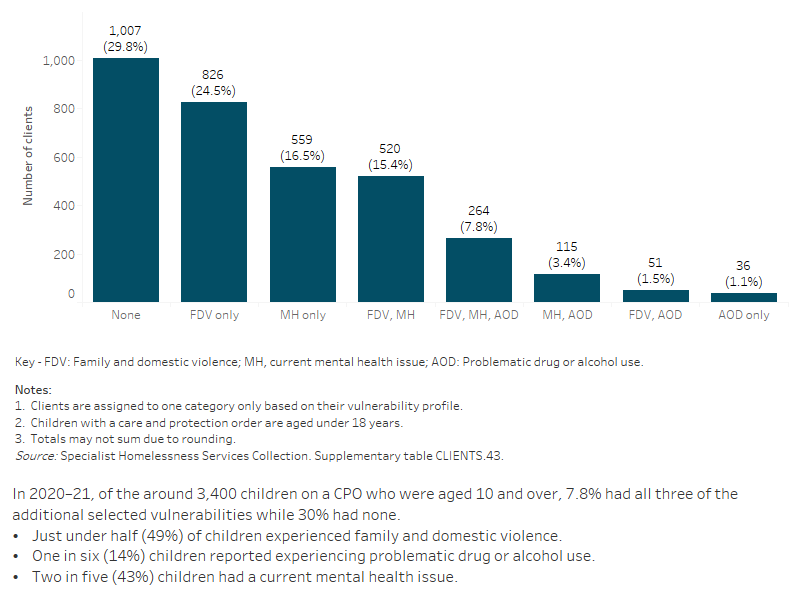
Children on a CPO may face additional vulnerabilities that make them more susceptible to becoming homeless, in particular family and domestic violence, a current mental health issue and problematic drug and/or alcohol use. These vulnerabilities are only assessed in clients aged 10 and over.
Figure CPO.3: Children on care and protection orders, by selected vulnerabilities, 2020–21
Service use patterns
The length of support children on protection orders received increased in 2020–21 to a median of 102 days, up from 99 days in 2016–17. The average number of support periods per client however has remained consistent over time from an average of 1.8 support periods per client in 2016–17 to 1.7 in 2020–21. The proportion of clients receiving accommodation has decreased from 53% in 2016–17 to 49% in 2020–21, while the median number of nights accommodated increased from 69 in 2016–17 to 76 in 2020–21 (Supplementary table CLIENTS.44).
New or returning clients
More than half of the children on a CPO (58% or around 4,800 clients) were returning clients (Supplementary table CLIENTS.38), having received assistance from a SHS agency at some point since the collection began in July 2011. Returning clients were more likely than new clients to be aged 10–17 (42%, compared with 38%), conversely new clients were more likely to be aged 0–9 years (62% compared with 58% of returning clients).
Main reasons for seeking assistance
In 2020–21, the main reasons for seeking assistance among children on a CPO were (Supplementary table CPO.4):
- family and domestic violence (39% or over 3,200 clients)
- housing crisis (16% or around 1,300 clients)
- inadequate or inappropriate dwelling conditions (10% or over 800 clients).
Family and domestic violence was the most common reason for seeking assistance for both homeless and at risk children on CPO, though the proportion was much higher for children at risk (48% or nearly 1,800 clients, compared with 29% or just over 1,000) (Supplementary table CPO.5).
Services needed and provided
Similar to the overall SHS population, most children on a CPO needed general services that were provided by SHS agencies including advice/information, advocacy/liaison on behalf of client and other basic assistance.
Figure CPO.4: Children on care and protection orders, by services needed and provided, 2020–21
This interactive stacked horizontal bar graph shows the services needed by children on a care and protection order and their provision status. Short term accommodation was the most needed and most provided service. Long term housing was the least provided service.

This interactive Sankey diagram shows the housing situation (including rough sleeping, couch surfing, short-term accommodation, public/community housing, private housing and institutional settings) of children on a care and protection order with closed support periods at first presentation and at the end of support. The diagram shows clients’ housing situation journey from start to end of support. Most started and ended support in private housing.
