Young people presenting alone

Key findings: Young people presenting alone, 2020–21

This diagram highlights a number of key findings concerning young people presenting alone. Around 41,700 SHS clients in 2020–21 were young people presenting alone; the rate of these clients was 16.2 per 10,000 population; the majority had previously been assisted at some point since July 2011; around 48%25 had mental health issues; 71%25 were not enrolled in any form of education or training at the start of support; and they most commonly sought assistance due to family and domestic violence, housing crisis or relationship/family breakdown.

Some known drivers of youth homelessness include drug issues, mental health issues, gender and LGBTIQ+ issues, difficult family situations (including parental drug and alcohol abuse and family and domestic violence), insecure employment and a lack of income (MacKenzie et al. 2020). Young people may also face discrimination in the private rental market due to lack of rental references and fewer financial resources (Homelessness Australia 2016) and they are less able to access social housing (MacKenzie et al. 2020). As such, leaving the parental home prior to establishing stable employment is also a significant risk factor for youth homelessness (Carlisle et al. 2018, Steen & MacKenzie 2017).

Recognising the severe impact that homelessness may have on the lives of young Australians, children and young people are a national priority homelessness cohort in the National Housing and Homelessness Agreement (CFFR 2018) (see Policy section for more information).

In 2020–21, around 41,700 people aged 15–24 presented alone to SHS agencies, accounting for 15% of all SHS clients (Supplementary table YOUNG.1).

Client characteristics

Figure YOUNG.1: Key demographics, young people presenting alone, 2020–21

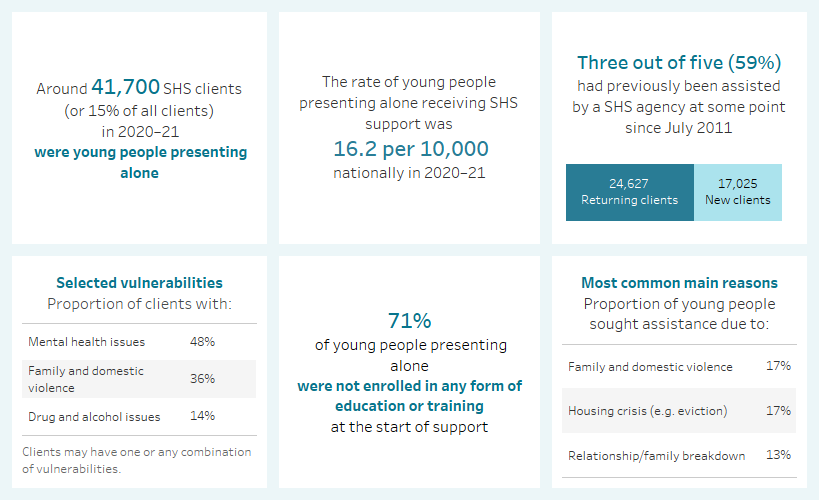
This interactive image describes the characteristics of around 41,700 young people presenting alone who received SHS support in 2020–21. Most clients were female, aged 18–24 years. Around a third were Indigenous. New South Wales had the greatest number of clients and the Northern Territory had the highest rate of clients per 10,000 population. The majority of clients had previously been assisted by a SHS agency since July 2011. Half were experiencing homelessness at the start of support. Most were in major cities.

Selected vulnerabilities

Young people presenting alone may face additional vulnerabilities that make them more susceptible to homelessness, in particular, family and domestic violence, mental health issues and problematic drug and/or alcohol use.

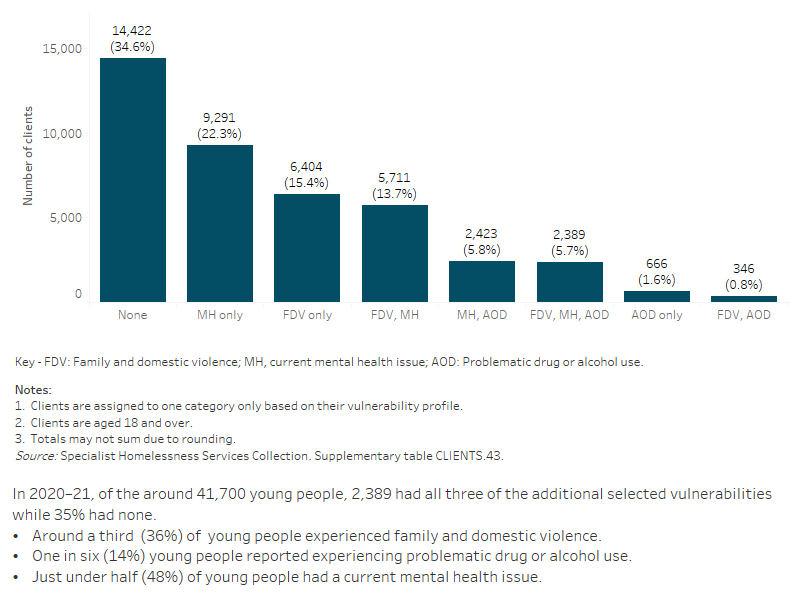
Figure YOUNG.2: Young people presenting alone, by selected vulnerability characteristics, 2020–21

This bar graph shows the number of clients also experiencing additional vulnerabilities, including having a current mental health issue, problematic drug and/or alcohol use, or experiencing family and domestic violence. The graph shows both the number of clients experiencing a single vulnerability only, as well as combinations of vulnerabilities.

Service use patterns

The length of support young people presenting alone received increased in 2020–21 to a median of 60 days, up from 47 days in 2016–17. The average number of support periods per client has remained consistent over time from an average of 1.9 support periods per client in 2016–17 to 1.9 in 2020–21. The proportion of clients receiving accommodation has remained constant; 31% in 2016–17 and 32% in 2020–21. The median number of nights accommodated increased from 44 in 2016–17 to 46 in 2020–21 (Supplementary table CLIENTS.44).

Main reasons for seeking assistance

In 2020–21, the main reasons for seeking assistance among young people presenting alone were (Supplementary table YOUNG.4):

  • family and domestic violence (17% or around 7,000 clients)
  • housing crisis (17% or around 7,000 clients)
  • relationship/family breakdown (13% or over 5,200 clients).

Young people who were known to be homeless at first presentation were more likely to identify housing crisis (22%, compared with 13% of clients at risk) or inadequate or inappropriate dwelling conditions (17%, compared with 8.9% at risk) as their main reason for seeking assistance (Supplementary table YOUNG.5).

Family and domestic violence was the most commonly reported main reason for seeking assistance among young people presenting alone who were known to be at risk of homelessness (21%, compared with 9.9% of homeless clients) (Supplementary table YOUNG.5).

Services needed and provided

Similar to the overall SHS population, the majority of young people presenting alone needed general services that were provided by SHS agencies including advice/information, advocacy/liaison on behalf of the client and other basic assistance.

Young people presenting alone were more likely than the overall SHS population to request services including (Supplementary tables YOUNG.2, CLIENTS.23):

  • living skills/personal development (34%, compared with 18%), with 91% receiving this service
  • educational assistance (19%, compared with 8.3%), with 73% receiving this service
  • employment assistance (17%, compared with 6.0%), with 69% receiving this service
  • training assistance (13%, compared with 3.9%), with 65% receiving this service.

Figure YOUNG.3: Young people presenting alone, by services needed and provided, 2020–21

This interactive stacked horizontal bar graph shows the services needed by young people presenting alone and their provision status. Long term housing was the most needed service and least provided by need. Assistance to sustain tenancy or prevent tenancy failure or eviction was the most provided service.

Housing situation and outcomes

Outcomes presented here describe the change in a clients’ housing situation between the start and end of support. Data is limited to clients who ceased receiving support during the financial year – meaning that their support periods had closed and they did not have ongoing support at the end of the year.

Many clients had long periods of support or even multiple support periods during 2020–21. They may have had a number of changes in their housing situation over the course of their support. These changes within the year are not reflected in the data presented here, rather the client situation at the start of their first support period in 2020–21 is compared with the end of their last support period in 2020–21. A proportion of these clients may have sought assistance prior to 2020–21, and may again in the future.

By the end of support, many clients have achieved or progressed towards a more positive housing solution. That is, the number and/or proportion of clients ending support in public or community housing (renter or rent-free) or private or other housing (renter or rent-free) had increased compared with the start of support.

For young people presenting alone in 2020–21, around 14,000 clients (54%) were experiencing homelessness at the start of support; 7,600 (29%) were couch surfing. By the end of support, 60% of clients were housed (Supplementary table YOUNG.3).

Figure YOUNG.4: Housing situation for young people presenting alone with closed support, 2020–21

This interactive Sankey diagram shows the housing situation (including rough sleeping, couch surfing, short-term accommodation, public/community housing, private housing and institutional settings) of young people presenting alone with closed support periods at first presentation and at the end of support. The diagram shows clients’ housing situation journey from start to end of support. Most clients started and ended support in private housing or other housing.

Where do I go for more information?

See Homelessness services for more information on this topic.

For more information on young people and homelessness and homelessness services, see: