Older clients
Key findings: Older clients, 2020–21
Australian and international research suggest that there are two main and contrasting pathways into homelessness for older people, each with different risk factors. Firstly, many people who experience homelessness for the first time later in life have led “conventional” lives (Shinn et al. cited in Petersen et al. 2014) involving employment, residential stability and family; these people only experienced homelessness after critical life events such as relationship breakdown, financial trouble or the onset of illness (Petersen et al. 2014). Three factors may be important for this subgroup, which is more often female, educated and in good health: (1) they have an element of financial insecurity, often because of a history of low paid or insecure work, (2) they are unfamiliar with health and welfare systems, (3) they may have a reluctance to draw on existing social capital (Burns and Sussman, 2018).
Secondly, there is also a population of older adults who have experienced long-term, or chronic, homelessness often with poor physical and mental health and histories of substance misuse and institutionalisation (Petersen et al. 2014). For this group, the pathway to homelessness is an ongoing issue, featuring repeated attempts to obtain assistance, long-term housing instability, little or no social capital and limited options before becoming homeless at later ages (Burns and Sussman, 2018).
Affecting both groups is the increasing cost of home ownership and of rental accommodation, which has resulted in fewer older Australians owning their own home (ABS 2019), and many older Australians on low incomes being unable to compete in rental markets (Nesbitt and Johnson 2019). Also relevant is a lack of age-specific services for older people as well as an unawareness of available services and, in some cases, an unwillingness to engage with services because of shame (Thredgold et al. 2019).
The Royal Commission into Aged Care Quality and Safety (2021) found that the current aged care system is not adequately equipped to support people from a range of backgrounds, including those who have experienced homelessness or are at risk of becoming homeless. The Commission made a series of recommendations relating to SHS agencies such as providing personal advisers for older people in order to link them with housing services as well as developing more affordable and appropriate housing. The Government responded to the Commission’s recommendations on 1 May 2021 and committed to providing grants for aged care in regional, rural and remote areas that assist First Nations people, as well as those experiencing or at risk of experiencing homelessness. The Government also upheld a commitment to the 30% increase in the Viability and Homelessness Supplement that commenced in March 2020 until commencement of the Australian National Aged Care Classification (AN-ACC) funding model.
For the purposes of the Specialist Homelessness Services Collection (SHSC), older people are defined as clients aged 55 years and over. For further information, see Technical notes.
Older women
Older women are increasingly experiencing homelessness due to lower lifetime incomes, less access to financial assets such as superannuation because they are more likely to take on informal care responsibilities, relationship breakdown, and the consequences of family and domestic violence (Power et al. 2018; Cameron 2013). In 2016, there were an estimated 6,900 older homeless women on Census night, an increase of 2,100 (44%) from 4,800 in 2006 (ABS 2012, ABS 2018a). Research has suggested that there may be more homeless women than data suggests given the tendency of women to ‘self-manage’ their homelessness rather than utilising SHS (Australian Human Rights Commission 2019).
During their lifetime, women are more likely to take leave from the workforce and return to paid employment on a part-time or casual basis, which influences their lifetime superannuation savings.
- In 2017–18, a smaller proportion of women (64%) than men (75%) aged 20–74 years were employed and of those employed, women (44% of those employed) were more likely to be working part-time compared with men (16%) (ABS 2018b).
- In 2015–16, the median superannuation balance at, or approaching, 55–64 years, for women was $96,000, considerably lower than $166,300 for men (ABS 2018b).
- In 2015–16, for those aged 65 years and over who were not in the labour force, a smaller proportion of women relied on their superannuation pension or annuity as their main source of income than men (14% of women compared with 22% of men) (ABS 2018b).
Client characteristics
Figure OLDER.1: Key demographics, older SHS clients, 2020–21
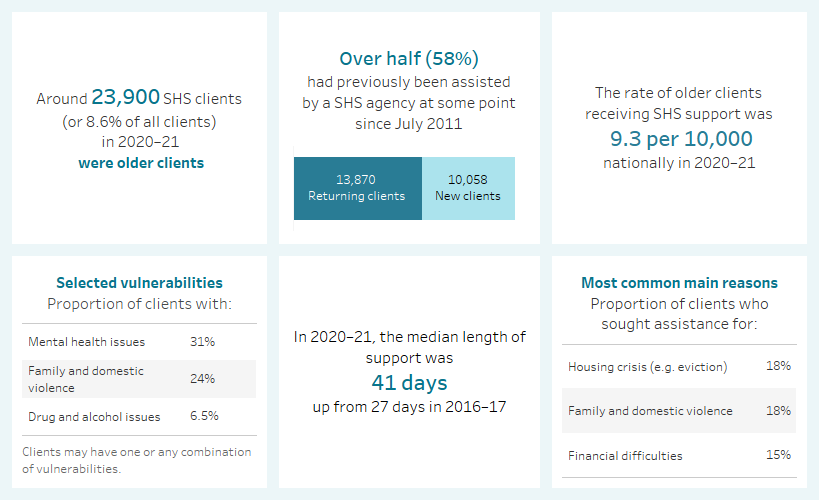
This interactive image describes the characteristics of around 23,900 older clients who received SHS support in 2020–21. Most were female, aged 55–64. Around one in six were Indigenous. Victoria had the greatest number of clients and the Northern Territory had the highest rate of clients per 10,000 population. The majority of clients had previously been assisted by a SHS agency since July 2011. Most were at risk of homelessness at the start of support. Most were in major cities.

In 2020–21 (Supplementary tables OLDER.1, CLIENTS.1 and Historical table HIST.OLDER):
- SHS agencies assisted nearly 24,000 clients aged 55 and over. Since 2016–17, the number of clients aged 55 and over has risen by nearly 1,500 clients.
- Older clients represented 8.6% of all SHS clients, which has been relatively stable since 2016–17.
- The rate of older clients was 9.3 per 10,000 Australian population in 2016–17 and again in 2020–21.
- The age specific rate of service use among older Australians was 52.0 clients per 10,000 population for those aged 55–64 and 20.1 per 10,000 for those aged 65 and over.
Labour force
- In 2020–21, the majority of older clients were not in the labour force (53%). Around two fifths (41%) were unemployed (that is, seeking work) and 6.7% were employed (Supplementary table OLDER.6).
- Of the older clients with known labour force status, female clients were more likely to be employed part-time (5.3% of all female older clients) than males (2.2%). Male clients (44%) were more likely to be unemployed than females (38%).
Living arrangements
In 2020–21, of the almost 21,900 clients with known living arrangement upon presentation to a SHS agency (Supplementary table CLIENTS.41):
- most (13,400 clients) were living alone; higher for males (71% of older male clients) than females (53%)
- more than 1 in 10 (12% or 2,600 clients) were living as a lone parent or couple with children
- over 2,700 people (12%) were living with other family which can include a person with or without children living (as a couch surfing arrangement) with others.
Selected vulnerabilities
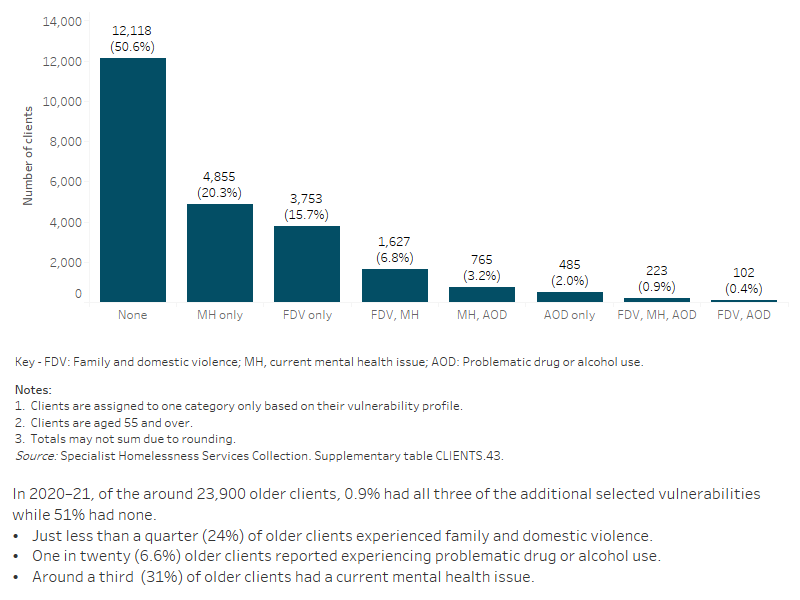
The majority of older clients (51% or 12,100) did not have additional vulnerabilities (that is, a current mental health issue, experiencing family and domestic violence, or problematic drug and/or alcohol use) (Figure OLDER.2, Supplementary table CLIENTS.43).
Figure OLDER.2: Older clients, by selected vulnerability characteristics, 2020–21
Service use patterns
The length of support older clients received increased in 2020–21 to a median of 41 days, up from 27 days in 2016–17. The average number of support periods per client however has remained consistent over time from an average of 1.5 support periods per client in 2016–17 to 1.6 in 2020–21. The proportion of clients receiving accommodation increased, from 17% of older clients in 2016–17 to 20% in 2020–21, while the median number of nights accommodated decreased from 30 to 24 (Supplementary table CLIENTS.44).
New or returning clients
More than half (58% or 13,900) of older SHS clients were returning clients, having previously been assisted by a SHS agency at some point since the collection began in July 2011 (Supplementary table CLIENTS.38). Most (69%) returning clients were aged 55–64; 31% were aged 65 and over. Of the new clients, 59% were aged 55–64.
Main reasons for seeking assistance
The 3 main reasons older clients sought assistance from SHS agencies in 2020–21 were (Supplementary table OLDER.4):
- housing crisis (18% or 4,300 clients)
- family and domestic violence (18% or 4,200)
- financial difficulties (15% or 3,500).
The main reason older clients sought assistance was different for those experiencing homelessness compared with those presenting to services at risk of homelessness (Supplementary table OLDER.5).
- For those experiencing homelessness the main reasons for seeking assistance were:
- inadequate or inappropriate dwelling conditions (25% or over 1,900 clients)
- housing crisis (24% or over 1,800)
- financial difficulties (7.8% or 600).
- For those at risk of homelessness:
- family and domestic violence (20% or 2,800 clients)
- housing crisis (17% or 2,500).
- financial difficulties (17% or 2,400).
Services needed and provided
In 2020–21, over half (52% or 12,400) of older SHS clients needed accommodation, of those 38% were provided with some type of accommodation assistance and a further 23% were referred to another agency for this type of support. Demand was highest for long-term accommodation (40% or 9,400 needed long-term accommodation) compared with medium-term (22% or 5,200) and short-term or emergency accommodation (28% or 6,600). Of the older clients who needed long-term housing, less than 7% were provided this type of assistance (Figure OLDER.3, Supplementary table OLDER.2).
Other services most commonly needed by older clients during 2020–21 were:
- assistance to sustain tenancy or prevent tenancy failure or eviction (34%), with 84% provided this assistance
- material aid/brokerage (31%), with 88% provided this assistance
- financial information (18%), with 84% provided with assistance.
Figure OLDER.3: Older clients, by services needed and provided, 2020–21
This interactive stacked horizontal bar graph shows the services needed by older clients and their provision status. Long term housing was the most needed and least provided service. Assistance to sustain tenancy or prevent tenancy failure or eviction was the most provided service.

This interactive Sankey diagram shows the housing situation (including rough sleeping, couch surfing, short term accommodation, public/community housing, private housing and Institutional settings) of older clients with closed support periods at first presentation and at the end of support. The diagram shows clients’ housing situation journey from start to end of support. Most clients started and ended support in private housing.
