Surgery in Australia's hospitals
In 2017–18:
- 1 in 4 (24%) hospitalisations involved surgery (2.7 million)
- 59% of these occurred in private hospitals.
Emergency surgery
An emergency admission involving surgery is a hospitalisation that included a surgical procedure, and for which the patient required admission within 24 hours.
In 2017–18:
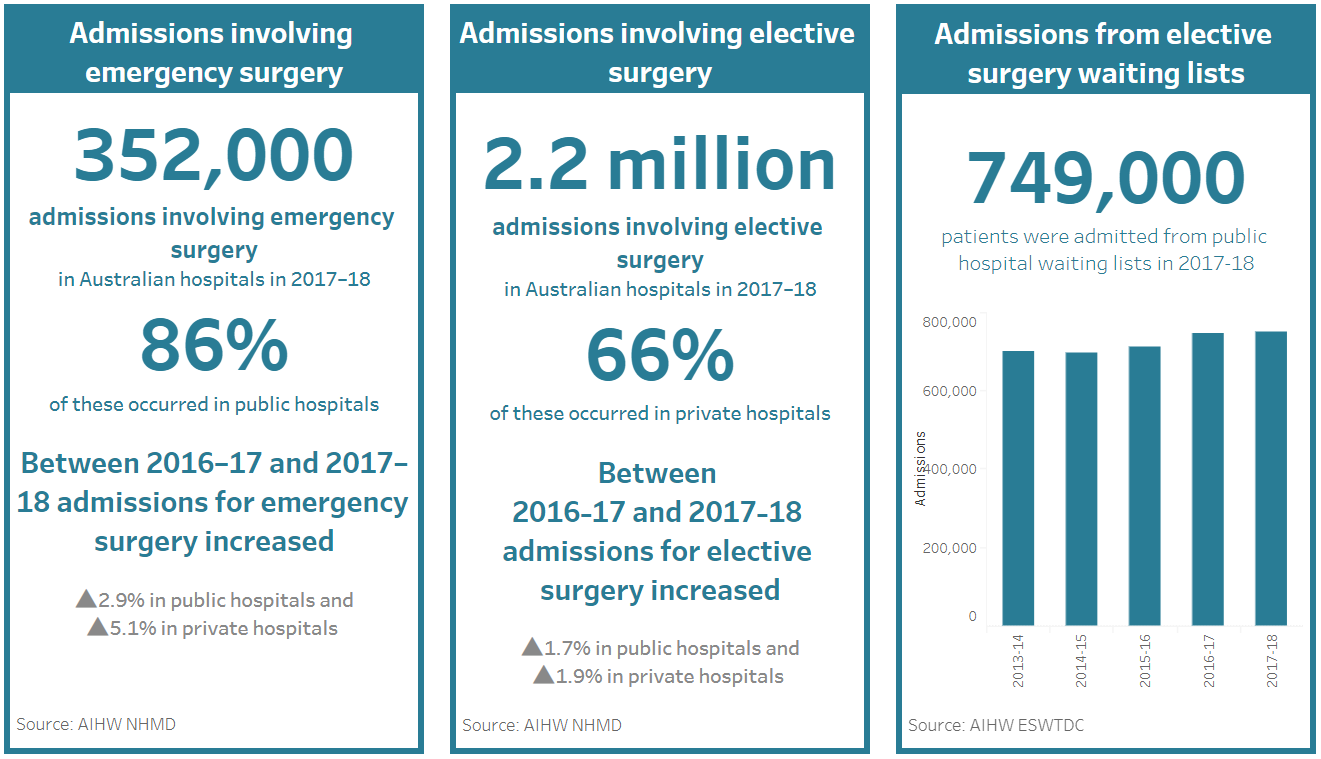
- 352,000 emergency admissions involved surgery, with 86% of these occurring in public hospitals
- people living in Very remote areas were twice as likely to have an emergency admission involving surgery as people living in Major cities
- the 3 most common reasons for emergency admissions involving surgery were appendicitis, hip fracture (fracture of femur) and heart attack (acute myocardial infarction).
Between 2013–14 and 2017–18, emergency admissions involving surgery increased by an average of 2.9% each year for public hospitals and by 5.1% each year for private hospitals.
Elective surgery
An elective admission involving surgery is a hospitalisation that included a surgical procedure, and for which the admission could be delayed.
In 2017–18:
- there were over 2.3 million elective admissions involving surgery, with 66% of these occurring in private hospitals
- people living in Very remote areas were least likely to have an elective admission involving surgery
- the 3 most common reasons for elective admissions involving surgery were cataracts, malignant skin lesions and other retinal disorders.
Between 2013–14 and 2017–18, elective admissions involving surgery rose by an average of 1.7% each year—1.9% in public hospitals and 0.9% in private hospitals.
See the data visualisation below for more information about waiting times for elective surgery.
How many patients were admitted from public hospital elective surgery waiting lists?
In 2017–18, about 749,000 patients were admitted from public hospital elective surgery waiting lists.
Between 2013–14 and 2017–18, the number of admissions from public hospital elective surgery waiting lists increased by an average of 1.7% each year.
Performance indicator: Waiting times for elective surgery
Waiting times for elective surgery are an indicator of the provision of timely care.
In 2017–18:
- public patients made up 90% of admissions from public hospital elective surgery waiting lists and 50% of these were admitted within 40 days
- private health insurance-funded patients made up 7% of admissions and 50% of these were admitted within 22 days
- patients with cancer-related principal diagnoses had shorter waiting times (50% admitted within 21 days) compared with patients overall (50% admitted within 41 days)
- 1.8% of patients waited more than 1 year.
Between 2013–14 and 2017–18, the number of days within which 50% of patients were admitted (the median waiting time) increased from 36 days to 40 days.
Data visualisation of elective surgery waiting times by indicator procedure 2013-14 to 2017-18

Where to go for more information
For more information on admissions involving surgery, see Chapter 6 of Admitted patient care 2017–18: Australian hospital statistics.
For more information on waiting times for elective surgery, see the Waiting times section of Elective surgery waiting times 2017–18: Australian hospital statistics and Chapter 6 of Admitted patient care 2017–18: Australian hospital statistics.