Emergency department services
Emergency departments provide care for patients who may have an urgent need for medical, surgical or other care. This section relates to emergency department services provided by public hospitals.
Between 2013–14 and 2017–18, the number of patients presenting to public hospital emergency departments increased by 2.7% on average each year.
In 2017–18:
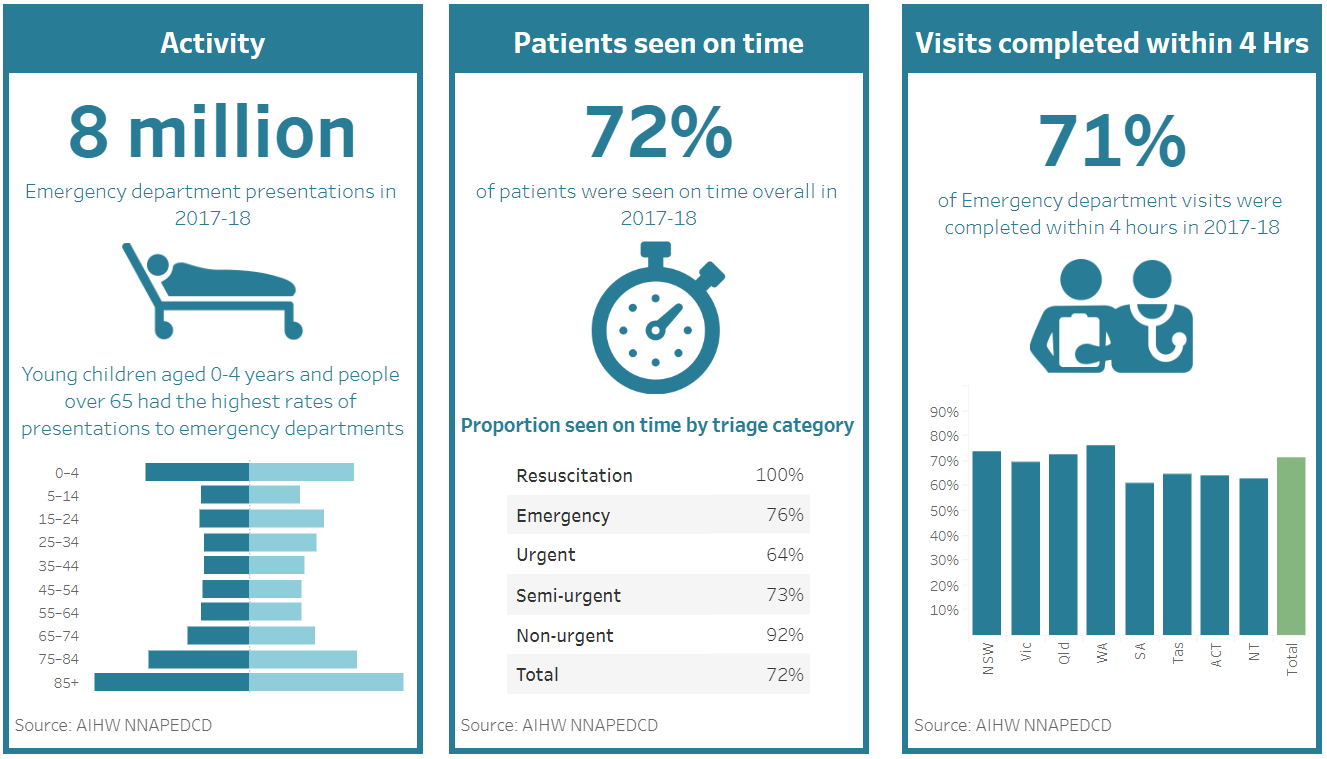
- there were 8.0 million emergency department presentations—over 22,000 presentations each day
- for patients aged 0 to 14, more boys than girls presented to emergency departments (56% and 44%, respectively)
- patients aged 4 and under (11%) and patients aged 65 years and over (22%) were over-represented in emergency department presentations, compared with the overall population
- 25% of patients arrived by ambulance, air ambulance or helicopter rescue service.
How urgently did patients require care or treatment?
On arrival at the emergency department, patients are assigned a triage category of either:
- Resuscitation (should be seen immediately)
- Emergency (within 10 minutes)
- Urgent (within 30 minutes)
- Semi-urgent (within 60 minutes)
- Non-urgent (within 2 hours).
In 2017–18, 51% of patients were assigned to the 3 most urgent triage categories, ranging from 40% for patients aged 5 to 14 to 67% for patients aged 95 and over.
Performance indicator: Waiting times for emergency hospital department care—proportion seen on time
Overall, the proportion of emergency patients that were seen on time decreased from 75% in 2013–14 to
72% in 2017–18.
Almost 100% of Resuscitation patients were seen immediately (within 2 minutes), 76% of Emergency patients were seen within 10 minutes, and 92% of Non-urgent patients were seen within 2 hours.
In 2017–18, the overall proportion seen on time ranged from 49% in the Australian Capital Territory to 80% in New South Wales.
How long did patients spend in the emergency department?
In 2017–18, most emergency department patients went home after being treated (61%) and almost a third of emergency patients (31%) were admitted to hospital for further care.
Performance indicator: Waiting times for emergency hospital department care—proportion completed within 4 hours
Between 2013–14 and 2017–18, the proportion of presentations completed within 4 hours (for example, the patient was discharged or admitted) decreased from 73% to 71%.
In 2017–18, the proportion of presentations completed within 4 hours ranged from 61% in South Australia to 76% in Western Australia.
How was care completed?
Most patients who go to the emergency department go home after treatment, but almost a third of patients (31%) were admitted to hospital for further care.
In 2017–18, about 75% of Resuscitation patients were subsequently admitted, compared with 5% of Non-urgent patients.
Performance indicator: Admission to hospital from emergency departments
For emergency patients who are subsequently admitted, the length of stay indicates the amount of time spent in the emergency department before being moved to another ward in the hospital.
Between 2013–14 and 2017–18, the proportion of emergency patients subsequently admitted to hospital within 4 hours increased from 45% to 49%.
Over the same period, the 90th percentile time to admission was relatively stable at around 11 hours.
See the visualisation below for more information on the proportion of patients whose length of stay was 4 hours or less.
Where to go for more information
For more information on emergency department waiting times, see the Waiting times section of Emergency department care 2017–18: Australian hospital statistics.
For more information on how long patients stayed in emergency departments, see the Length of stay section of Emergency department care 2017–18: Australian hospital statistics.