Priority groups and wait lists
Historically, the focus of housing assistance has been to provide support to low-income families. However, the provision of housing assistance has shifted over time to target a highly diverse range of vulnerable groups, such as people experiencing or who are at imminent risk of homelessness; households where there is a member with disability; households where the main tenant is aged under 25 or aged over 75; or Indigenous households.
Quick facts
- In 2016–17, around three in four (73%) newly allocated households in public rental housing and over four in five (86%) in community housing were provided to those in greatest need.
- Over half (53%) of greatest needs households reported being homeless prior to commencing their public housing tenancy in 2016–17. Of all households commencing public housing tenancy, 37% were previously homeless.
- Over half (51%) of newly allocated public housing households were single people living alone.
- Social housing households in ‘greatest need’ spent less time on waiting lists, with more than two in five (45%) of newly allocated public rental housing households and almost two thirds (64%) of newly allocated SOMIH households allocated housing in less than 3 months.
Greatest need
Social housing is allocated on a priority needs basis. Public rental housing, state-owned and managed Indigenous housing (SOMIH) and mainstream community housing prioritise households by assessing their greatest need status (see below).
Assessing greatest need
Greatest need applies to low-income households if, at the time of allocation, household members were subject to one or more of the following circumstances:
- they were experiencing homelessness
- they were at risk of homelessness, including:
- their life or safety was threatened within existing accommodation
- a health condition was exacerbated by existing accommodation
- their existing accommodation was inappropriate to their needs
- they were experiencing very high rental costs.
Source: [3].
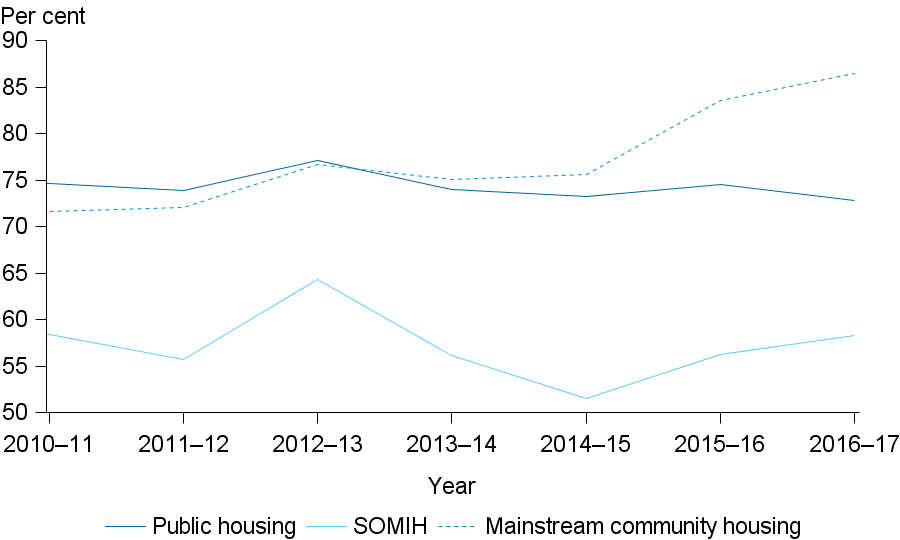
Housing prioritisation is particularly evident for public rental housing, with around three in four newly allocated dwellings provided to households in greatest need (73%) in 2016–17, a relatively small decrease from 75% in 2010–11 (Figure 6.1). For SOMIH, six in ten (58%) newly allocated dwellings were provided to households in greatest need in 2016–17, the same as 58% in 2010–11, but down from a peak of 64% in 2012–13.
New mainstream community housing allocations to households in greatest need have increased, from 72% in 2010–11 to 86% in 2016–17.
Figure 6.1: Newly allocated households(a) in greatest need(b) (per cent), by housing program type, 2010–11 to 2016–17
- Whether the household was a new allocation for housing assistance in the financial year.
- A descriptor applying to a low-income household if, at the time of allocation, household members were subject to one or more circumstances (refer to description above for more information).
Notes:
- Excludes SOMIH data for the NT as only selected information are submitted as final aggregate data for the SOMIH data collection. Greatest needs information is not available for Tasmania.
- Mainstream community households in Qld are reported as at 30 June of the financial year.
Source: AIHW National Housing Assistance Data Repository. See supplementary table PRIORITY.1.
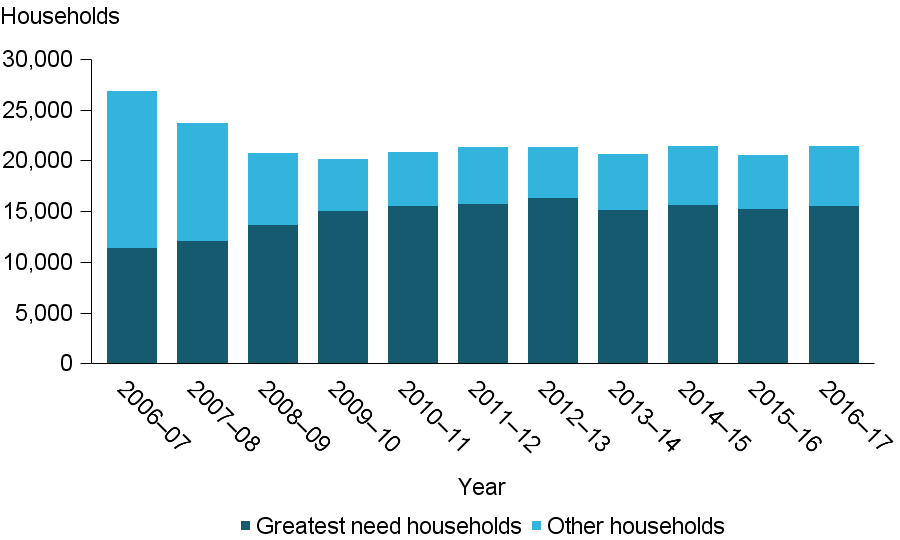
For public housing, whilst the number of new allocations to households in greatest need has been rising over the past 10 years (from 11,500 in 2006–07 to 15,600 in 2016–17), the total number of new household allocations has decreased by 20%; from 26,800 households to 21,400 in 2016–17 (Figure 6.2).
Figure 6.2: Number of newly assisted(a) greatest need and other(b)(c) households in public housing, 2006–07 to 2016–17
- Whether the household was a new allocation for housing assistance in the financial year.
- All newly assisted households excluding greatest need households (refer to description above for more information).
- Household groups are mutually exclusive. A 'greatest need' household will not be counted within 'other' households.
Source: AIHW National Housing Assistance Data Repository. See supplementary table PRIORITY.8.
Of all newly allocated greatest needs households in social housing, the majority were assisted because they were either homeless, or at risk of homelessness. However, these proportions have varied over time.
For public rental housing, one half (53%, or 7,800) of newly allocated households (Table 6.1; excluding not stated) were provided to households experiencing homelessness in 2016–17, down from a peak of 60% (or 9,100) in 2013–14. The proportion of newly allocated households who were at risk of homelessness in public rental housing has remained relatively steady between 2011–12 and 2015–16, with an increase to 38% in 2016–17 (Table 6.1).
For SOMIH households, 43% (or 180) of newly allocated households were provided to the homeless in 2016–17, a decrease from a peak of 53% (or 240) in 2015–16. The proportion of newly allocated households for those at risk of homelessness was 43% (or 180) in 2016–17, down from a peak of 48% (or 210) in 2014–15.
For mainstream community housing, almost 4,200 (45%) of newly allocated households were provided to the homeless in 2016–17, up from 3,100 in 2013–14. The number of newly allocated households for those at risk of homelessness was 5,000 (55%) in 2016–17, an increase from 3,400 in 2013–14. Complete data on newly allocated greatest needs mainstream community housing households are not currently available due to data quality issues.
Table 6.1: Number of newly allocated households(a) in greatest need(b), by main reason for greatest need, by social housing program, 2011–12 to 2016–17
|
Year |
Homeless |
Total at risk of homelessness |
Other |
Not stated(e) |
Total new greatest need households |
|
Public housing |
|||||
|
2011–12 |
8,602 |
5,680 |
1,154 |
350 |
15,786 |
|
2012–13 |
9,130 |
5,632 |
1,310 |
339 |
16,411 |
|
2013–14 |
9,058 |
5,248 |
600 |
283 |
15,256 |
|
2014–15 |
8,950 |
5,185 |
1,114 |
421 |
15,670 |
|
2015–16 |
8,122 |
4,827 |
661 |
1,662 |
15,272 |
|
2016–17 |
7,836 |
5,675 |
1,240 |
818 |
15,569 |
|
SOMIH(c) |
|||||
|
2011–12 |
219 |
185 |
69 |
0 |
431 |
|
2012–13 |
262 |
262 |
73 |
1 |
552 |
|
2013–14 |
209 |
187 |
17 |
6 |
436 |
|
2014–15 |
204 |
210 |
43 |
0 |
439 |
|
2015–16 |
235 |
180 |
37 |
4 |
449 |
|
2016–17 |
179 |
181 |
52 |
1 |
419 |
|
Mainstream community housing(d) |
|||||
|
2011–12 |
n.a. |
n.a. |
n.a. |
n.a. |
n.a. |
|
2012–13 |
n.a. |
n.a. |
n.a. |
n.a. |
n.a. |
|
2013–14 |
3,056 |
3,435 |
n.a. |
2,816 |
9,307 |
|
2014–15 |
3,527 |
4,221 |
n.a. |
2,999 |
10,747 |
|
2015–16 |
4,264 |
4,359 |
n.a. |
2,472 |
11,095 |
|
2016–17 |
4,189 |
5,025 |
n.a. |
1,681 |
10,895 |
n.a. not applicable
- Whether the household was a new allocation for housing assistance in the financial year.
- A descriptor applying to a low-income household if, at the time of allocation, household members were subject to one or more circumstances (refer to description above for more information).
- Excludes data for the NT as only selected information are submitted as final aggregate data for the SOMIH data collection. Greatest needs information is not available for Tasmania.
- Includes greatest need households where the homeless indicator was known. Detailed information on greatest need reasons is not available for mainstream community housing. Qld provides partial unit record household data. Household unit record data are not provided for the NT.
- Where the greatest need reason is unknown or not provided.
Note: Where more than one greatest need category applied to a household, the main reason is shown.
Source: AIHW National Housing Assistance Data Repository. See supplementary table PRIORITY.S5.
Special needs
Households that are in greatest need often have members with special needs. These include households with a member with disability, a main tenant younger than 25 or older than 75, or households defined as Indigenous households.
However, as SOMIH is an Indigenous-targeted program, Indigenous households in SOMIH are not considered special needs households. For SOMIH households, only those that have a member with disability or a main tenant under 25 or over 50 are considered special needs.
In 2016–17, the proportion of new allocations with special needs differed across social housing programs:
- Of newly allocated public housing households with special needs, over half (55%) contained at least one member with disability.
- Around one-third (38%) of newly allocated public housing households with special needs contained at least one Indigenous member. Almost one quarter (24%) had a main tenant aged under 25.
- Newly allocated SOMIH households with special needs were most likely to contain at least one member with disability (41%) or have a main tenant aged under 25 years (47%) (See supplementary table PRIORITY.3).
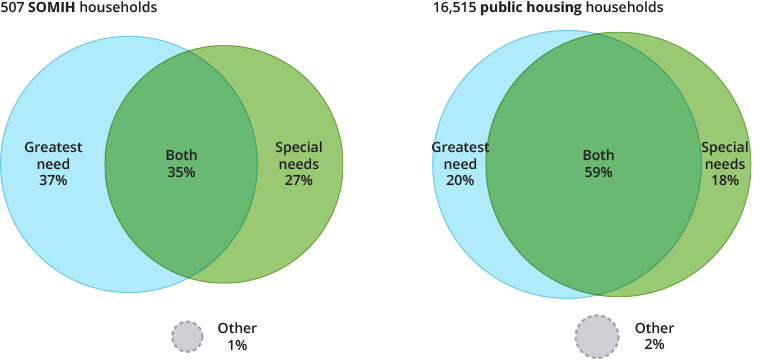
Special needs and greatest needs categories are not mutually exclusive, and tenants may fit into a number of categories within each group or across groups (Figure 6.3)
Figure 6.3 : Newly allocated(a) public housing and SOMIH households in greatest need and special needs, 2016–17
- Whether the household was a new allocation for housing assistance in the financial year.
Notes
- Proportions exclude cases where household ‘greatest need’ or ‘special need’ status was unknown.
- Some percentages may not equal 100 due to rounding.
Source: AIHW National Housing Assistance Data Repository. See supplementary table PRIORITY S.4.
Demographics of newly allocated households
Household composition
In 2016–17, of around 21,400 households in new public housing allocations, just over half (51%) were made up of single people living alone, followed by sole parents with dependent children (25%). New public housing allocations were less likely to be couple–only households or couple with dependent children households (both 4%).
The 720 newly allocated SOMIH households were most likely to have comprised sole parents with dependent children (60%), followed by single adults (17%). These SOMIH households were also least likely to be couple–only households (2%).
Indigenous and disability status
Newly allocated households in both public housing and SOMIH were more likely than ongoing households to be Indigenous. They were also more likely than ongoing households to have at least one member with disability.
For newly allocated households to public rental housing in 2016–17, around 5,000 were Indigenous households (29% of all new allocations). One in two (50%) or 7,300 households, had at least one member living with disability.
Of new allocations to SOMIH, about one third (32%) went to households with at least one member living with disability. One in five (21%) of new SOMIH allocations were provided to households where the main tenant was aged under 25 years.
Wait lists and wait times
Nationally, as at 30 June 2017, there were:
- 142,500 applicants awaiting public rental housing allocation (down from 159,000 in 2013)
- 8,100 applicants waiting for allocation to SOMIH dwellings (down from 9,000 in 2013)
- 38,300 applicants awaiting allocation to mainstream community housing (down from 49,600 in 2013) (See supplementary table PRIORITY.5).
It is important to note that applicants may be on more than one waitlist, and as such, these numbers may be an overestimate of the total. Across these three social housing programs, around 59,400 of these applicants were categorised as being in greatest need.
Fluctuations in the numbers of those on wait lists are not necessarily measures of changes in underlying demand for social housing. A number of factors may influence the length of wait lists including changes to allocation policies, priorities and eligibility criteria put in place by state/territory housing authorities. Further, some people who wish to access social housing may also not apply due to the long waiting times or lack of available options in their preferred location.
Regarding social housing allocations, there are often limited choices for new entrants into the social housing system in regards to selection of dwelling type and location. Tenant choices are often limited to broad geographic areas and/or types of dwellings. For example, public rental housing tenants often are given a limited number of offers at the time of allocation and if refused, they may risk their place on the waiting list.
Wait list priority is generally given to greatest need or special needs households. Where waiting list time was known, nearly 3 in 4 (74%) new allocations for public housing and nearly three-fifths (59%) of new allocations for SOMIH went to those in greatest need in 2016–17. This proportion was lower for special needs households, with over two fifths (61%) of new allocations for public housing and almost half (46%) for SOMIH (See supplementary table PRIORITY.6).
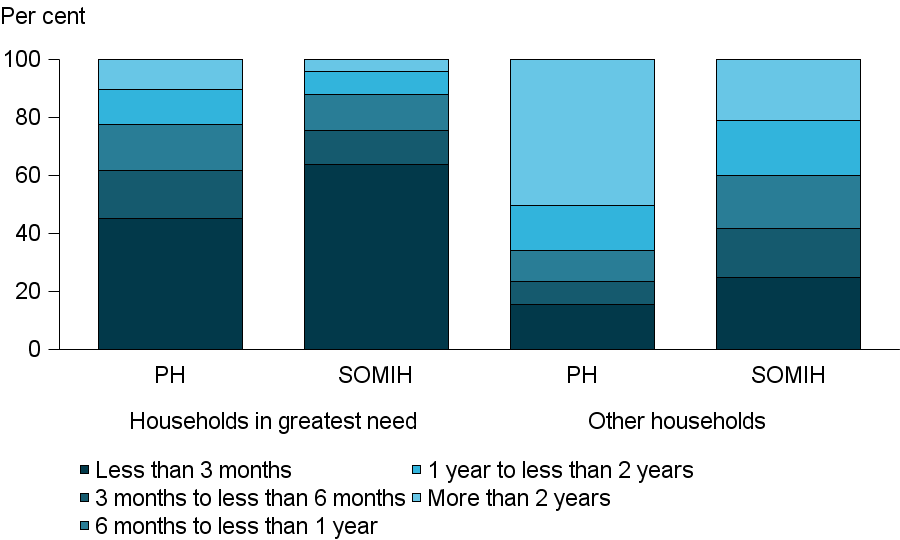
Newly allocated households in greatest need are less likely than other households to spend an extended period of time on social housing waiting lists. In 2016–17, more than two-fifths (45%) of newly allocated public housing households and almost two thirds (64%) of SOMIH households in greatest need spent less than 3 months on waiting lists (Figure 6.3). This compares to just 15% of public housing households and a quarter (25%) of SOMIH households not in greatest need spending less than 3 months on social housing waiting lists.
For mainstream community housing, data on allocations by the amount of time spent on the waiting list are not currently available.
Figure 6.4: New allocations(a) for greatest needs(b) and other households (per cent), by time spent on the waiting list(c), by social housing program, 2016–17
- Whether the household was a new allocation for housing assistance in the financial year.
- A descriptor applying to a low-income household if, at the time of allocation, household members were subject to one or more circumstances (see Figure 6.4 for more information).
- Data include only households with known waiting time.
Source: AIHW National Housing Assistance Data Repository. See supplementary table PRIORITY.7.
Specialist Homelessness Services and social housing
Specialist Homelessness Services (SHS) play a key role in helping vulnerable people to obtain or maintain social housing [2]. Social housing provides the best solution to homelessness for many who approach SHS agencies. SHS agencies provide support through the delivery of services to prepare clients prior to commencing social housing tenancies, and often through ongoing support to ensure these tenancies are able to be maintained.
Of the clients who were assisted by SHS agencies and ended support in 2016–17, 15% (25,700 clients) were living in public or community housing at presentation [1]. At the conclusion of SHS support, the proportion of clients living in public or community housing increased to 22% (37,300 clients).
Public housing was allocated to the homeless, including those sleeping rough (no shelter or living in improvised or inadequate dwellings), couch surfers (living in a house with no tenure) and those in supported accommodation (short–term temporary accommodation). Figure 6.5 shows the proportion of SHS clients who ended support housed in public or community housing in 2016–17. Over one in ten (11%) clients who started SHS support as homeless and sleeping rough ended their support in public or community housing. Almost one in five (19%) were living in short-term/temporary accommodation, and over one in ten (13%) were couch surfing (For further information about housing situations please see the Glossary).
The vast majority (86%) of the SHS clients who started their support in public or community housing were assisted by a SHS agency to maintain their existing tenancy. This suggests that the SHS support provided to clients currently in a public or community housing tenancy assisted them to maintain that tenancy and prevent a potential episode of homelessness. The main reason for public housing tenants to seek SHS assistance was generally due to financial difficulties (e.g. the tenant didn't have the financial means to pay their rent, bills, food and/or other household essentials) [1].
Figure 6.5: Specialist Homelessness Services (SHS) clients(a) housed in public or community housing at the end of support (per cent), by housing situation at first presentation, 2016–17
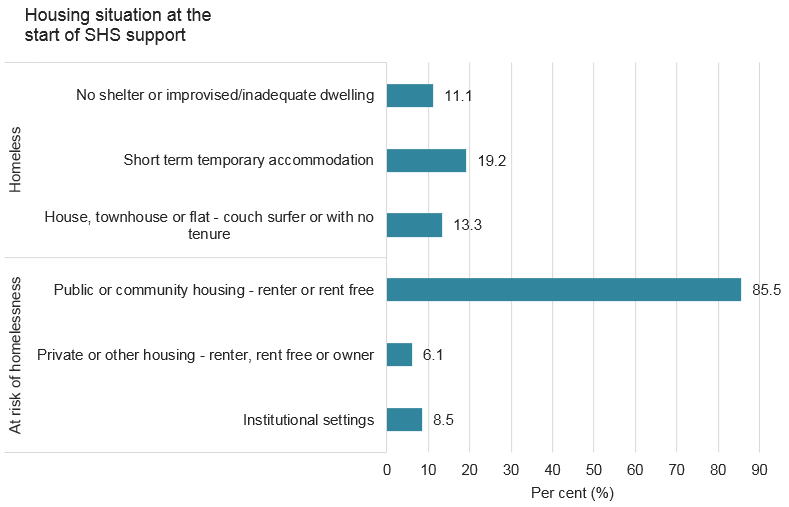
Notes
- All clients of specialist homelessness services are either homeless or at risk of homelessness. 'Homeless' status is derived for a client based on the client's housing circumstances at the beginning of their first support period. All other clients not meeting these criteria are considered to be at risk of homelessness (excluding clients who did not provide sufficient information to make this assessment). Housing circumstances are determined based on the client's type of residence, tenure, and conditions of occupancy.
- Per cent calculations based on total clients at first presentation less 'Not stated/other'.
Source: [1]. See supplementary table CLIENTS.22.
References
- AIHW (Australian Institute of Health and Welfare) 2017. Specialist Homelessness Services 2016–17. Canberra: AIHW.
- AIHW 2015. Exploring transitions between homelessness and public housing: 1 July 2011 to 30 June 2013. Cat. No. HOU 277. Canberra: AIHW.
- SCRGSP (Steering Committee for the Review of Government Service Provision) 2018. Report on Government Services 2017. Productivity Commission. Canberra: PC.