Social housing tenants
In 2016–17, there were around 812,900 tenants in social housing. The majority of these tenants remained in social housing throughout the year, while some transferred between programs and others exited.
Quick facts
- In 2016–17, there were around 812,900 tenants in social housing, with the majority (79%) of these in public rental housing.
- At 30 June 2017, a total of 396,100 households made up Australia’s main social housing programs (public rental housing, state owned and managed Indigenous housing (SOMIH) and mainstream community housing).
- The number of households in community housing has more than doubled (up 117%) from around 35,000 in 2007–08 to 76,000 in 2016–17.
- Across all social housing programs, a greater proportion of main tenants were women (62%), while the largest proportion of households were single adults (55%).
- Older persons aged 55 and over and children under 15 years continue to dominate tenant demographics; 34% older persons in public rental housing, 29% in community housing; and 38% were children in SOMIH.
- Four in ten public housing tenants had been in their tenancies for over 10 years.
Social housing includes all rental housing owned and managed by government or non-government organisations (including not-for-profit organisations) which can be let to eligible households. Social housing rents are generally set below market levels and are influenced by the income of the household.
Over recent years, social housing has increasingly been allocated to households with complex needs, such as to those living with disability and those on very low incomes and the homeless. At 30 June 2017, there were around 396,100 households in social housing, with the majority in public rental housing (310,500), 9,600 in state-owned and managed Indigenous housing (SOMIH) and 76,000 in community housing. Household estimates are not available for the Indigenous Community Housing program (ICH) data collection.
Tenants in social housing
In 2016–17, there were around 812,900 tenants in social housing in Australia (complete data were not available for all programs in Queensland and the Northern Territory). Of these tenants, 79% or around 638,800 were in public housing; 4% or around 30,400 were in SOMIH; and, 18% or around 143,700 were in community housing.
Females made up the majority of tenants across all social housing programs, including 347,600 (56%) in public housing, 17,000 (57%) in SOMIH, and 77,900 (55%) in mainstream community housing.
In 2016–17, large proportions of social housing tenants are also either older persons aged 55 years and over (34% for public rental housing and 29% for community housing) or children aged under 15 years (See supplementary table TENANTS.7; Figure 3.1). Almost a quarter (22%) of public rental housing, 38% of SOMIH and 20% of mainstream community housing tenants were children aged 0–14 years old.
Figure 3.1: Social housing tenants, by age, sex and social housing program, 2016–17(a)
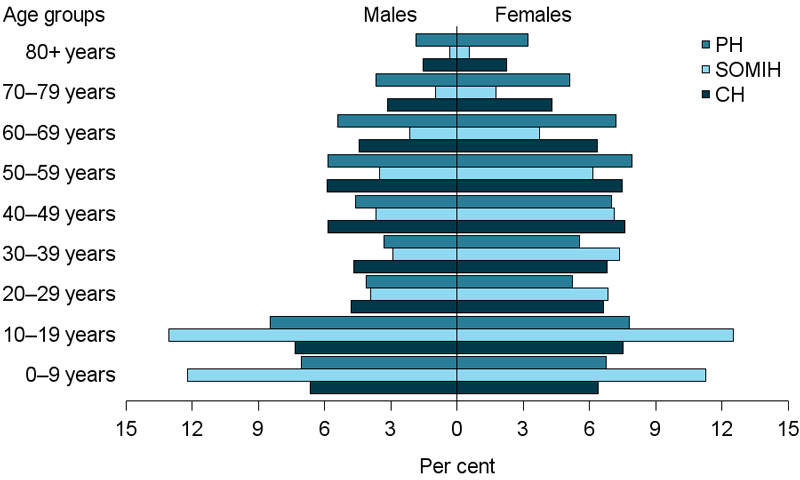
- Figure includes tenants who ceased receiving assistance during the reference year.
Notes
- Total excludes tenants where age or sex are not stated: 14,406 (Public housing), 729 (SOMIH) and 3,097 (Mainstream community housing).
- Percentages are calculated using the total males and females for each program as the denominator.
-
Data on the number of Indigenous community housing tenants were not available due to issues relating to data completeness and coverage.
Source: AIHW National Housing Assistance Data Repository. See supplementary table TENANTS.7.
Households in social housing
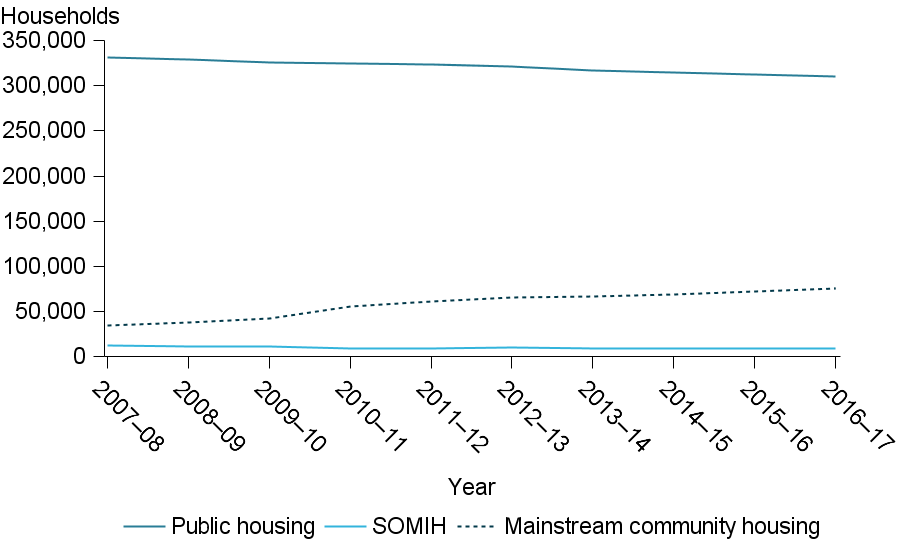
The number of public rental housing households has decreased from 331,100 in 2007–08 to around 310,500 in 2016–17 (a 6% fall). SOMIH household numbers have also fallen during this time, from 12,400 to 9,600 (a fall of 23%).
In contrast, over the same period, the number of community housing households has more than doubled. Between 2007–08 and 2016–17, the number of community housing households increased from 35,000 to 76,000 (a rise of 117%), with an increase of 5% in the last 12 months (Figure 3.2).
Figure 3.2: Number of social housing households, 2007–08 to 2016–17
Notes
- Data on the number of Indigenous community housing households were not available due to issues relating to data completeness and coverage.
- Data may not be comparable over time and comparisons could be misleading. Refer to the Explanatory Notes for further information.
Source: AIHW National Housing Assistance Data Repository. See supplementary table TENANTS.1.
These changes reflect a gradual but steady shift of policy focus towards growing the community housing sector and transferring ownership or management of public rental housing stock to community housing organisations. The decrease in the number of public rental households over time has been offset by an increase in community housing households. The shift in the distribution of housing stock reflects strategies to grow the community sector, as community housing can potentially provide more flexible and innovative affordable housing options [1].
Of the 396,100 households living in social housing across Australia as at 30 June 2017, over one third (36%) were located in New South Wales (Figure 3.3).
Figure 3.3: Number of social housing households, by state and territory, at 30 June 2017
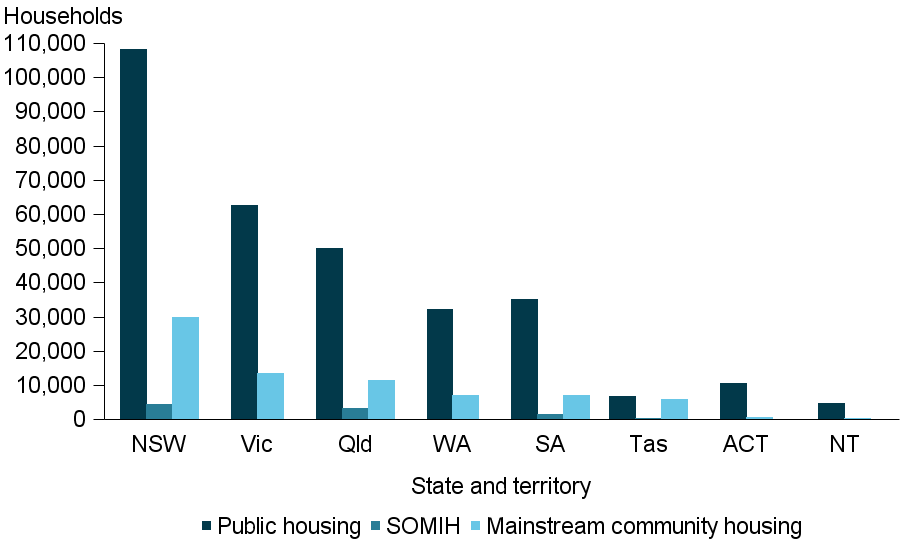
Notes
- Data on the number of Indigenous community housing households were not available due to issues relating to data completeness and coverage.
- Data may not be comparable across jurisdictions; comparisons should be made with caution.
- For state/territory-specific data quality issues, refer to the Explanatory notes.
Source: AIHW National Housing Assistance Data Repository. See supplementary table TENANTS.2.
Across remoteness areas, 72% of all social housing households were located in Major cities, followed by 17% in Inner regional areas, 9% in Outer regional areas, 2% in Remote areas and 1% in Very remote areas (See supplementary table TENANTS.3).
Tenant demographics
At 30 June 2017, almost two-thirds (62%) of main tenants in social housing were female, and almost one-third (32%) of main tenants were aged 65 years or older. Over 1 in 10 (12%) households included an Indigenous member, and almost 2 in 5 (39%) households reported having a tenant with a disability. Household composition was also most likely to be in the form of single adults (55%) (See supplementary table TENANTS.4). Although, the proportions in these groups vary across the different social housing programs.
Figure 3.4 is an interactive data visualisation, which highlights selected characteristics of ongoing main social housing tenants and households by social housing program. Scroll over the Figure for additional information relating to each component.