Overcrowding and underutilisation
A large part of providing affordable housing that suits individuals and families is ensuring that a dwelling is of an adequate size and configuration to meet the needs of the household. However, ensuring the best fit between dwelling and household requirements is not a straightforward process. It is influenced by the availability of dwellings and dwelling configuration, as well as the age, condition and location of the property. This is in addition to the availability of options and specific household requirements (such as disability modifications), and the cost to relocate existing tenants, as well as their willingness to relocate.
Quick facts
- At 30 June 2017, 4% of public rental housing, 4% of community housing and 24% of state owned and managed Indigenous housing (SOMIH) were considered to be overcrowded.
- Overcrowding was highest in the Northern Territory for public housing and SOMIH (7% and 56%, respectively); and for mainstream community housing in New South Wales (7%).
- At 30 June 2017, 17% of public rental housing, 26% of SOMIH and 7% of mainstream community housing were considered to be underutilised.
- Underutilisation was highest in South Australia (26% of public rental housing, 31% for SOMIH and 22% for community housing).
The accepted standard by which the dwelling size requirements of a given household are measured in Australia is the Canadian National Occupancy Standard, commonly referred to as CNOS (see below).
Whilst the CNOS is a useful guide to the proportion of dwellings that may be underutilised, or the proportion of households potentially living in overcrowded conditions, there are some cases where a dwelling may not match a household size for good reason. For example, where custody of children is shared; where tenants may have live-in care arrangements; or to take into consideration future needs of children who may need separate bedrooms in years to come.
Canadian National Occupancy Standard (CNOS)
A measure of the appropriateness of housing that is sensitive to both household size and composition, the CNOS specifies that:
- no more than 2 people shall share a bedroom
- parents or couples may share a bedroom
- children under 5, either of the same sex or opposite sex, may share a bedroom
- children under 18 of the same sex may share a bedroom
- a child aged 5–17 should not share a bedroom with a child under 5 of the opposite sex
- single adults 18 and over and any unpaired children require a separate bedroom.
Source: [1]
At 30 June 2017, the majority of social housing households (around 80%) were considered to be residing in dwellings adequate to their household composition (Table 5.1).
| Social housing program | Overcrowded | Adequate | Underutilised(a) | Total |
|---|---|---|---|---|
|
Public housing |
4.0 |
79.5 |
16.6 |
100.0 |
|
SOMIH(b) |
24.4 |
49.9 |
25.7 |
100.0 |
|
Mainstream community housing(c) |
4.3 |
88.5 |
7.4 |
100.0 |
- The match of dwelling size to registered tenant numbers at a point in time is affected by a range of factors including changes in family structure over time, the match of housing portfolio to demand, and tenant support needs. Housing authority allocation policies do not necessarily align with the Canadian National Occupancy Standard and may provide for additional bedrooms including in circumstances such as shared parenting, carer requirements, or expectant mothers.
- For the NT from 2016–17, overcrowding data for 5,032 remote dwellings were submitted as final aggregate data for the SOMIH data collection. This was represented in previous reports as 'remote public housing dwellings'. As such, the value for underutilisation has been revised and may not match other published figures. Please refer to the Explanatory Notes for more information.
- Qld provided partial unit record tenant data (unit record data were not available for 1,779 households). Unit record data are not provided for the NT.
Notes
- Data are based on the Canadian National Occupancy Standard and exclude households where housing utilisation was unknown:
- Overcrowding is defined as requiring one or more bedrooms to meet the standard
- Underutilisation is defined as having two or more spare bedrooms.
- Data for utilisation in Indigenous community housing were unavailable.
Source: AIHW National Housing Assistance Data Repository. See supplementary table MATCHING.1.
Overcrowding
In basic terms, overcrowding occurs when the dwelling is too small for the size and composition of the household living in it. In Australia, a dwelling requiring at least 1 additional bedroom is designated as ‘overcrowded’, underpinned by the CNOS standard described above.
At 30 June 2017, 4% of public rental housing and 4% of mainstream community housing households were in overcrowded dwellings (see Table 5.1), similar to the previous year. Indigenous households had a higher proportion of overcrowding, with 24% of SOMIH dwellings classified as overcrowded. This is around six times the rate experienced in both public and community housing dwellings. In 2016–17, over 5,000 remote dwellings in the Northern Territory were included in the SOMIH data collection. Previously these were reported as 'NT remote public housing dwellings'. This inclusion of remote public housing dwellings has resulted in a substantial increase in the national proportion of overcrowding for SOMIH in 2016–17, up from 9% in 2015–16. Excluding these dwellings in the Northern Territory, 9% of SOMIH dwellings were overcrowded in 2016–17.
Location
The proportion of households in overcrowded dwellings varied across social housing programs, jurisdictions and remoteness areas.
At 30 June 2017, the Northern Territory had the highest proportion of public housing households living in overcrowded dwellings (7%), followed by Tasmania (5%). SOMIH households in the Northern Territory experienced the highest proportion of overcrowding (56%). This is the result of the inclusion in 2016–17 of over 5,000 remote dwellings in the Northern Territory in the SOMIH data collection. The highest proportion of mainstream community households experiencing overcrowding was in New South Wales (7%) (See supplementary table OVER.2).
Overall, Indigenous households were more likely than non-Indigenous households to be living in overcrowded conditions. The higher level of overcrowding among Indigenous households may be associated with a number of factors, including cultural and social factors, higher levels of unmet demand for affordable housing, and geographical location limiting their housing options.
The proportion of Indigenous households in social housing living in overcrowded conditions generally increased with increasing remoteness. Indigenous households experiencing overcrowding in public rental housing, were more likely to be in Very remote (13%) and Remote (11%) areas than Major cities (8%). SOMIH households in Very remote (17%) and Outer regional (10%) areas were more likely to be living in overcrowded conditions than SOMIH households living in Major cities (8%) (see supplementary table OVER.3).
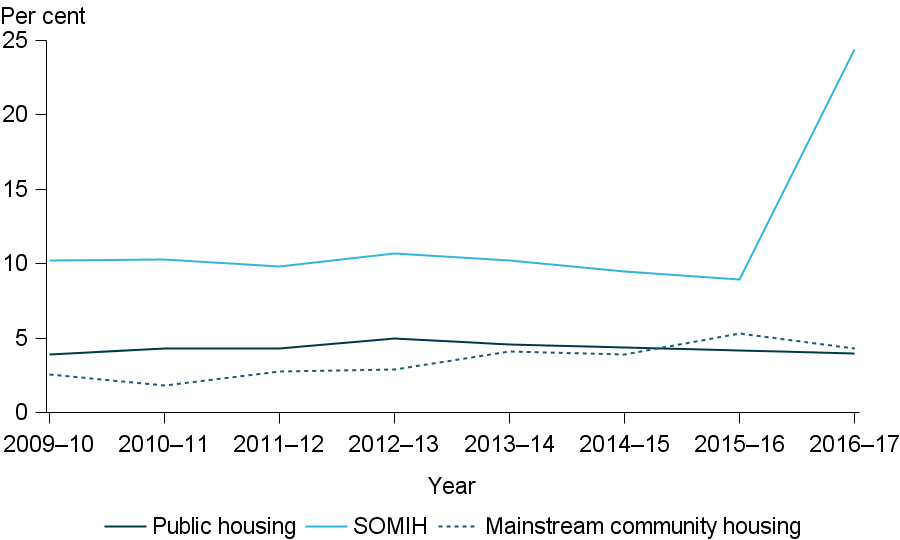
Trends
Between 2009–10 and 2016–17, the prevalence of overcrowding has varied across social housing programs (Figure 5.1). However, the proportion of SOMIH households living in overcrowded conditions has consistently remained more than double that of other social housing programs. Apart from a slight increase to 5% in 2012–13, overcrowding in public housing has remained stable at around 4% between 2009–10 and 2016–17. Overcrowding in community housing has increased from 3% to 4% between 2009–10 and 2016–17; at the same time this sector has seen considerable growth.
Overcrowding in SOMIH decreased slightly from 10% in 2009–10 to just under 9% in 2015–16. With the addition of over 5,000 remote public housing dwellings in the Northern Territory included in the SOMIH data collection in 2016–17, there has been an increase in the proportion of overcrowding, up 14 percentage points to 24% since 2009–10.
Figure 5.1: Overcrowded households in social housing (per cent), 2009–10 to 2016–17
Notes
- For the NT from 2016–17, overcrowding data for 5,032 remote social housing dwellings were submitted as final aggregate data for the SOMIH data collection. This was represented in previous reports as 'remote public housing dwellings'. Please refer to the Explanatory Notes for more information.
- Data are based on all jurisdictions except NT where data were unavailable. Qld provided partial unit record tenant data for the first time in 2015–16.
- Data are based on the Canadian National Occupancy Standard and exclude households where housing utilisation was unknown.
- Data for utilisation in Indigenous community housing were unavailable.
Source: AIHW National Housing Assistance Data Repository. See supplementary table OVER.4
Underutilisation
Just as a dwelling can be overcrowded, it can also be underutilised. A dwelling is said to be underutilised when it consists of 2 or more bedrooms surplus to the household requirements, as determined by CNOS measures.
Underutilisation can arise as a household ages and children leave the family home. Tenants may have been living in a home for a number of years and their economic, social and community life is centred around that location, and there are no suitable alternatives for relocation. Underutilisation also occurs, in part, due to the public housing stock itself being dominated by family-sized homes with 3 or more bedrooms, in addition to problems faced by social housing providers needing to adjust rental dwelling size to accommodate changing household sizes.
At 30 June 2017, 17% of public housing and 7% of community housing households were in underutilised dwellings (see Table 5.1). Social housing targeted towards Indigenous households had the highest proportion of underutilisation, with 26% of SOMIH households living in underutilised dwellings (underutilisation data were not available for the NT remote public housing reported in SOMIH in 2017).
Location
The proportion of households in underutilised dwellings varied by jurisdiction and remoteness areas across the social housing programs.
For public housing, South Australia had the highest proportion of households in underutilised dwellings at over 1 in 4 households (26%), followed by the Australian Capital Territory (17%). The Northern Territory had the lowest proportion of underutilisation (7%) (see supplementary table UNDER.5).
For SOMIH households, South Australia also reported the highest proportion of underutilisation (31%), followed by New South Wales (29%). Tasmania reported the lowest proportion of underutilisation (16%) across all states and territories.
For households in mainstream community housing dwellings, South Australia had the highest proportion of underutilisation (22%), followed by Tasmania (15%). The Australian Capital Territory experienced the lowest proportion of underutilisation, at around 2%.
The proportion of households in underutilised dwellings in public housing varied substantially across remoteness areas. Outer regional areas were most likely to be underutilised (22%), compared with 15% in Remote areas. Underutilisation of SOMIH dwellings ranged from 21% in Very remote areas to 27% in Major cities (see supplementary table UNDER.6).
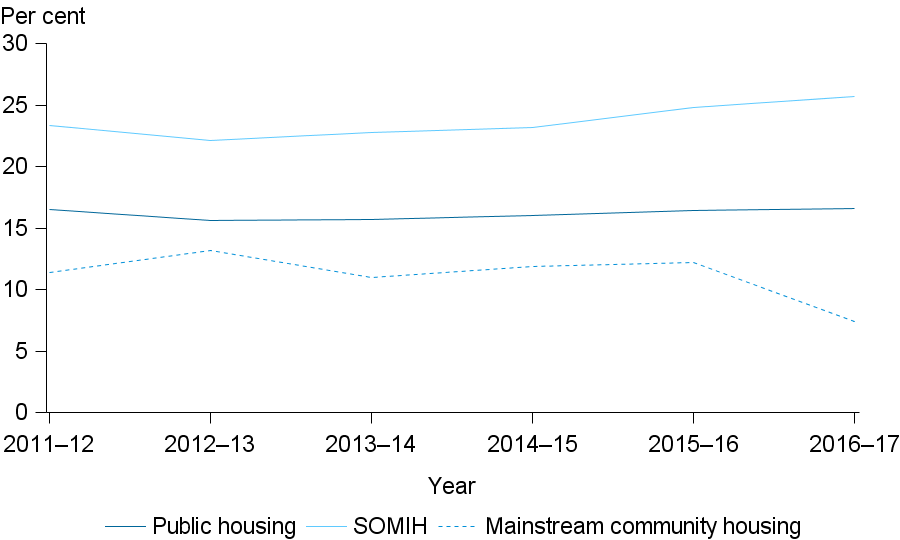
Trends
Between 2011–12 and 2016–17, trends in underutilisation across mainstream community housing households have varied, whereas SOMIH and public housing underutilisation has remained relatively static over time (Figure 5.2).
Public housing underutilisation has remained steady between 2011–12 and 2016–17, at around 16%. SOMIH underutilisation has also remained fairly steady with a slight increase to 26% in 2016–17, from 23% in 2011–12. In contrast, underutilisation in mainstream community housing has fallen; from 11% in 2011–12 to 7% in 2016–17. Mainstream community housing has maintained comparatively low levels of underutilisation when compared with other social housing programs.
Figure 5.2: Underutilised households in social housing(a) (per cent), 2011–12 to 2016–17
- Where partial household information is known, some assumptions may have been made in order to include them in these analyses.
Notes
- Includes all households within the SOMIH program except NT where data were unavailable
- Data are based on all jurisdictions except NT where data were unavailable. Qld provided partial unit record tenant data for the first time in 2015–16.
- Data are based on the Canadian National Occupancy Standard and exclude households where housing utilisation was unknown.
- From 2011–12, the definition of underutilisation has changed (it was previously one or more spare bedrooms), therefore comparisons cannot be made with earlier years.
- Data for utilisation in Indigenous community housing were unavailable.
Source: AIHW National Housing Assistance Data Repository. See supplementary table UNDER.7.
References
- Canada Mortgage and Housing Corporation (CMHC) 2014. Housing in Canada Online - Definitions of Variables. Accessed 20 March 2018.