Screening for diabetic retinopathy with a retinal camera
Measure 2.3.3: The number of Indigenous Australians, diagnosed with diabetes, who were screened for diabetic retinopathy with a retinal camera, in the 12-month period (MBS data).
There are 4 separate charts for this measure showing the proportion of those diagnosed with diabetes who had an eye examination were screened for diabetic retinopathy with a retinal camera in the recommended timeframe, by various characteristics.
Number of Indigenous Australians who had a visual acuity test by age, 2016–17 to 2019–20
This line graph shows the number of Indigenous Australians who were diagnosed with diabetes who were screened for diabetic retinopathy with a retinal camera from 2016─17 to 2019─20, by age group. The number of eye examinations is highest for those aged 45–59 years.
Number and rate per 1,000 of Indigenous Australians who were screened for diabetic retinopathy with a retinal camera by sex, 2019-20
This dual axis combined vertical bar chart and scatter plot shows the number and rate of Indigenous Australians diagnosed with diabetes who were screened for diabetic retinopathy with a retinal camera in 2019─20, by sex. The rate of screening tests with a retinal camera was higher for Indigenous females than Indigenous males (1.5 per 1,000 and 1.3 per 1,000, respectively).
Number and rate per 1,000 of Indigenous Australians who were screened for diabetic retinopathy with a retinal camera by jurisdiction, 2019-20
This dual axis combined vertical bar chart and scatter plot shows the number and rate of Indigenous Australians diagnosed with diabetes who were screened for diabetic retinopathy with a retinal camera in 2019─20, by jurisdiction. The rate of screening tests was highest in Western Australia, 3.7 per 1,000 population and lowest in New South Wales, 0.3 per 1,000 population.
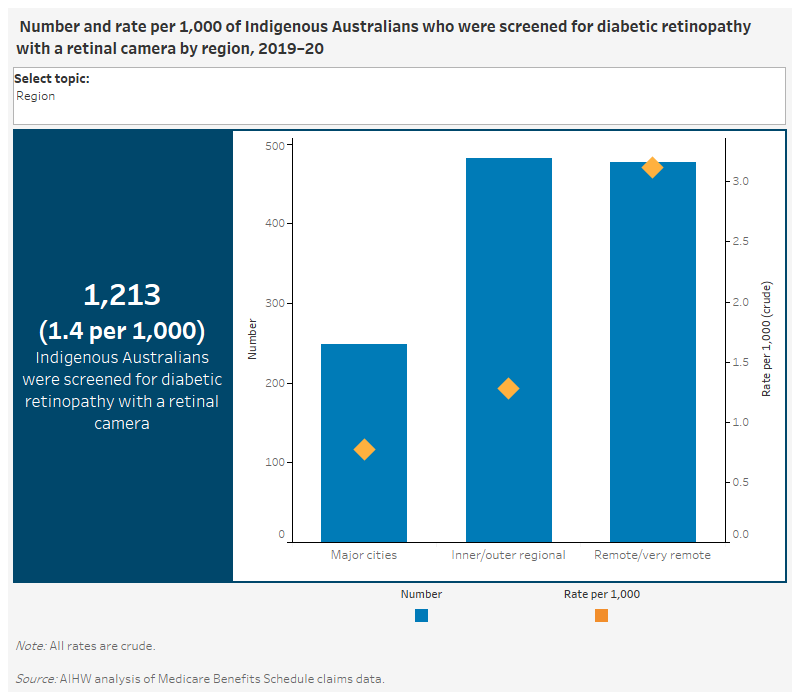
Number and rate per 1,000 of Indigenous Australians who were screened for diabetic retinopathy with a retinal camera by region, 2019-20
This dual axis vertical bar chart and scatter plot shows the number and rate of Indigenous Australians diagnosed with diabetes who were screened for diabetic retinopathy with a retinal camera in 2019─20, by region. The rate was highest in Remote and very remote areas combined, 3.1 per 1,000 population and lowest in Major cities, 0.8 per 1,000 population.

- In 2019–20, an estimated 1,213 (1.4 per 1,000 Indigenous population) Indigenous Australians diagnosed with diabetes, were screened for diabetic retinopathy with a retinal camera.
- In 2018–19 and 2019–20, the rate of screening tests for diabetic retinopathy with a retinal camera for Indigenous Australians was lowest in Major cities (0.9 and 0.8 per 1,000, respectively) and highest in Remote and very remote areas (4.3 and 3.1, respectively).
- From 2016–17 to 2019–20, age-specific rates of screening tests for diabetic retinopathy with a retinal camera for Indigenous Australians were highest for those aged 60–74 or 75 and over.


