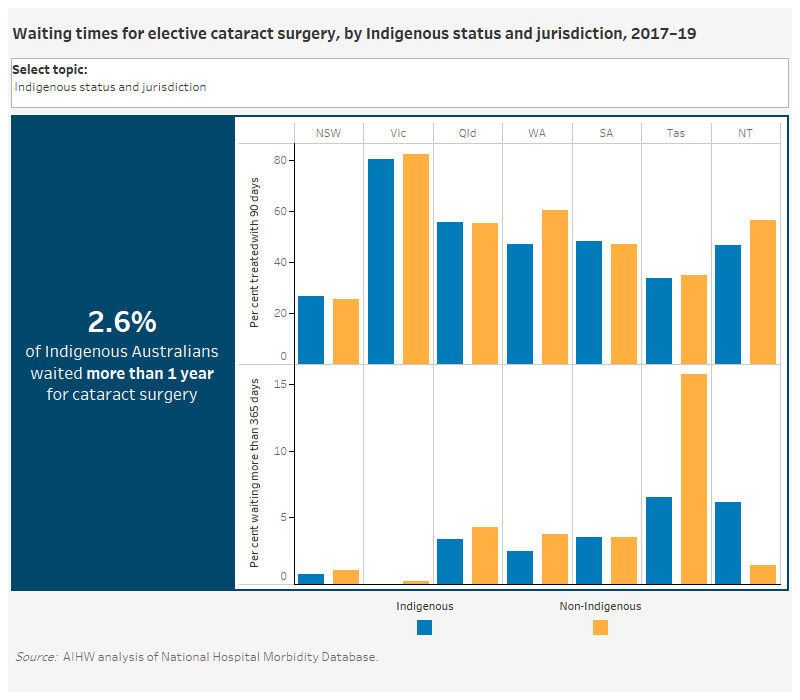
Waiting times for elective cataract surgery (days)
Measure 3.6.2: The proportion of patients who completed their wait who had cataract surgery within 90 days and within 365 days. To make it easier to interpret, the figure shows the proportion who waited more than 365 days for cataract surgery.
The waiting times measures provide an indicator of access to cataract surgery for those on waiting lists managed by public hospitals.
There are 3 separate visualisations for this measure showing data by year, jurisdiction and region. The jurisdiction and region time trends contain two grouped vertical bar charts stacked vertically, one for those waiting more than 90 days and the other for those waiting more than 365 days. The time trend visualisation a single line chart by indigenous status for percentage of patients waiting more than 365 days.
Waiting times (treated within 365 days) for elective cataract surgery by Indigenous status, 2012-13 to 2018-19
This line chart shows the percentage of patients waiting more than 365 days for elective cataract surgery, from 2012–13 to 2018–19, by Indigenous status. The chart shows that while there has always been more Indigenous Australians that were not treated within 365 days the gap has narrowed significantly. In 2012-13 the percent was 6.6 for Indigenous and 3.2 for non-Indigenous. In 2018-19 it was 2.6 for Indigenous and 2.4 for non-Indigenous.
Waiting times (days) for elective cataract surgery by Indigenous status and region, 2017-19
This visualisation shows the percentage of patients waiting more than 90 days for elective cataract surgery, in 2017–19, by Indigenous status and region. The chart shows that in all regions the percentage of Indigenous patients treated was lower than non-Indigenous.
This visualisation also shows the percentage of patients waiting more than 365 days for elective cataract surgery in 2017–19, by Indigenous status and region. The chart shows that in Inner regional and Outer regional areas a smaller percentage of Indigenous than non-Indigenous Australians waited longer than 365 days.
Waiting times (days) for elective cataract surgery by Indigenous status and jurisdiction, 2017-19
This visualisation shows the percentage of patients waiting more than 90 days for elective cataract surgery, in 2017–19, by Indigenous status and jurisdiction. The chart shows that in NSW, Qld and SA a slightly higher percentage of patients were treated within 90 days.
This visualisation also shows the percentage of patients waiting more than 365 days for elective cataract surgery in 2017–19, by Indigenous status and jurisdiction. The chart shows in NT and SA a larger percentage of Indigenous than non-Indigenous Australians waited longer than 365 days.

- In 2018–19, the proportion of Indigenous Australians who had elective cataract surgery and were treated within 90 days was lower than the proportion of non-Indigenous Australians who were treated within this time (42% and 53%, respectively).
- In 2018–19, the proportion of Indigenous Australians treated within 365 days for cataract surgery was similar to the proportion of non-Indigenous Australians who were treated within this time (97% and 98%, respectively).
- Between 2012–13 and 2018–19, the proportion of both Indigenous and non-Indigenous Australians who were treated within 90 days and within 365 days for elective cataract surgery remained relatively stable.


