Rural and remote health
Citation
AIHW
Australian Institute of Health and Welfare (2023) Rural and remote health, AIHW, Australian Government, accessed 26 April 2024.
APA
Australian Institute of Health and Welfare. (2023). Rural and remote health. Retrieved from https://www.aihw.gov.au/reports/rural-remote-australians/rural-and-remote-health
MLA
Rural and remote health. Australian Institute of Health and Welfare, 11 September 2023, https://www.aihw.gov.au/reports/rural-remote-australians/rural-and-remote-health
Vancouver
Australian Institute of Health and Welfare. Rural and remote health [Internet]. Canberra: Australian Institute of Health and Welfare, 2023 [cited 2024 Apr. 26]. Available from: https://www.aihw.gov.au/reports/rural-remote-australians/rural-and-remote-health
Harvard
Australian Institute of Health and Welfare (AIHW) 2023, Rural and remote health, viewed 26 April 2024, https://www.aihw.gov.au/reports/rural-remote-australians/rural-and-remote-health
Get citations as an Endnote file: Endnote
On this page:
Around 7 million people – or 28% of the Australian population – live in rural and remote areas, which encompass many diverse locations and communities (ABS 2022e). These Australians face unique challenges due to their geographic location and often have poorer health outcomes than people living in metropolitan areas. Data show that people living in rural and remote areas have higher rates of hospitalisations, deaths, injury and also have poorer access to, and use of, primary health care services, than people living in Major cities.
Defining rural and remote
This report uses 2 remoteness structure classification systems.
The Australian Statistical Geography Standard (ASGS) Remoteness Structure, 2016 (ABS 2021b) defines remoteness areas in 5 classes of relative remoteness:
- Major cities
- Inner regional
- Outer regional
- Remote
- Very remote.
These remoteness areas are centred on the Accessibility/ Remoteness Index of Australia, which is based on the road distances people have to travel for services (ABS 2021b).
This report uses the term ‘rural and remote’ to cover any area outside of Australia’s Major cities. Due to small population sizes, data for Outer regional and remote and Remote and very remote areas are sometimes combined for reporting.
The Modified Monash Model (MMM) (Department of Health and Aged Care 2021) is based on the ASGS Remoteness Structure and also town size. It classifies metropolitan, regional, rural and remote areas in Australia into seven categories:
- MM1: Metropolitan areas
- MM2: Regional centres
- MM3: Large rural towns
- MM4: Medium rural towns
- MM5: Small rural towns
- MM6: Remote communities
- MM7: Very remote communities.
Areas classified MM 2 to MM 7 are considered to be rural or remote.
The MMM was developed to better target health workforce programs and to attract health professionals to more remote and smaller communities. This report uses the MMM for presentation of access to primary health care and health workforce data.
Profile of rural and remote Australians
The majority of Australians live in Major cities compared with rural and remote areas. As at 30 June 2021, the proportion of Australians by area of remoteness was:
- 72% in Major cities
- 18% in Inner regional areas
- 8.2% in Outer regional areas
- 1.2% in Remote areas
- 0.8% in Very remote areas (ABS 2022e).
First Nations people
Aboriginal and Torres Strait Islander (First Nations) people are more likely to live in urban and regional areas compared with more remote areas. However, the proportion of the total First Nations population increases with remoteness from 1.8% in Major cities, to 32% in Remote and very remote areas based on estimated Indigenous population projections for 2021 (AIHW 2021c). First Nations Australians have lower life expectancies, higher burden of disease, poorer self-reported health and a higher likelihood of being hospitalised than non-Indigenous Australians (AIHW 2022a; AIHW and NIAA 2020, 2021).
See First Nations people.
Age
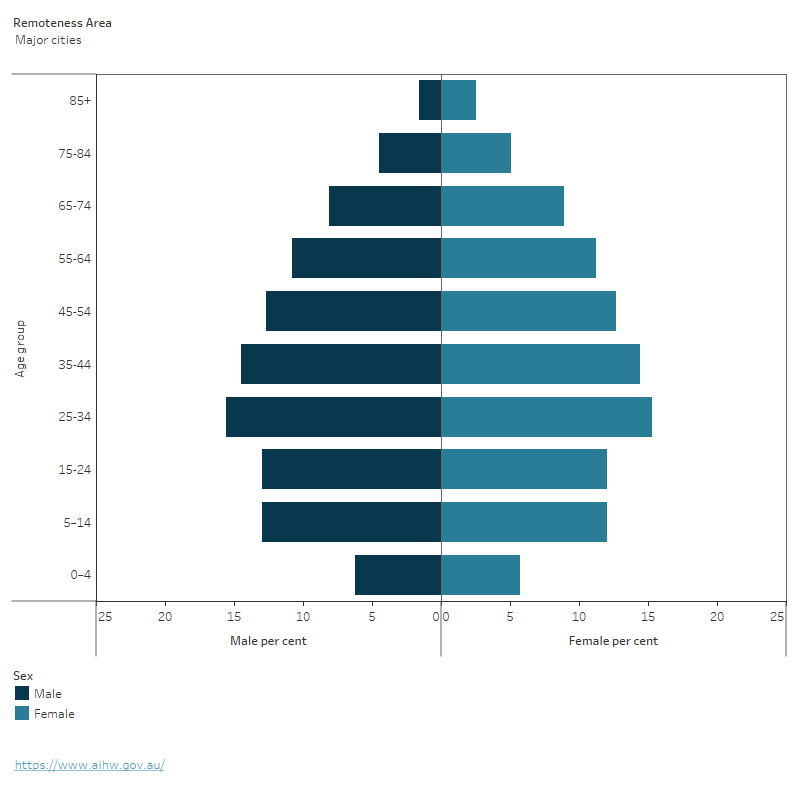
On average, people living in Inner Regional and Outer regional areas are older than those in Major cities. For Inner regional areas, 21.5% of the population were age 65 years or older in 2021 compared with 15.4% in Major cities and 12.5% in Remote or Very remote areas (ABS 2022e). Figure 1 shows the age and sex breakdown of each of the remoteness areas for 2021.
Figure 1 can be customised by selecting from the ‘Remoteness Area’ drop-down menu. You may also view the Data Table by selecting its tab.
Figure 1: Australian population, by age groups, sex and areas of remoteness, 2021
This graph shows the age and sex for each of the remoteness areas by age groups 0-4, 5–14, 15–24, 25–34, 35–44, 45–54, 55–64, 65–74, 75–84 and 85+. The graph shows that on average, people living in Remote and very remote areas are younger than those in Major cities. The highest proportion of older Australians aged 65+ live in Inner regional and Outer regional areas.
Note: Percentages for each remoteness area includes those from Other Territories.
Source: AIHW analysis of ABS 2022e; Table S1.
Age standardisation
Health status, outcomes and service use are associated with age. This means that comparisons between population groups can be confounded by differences in their age distributions. Age-standardised rates are often used to compare outcomes for populations with different age structures, such as remoteness areas. As the purpose of this web report is to make comparisons between remoteness areas, age-standardised results have been used for health risk factors and chronic conditions, where possible. Unadjusted (crude) rates are available in the supplementary data tables, and are often available in the referenced and/or linked reports.
Education
In 2022, people aged 20–64 living in rural and remote areas were less likely than those in Major cities to have completed Year 12 or a non-school qualification (Figure 2; ABS 2022b). More than half the people living in Inner regional (61%), Outer regional (56%) and Remote and very remote areas (55%) had completed Year 12, compared with three-quarters (79%) of those in Major cities (ABS 2022b). The gap in completion of Year 12 between Major cities and Remote and very remote areas has narrowed slightly from 29% in 2013 to 24% in 2022 (Figure 2; ABS 2022b).
Figure 2 can be customised by selecting one of 2 options under ‘Qualification(s) held’, that is ‘Year 12 or equivalent’ (default view) or ‘Bachelor’s degree or higher’. You may also view the Data Table by selecting its tab.
Figure 2: People aged 20–64 with a Bachelor's degree or higher/Year 12 or equivalent qualification, by remoteness area, 2013–2022
This stacked bar chart shows the proportion of people aged 20–64 with a Bachelor’s degree or higher qualification or Year 12 equivalent qualification, by remoteness area. There was a higher proportion of people aged 20–64 living in Major Cities who have a Bachelor’s degree or higher qualification or Year 12 equivalent qualification compared with people living in Regional and Remote areas.

Source: ABS 2022b
Similarly, a smaller proportion of people aged 20–64 living in Inner regional (24%), Outer regional (23%) and Remote and very remote areas (20%) had completed a bachelor’s degree or above in 2022, compared with those in Major cities (41%) (ABS 2022b). The gap in completion of a bachelor’s degree between Major cities and Remote and very remote areas has widened from 18% in 2013 to 21% in 2022 (Figure 2; ABS 2022b).
Young people from rural and remote areas may be more likely to move to metropolitan areas to study and subsequently stay after completing their studies (Mackey 2019). The education levels of people living in rural and remote areas are also influenced by factors such as decreased study options, the skill and education requirements of available jobs and the earning capacity of jobs in these communities (Lamb and Glover 2014; Regional Education Expert Advisory Group 2019).
Employment and income
Labour force data shows, in general, people aged 15 and over living in metropolitan (greater capital city) areas are more likely to be employed than people living outside these areas (ABS 2023). This may be due to lower opportunities and access to work outside metropolitan areas and the smaller range of employment and career opportunities in these areas (ABS 2023; NRHA 2013).
People living in rural and remote areas also generally have lower incomes but pay higher prices for goods and services (NRHA 2014). In 2019–20, Australians living outside capital cities had, on average, 15% less household income per week compared with those living in capital cities, and 22% less mean household net worth (ABS 2022c).
Since March 2020, the impact of the COVID-19 pandemic has had a number of effects on a variety of health and non-health related activities, including employment.
See ‘Chapter 4 The impacts of COVID-19 on employment and income support in Australia’ in Australia’s welfare 2021: data insights.
Health risk factors
Why is the most recent risk factor and chronic condition data from 2017–18?
Nationally representative estimates on risk factors and chronic conditions are derived from the Australian Bureau of Statistics’ (ABS) National Health Survey (NHS).
Due to the COVID-19 pandemic, the NHS 2020-21 survey was collected via online, self-completed forms to maintain the safety of survey respondents and ABS Interviewers. Physical measurements (including height, weight and blood pressure) were not taken at the time of the NHS 2020–21.
Previous versions of the NHS have primarily been administered by trained ABS interviewers and were conducted face-to-face. Interviewer follow up of households helps to reduce non-response. As this was not possible during lockdown periods, there were lower response rates than previous NHS cycles, which impacted sample representativeness for some sub-populations. Additionally, the impact of COVID-19 and lockdowns might also have had direct or indirect impacts on people’s usual behaviour over the 2020–21 period.
Due to these changes, results from the NHS 2020–21 are not comparable with previous surveys. The AIHW will aim to update these data with the next NHS to be released in early 2024.
Health risk factors such as smoking, overweight and obesity, diet, high blood pressure, alcohol consumption and physical activity can influence health outcomes and the likelihood of developing disease or health disorders.
In 2017–18, based on self-reported data from the NHS and after adjusting for age, people living in Inner regional and Outer regional and remote areas were more likely to engage in risky behaviours, such as smoking and consuming alcohol at levels that put them at risk of life-time harm, compared with people living in Major cities (Figure 3; Table S2).
More recent data for daily tobacco smoking from the National Drug Strategy Household Survey 2019 shows the proportion of people aged 14 and over who smoke daily increases with remoteness area, from 9.7% for those living in Major cities to 13.4% for Inner regional areas, 15.9% for Outer regional areas and 19.6% for those living in Remote and very remote areas (AIHW 2020c). Since 2016, the proportion has declined by around 1% in all remoteness areas.
To customise the data displayed in Figure 3, select from the ‘Health risk factors’ drop-down menu. You may also view the data table by selecting its tab.
See Alcohol, tobacco & other drugs.
Figure 3: Prevalence of health risk factors, by remoteness area, 2017–18
This chart shows the prevalence of health risk factors including, current daily smoking, excessive alcohol consumption, inadequate fruit intake, inadequate vegetable intake, daily sugar drink consumption, insufficient physical activity, overweight and obesity and high blood pressure by remoteness area. For most risk factors, prevalence was higher in Inner regional and Outer regional and remote areas compared with Major cities with the exception of inadequate vegetable intake, insufficient physical activity and high blood pressure which were similar.

Notes
- Proportions were age standardised to the 2001 Australian Standard Population.
- Excludes Very remote areas.
- Estimates for overweight or obese and high blood pressure are based on measured data while estimates for all other risk factors are based on self-reported data.
Source: AIHW analysis of ABS 2019; Table S3.
Family, domestic and sexual violence
Family, domestic and sexual violence is a major health and welfare issue in Australia. The ABS 2016 Personal Safety Survey estimated that 2.2 million adults had been victims of physical and/or sexual violence from a partner since the age of 15 (ABS 2017).
Women living outside Major cities were 1.5 times as likely to have experienced partner violence than women living in Major cities (23% compared to 15%). For men living outside of Major cities, 6.6% experienced partner violence compared to 5.9% of men living in Major cities (AIHW 2019).
See Family, domestic and sexual violence.
Health status and outcomes
Chronic conditions
Chronic conditions are long-lasting and have persistent effects throughout a person’s life. They are becoming increasingly common and are influenced by a wide variety of factors.
In 2017–18, based on self-reported data from the NHS and after adjusting for age, people living outside Major cities had higher rates of arthritis, asthma and diabetes, while mental and behavioural conditions were higher in Inner regional areas compared with Outer regional and remote areas and Major cities. However, rates of all other conditions were similar across remoteness areas (Figure 4; Table S3). Additionally, the prevalence of multimorbidity – the presence of 2 or more chronic conditions in a person at the same time – was similar across remoteness areas (AIHW 2020a).
People living outside Major cities have lower usage of chronic disease management services, which can be due to a number of reasons including availability of services or the health and age of the population within an area (AIHW 2022f).
To customise the data displayed in Figure 4, select from the ‘Chronic conditions’ drop-down menu. You may also view the Data Table by selecting its tab.
See Chronic disease and Chronic conditions and multimorbidity
Figure 4: Prevalence of selected chronic conditions, by remoteness areas, 2017–18
This chart shows the prevalence of chronic conditions including arthritis, asthma, back pain and problems, chronic obstructive pulmonary disease, diabetes, heart, stroke and vascular disease, mental and behavioural problems and osteoporosis by remoteness area. The prevalence of most chronic conditions was similar across remoteness areas but rates of asthma, arthritis and diabetes were higher outside of Major cities.

Notes
- Proportions were age standardised to the 2001 Australian Standard Population.
- Excludes Very remote areas
- Data are self-reported.
Source: AIHW analysis of ABS 2019; Table S3.
Cancer
The age-standardised incidence rate of all cancers combined was highest in Inner regional and Outer regional areas in 2012–2016 (513 and 512 per 100,000 people, respectively), slightly lower in Major cities and Remote areas (both 487 cases per 100,000 people), and lowest in Very remote areas (422 cases per 100,000 people) (AIHW 2021b).
However, the incidence rate for all cancer for Very remote areas may be influenced by lower population screening participation rates, later detection of a cancer and lower life expectancy due to death from other causes (AIHW 2021b; Fox and Boyce 2014). Very remote areas had the highest incidence rate for cervical cancer, liver cancer, cancer of unknown primary site, uterine cancer and head and neck cancers (including lip).
In the period 2012–2016, people living in Major cities had the highest 5-year observed survival for all cancers combined (63%) compared with 61% for all other areas, except for Very remote areas which had the lowest survival rate (55%) (AIHW 2021b).
See Cancer in Australia 2021and Cancer.
Burden of disease
Burden of disease refers to the quantified impact of a disease or injury on a population, which captures overall health loss, that is, years of healthy life lost through premature death or living with ill health (see Burden of disease).
In 2018, after adjusting for age, the total burden of disease and injury in Australia increased with increasing remoteness (AIHW 2021a). The total burden was lowest in Major cities (174 DALY per 1000 population) rising to 200 and 204 for Inner and Outer regional areas, respectively, and 244 DALY per 1000 population in Remote and very remote areas. This pattern was mostly driven by fatal burden (years of life lost due to premature death).
Figure 5 shows the burden of disease for selected chronic conditions by remoteness area. For some conditions the burden of disease increased with increasing remoteness, such as coronary heart disease, type 2 diabetes, chronic kidney disease, lung conditions and suicide and self-inflicted injuries. The burden of disease decreased with increasing remoteness for anxiety, back pain and dementia (AIHW 2021a).
See Australian Burden of Disease Study and Burden of disease.
Figure 5: Health burden for major diseases, by remoteness area, 2018
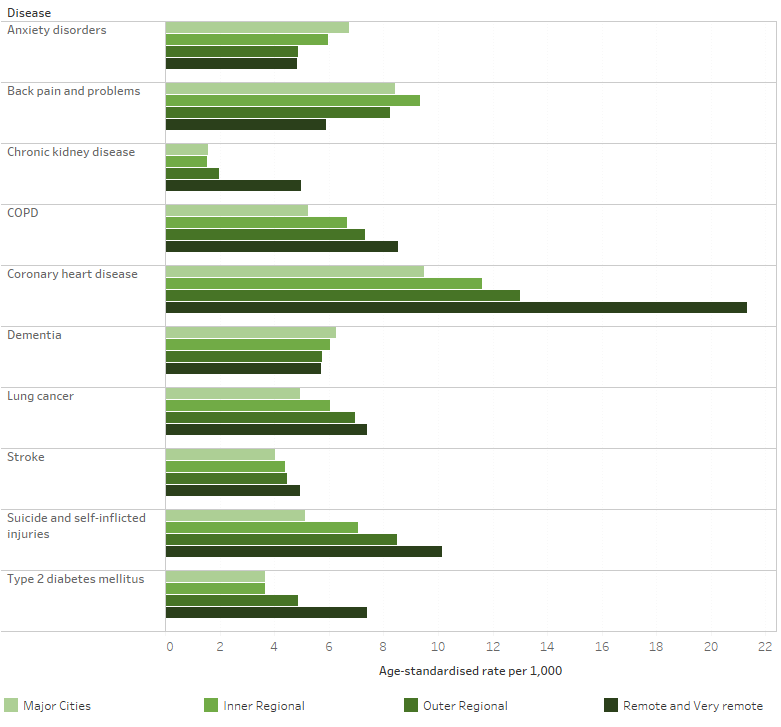
Chart: AIHW. Source: AIHW 2021a
Deaths
People living in rural and remote areas are more likely to die at a younger age than their counterparts in Major cities. They have higher mortality rates and higher rates of potentially avoidable deaths than those living in Major cities.
In 2021, age-standardised mortality rates increased as remoteness increased for males and females (Table 1 AIHW 2023e). Compared to all of Australia:
- People living in Inner or Outer regional areas had a mortality rate 1.1 times as high.
- People living in Remote areas had a mortality rate 1.2 times as high.
- People living in Very remote areas had a mortality rate 1.5 times as high.
- Males had a higher mortality rate than females in all remoteness areas.
| Major cities | Inner regional | Outer regional | Remote | Very remote | |
|---|---|---|---|---|---|
| Median age at death (Males) | 80 | 79 | 77 | 73 | 67 |
| Age-standardised rate (deaths per 100,00) (Males) | 569 | 636 | 675 | 711 | 925 |
| Rate ratio (Males) | 0.95 | 1.06 | 1.13 | 1.19 | 1.55 |
| Median age at death (Females) | 85 | 84 | 83 | 79 | 69 |
| Age-standardised rate (deaths per 100,00) (Females) | 409 | 456 | 477 | 514 | 644 |
| Rate ratio (Females) | 0.96 | 1.07 | 1.12 | 1.20 | 1.51 |
Note: Rate ratios are calculated as the age-standardised rate for the geographic area of interest divided by the age-standardised rate for the reference group (all of Australia).
Source: AIHW 2023e
Leading causes of death 2017–2021
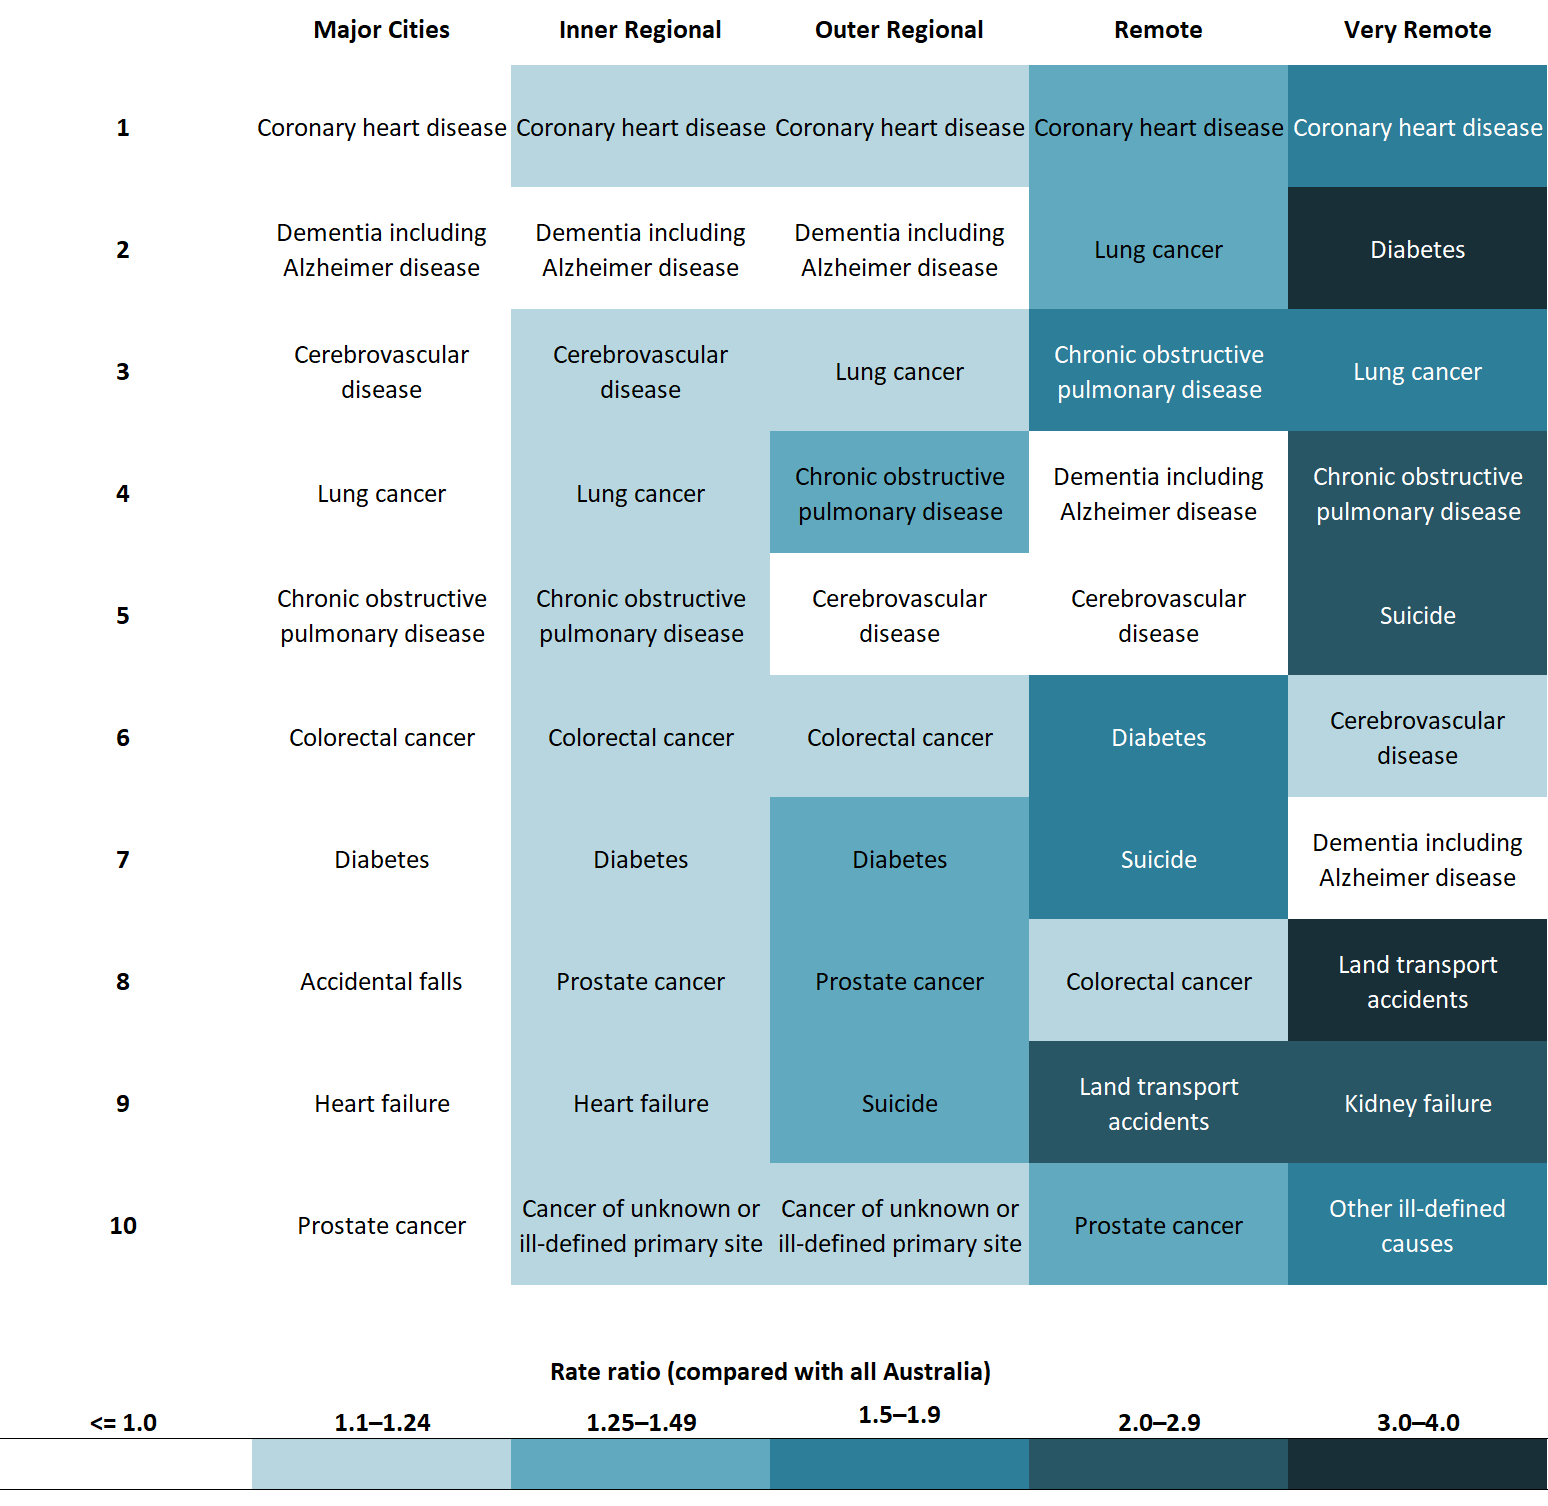
Figure 6 shows the 10 leading causes of death for each remoteness area for the period 2017–2021, with comparison to mortality rates for Australia overall (AIHW 2023e).
- Coronary heart disease was the leading cause of death across all remoteness areas. Age-standardised rates were between 1.1 and 1.7 times higher outside of Major cities than for Australia overall.
- The top 7 causes of death were the same for Major cities, Inner regional and Outer regional areas.
- Land transport accidents were a leading cause of death in Remote and Very remote areas. The rate of dying due to land transport accidents was nearly 3 times as high for Remote areas and nearly 4 times as high for Very remote areas, compared with Australia overall (AIHW 2023e).
Figure 6: Leading cause of death by remoteness area, with comparison mortality rates with Australia overall 2017–2021
Notes
- Rates are age-standardised to the 2001 Australian standard population.
- Leading causes of death are listed in order of number of deaths in each remoteness area from 2017–2021.
- Boxes are coloured based on rate ratio comparing each region to Australia overall.
Source AIHW 2023e; Table S4.
Potentially avoidable deaths
The rate of potentially avoidable deaths – deaths under the age of 75 from conditions that are potentially preventable through primary or hospital care, such as cancer screening and transport accidents – increased as remoteness increased. For more details on examples and definitions of potentially avoidable deaths see Potentially avoidable deaths, 2021.
In 2021, 16% of all deaths in Australia were potentially avoidable (ABS 2022a). For males and females, the rate increased with remoteness (Figure 7). After adjusting for age and comparing with Major cities, the rates of potentially avoidable deaths were:
- 1.3 and 1.2 times as high in Inner regional areas for males and females, respectively
- 1.5 times as high in Outer regional areas for both males and females
- 2–3 times higher in Remote and Very remote areas (AIHW 2023e).
Figure 7: Potentially avoidable deaths by sex and remoteness area, 2021
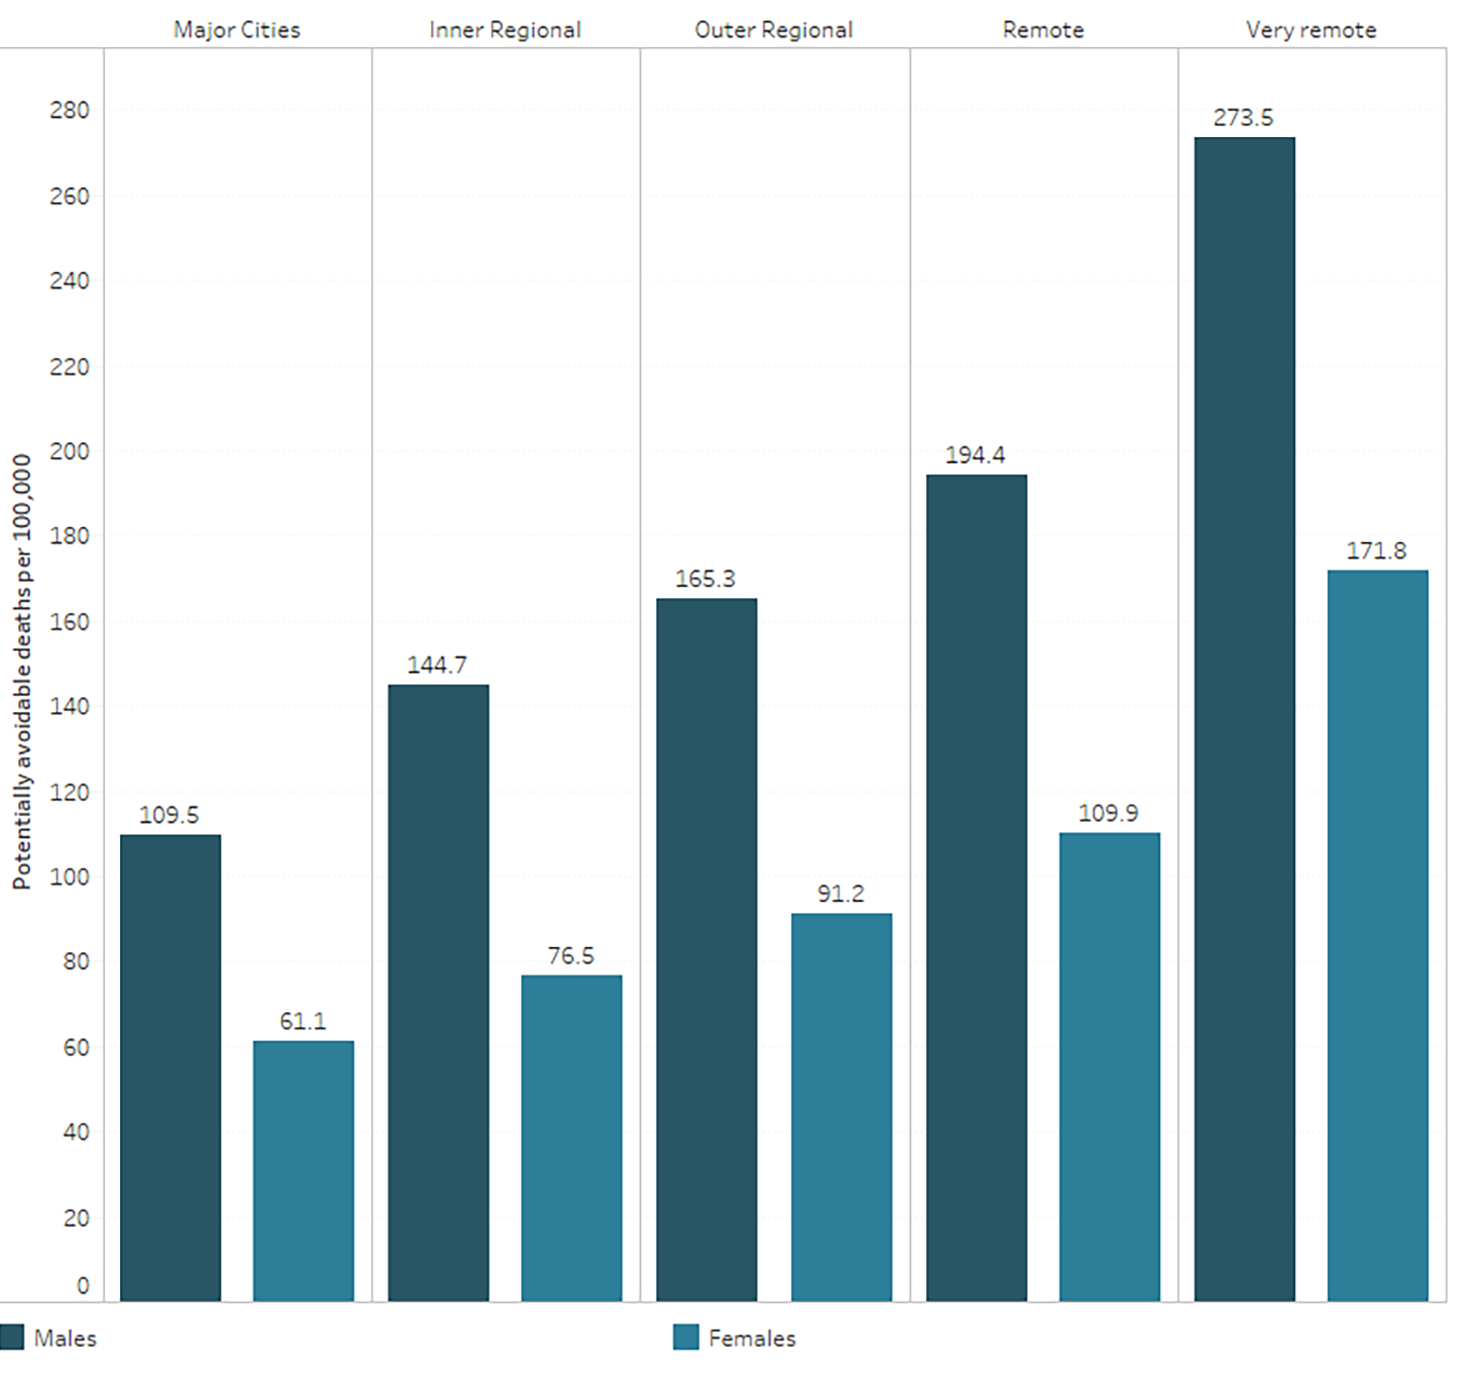
Chart: AIHW. Source: AIHW 2023e
See Mortality Over Regions and Time (MORT) books
Life expectancy
Estimates of life expectancy at birth represent the average number of years that a newborn baby can expect to live, assuming current age-specific death rates are experienced through their lifetime. In 2019–2021, life expectancy at birth was lower for those living outside of metropolitan areas (Table 2; ABS 2022d).
| Males | Females | Persons | |
|---|---|---|---|
| Greater Sydney | 82.8 | 86.4 | 84.5 |
| Rest of NSW | 79.4 | 84.1 | 81.7 |
| Greater Melbourne | 82.3 | 86.1 | 84.1 |
| Rest of Vic. | 79.3 | 84.1 | 81.6 |
| Greater Brisbane | 81.5 | 85.5 | 83.5 |
| Rest of Qld | 80.4 | 84.8 | 82.6 |
| Greater Adelaide | 81.5 | 85.7 | 83.5 |
| Rest of SA | 79.9 | 84.5 | 82.1 |
| Greater Perth | 82.6 | 86.5 | 84.5 |
| Rest of WA | 79.3 | 84.2 | 81.7 |
| Greater Hobart | 80.5 | 85.2 | 82.8 |
| Rest of Tas. | 79.8 | 83.7 | 81.7 |
| Greater Darwin | 78.9 | 84.2 | 81.5 |
| Rest of NT | 71.7 | 77.1 | 74.4 |
Source: ABS 2022d.
Impact of COVID-19
The COVID-19 pandemic has impacted rural and remote communities in a multitude of ways. While the largest proportion of COVID-19 cases occurred in Major cities and decreased with increasing remoteness, a high proportion of residents in Very remote areas were affected by COVID-19. See 'Chapter 1 The impact of a new disease: COVID-19 from 2020, 2021 and into 2022' in Australia's health 2022: data insights. Health impacts from COVID-19 can be more severe for those with underlying chronic conditions or higher prevalence of risky health behaviours. With many of those increasing with remoteness, rural and remote communities are particularly vulnerable to enhanced health inequalities from COVID-19 (Lakhani et al. 2020). Additionally, some rural and remote communities face further challenges with the pandemic without the same resources available in urban centres, and longer travel distances required to access testing and vaccination (Carter et al. 2021). However, populations living in regional and remote areas are likely to have benefitted from the introduction of new Medicare Benefits Schedule telehealth services that came into effect in response to the pandemic.
See ‘Chapter 2 Changes in the health of Australians during the COVID-19 period’ in Australia’s health 2022: data insights, and Impacts of COVID-19 on Medicare Benefits Scheme and Pharmaceutical Benefits Scheme: quarterly data.
Access to health care
People living in rural and remote areas face barriers to accessing health care, due to challenges of geographic spread, low population density, limited infrastructure, and the higher costs of delivering rural and remote health care.
Primary health care
Medicare claims data from 2021–22 show that the number of non-hospital non-referred attendances per person, such as general practitioner (GP) visits, were lowest in Remote communities (MM6) and Very remote communities (MM7) (5 and 3.6 per person respectively) (Table 3). However, bulk-billing rates were highest in Very Remote Communities (MM7) (91%) and Metropolitan Areas (MM1) (89%) and lowest in Regional Centres (MM2) and Remote Communities (MM6) (84% and 85%, respectively).
| Modified Monash (MM) category | Total number of GP Non-Referred Attendances | Number of GP Non-Referred Attendances per person | Number of Bulk Billed GP Non-Referred Attendances | Per cent Bulk billed GP Non-Referred Attendances |
|---|---|---|---|---|
| Metropolitan Areas (MM1) | 139.2 million | 7.6 | 124.1 million | 89 |
| Regional Centres (MM2) | 16 million | 6.8 | 13.4 million | 84 |
| Large Rural Towns (MM3) | 11.8 million | 7.2 | 10.1 million | 86 |
| Medium Rural Towns (MM4) | 7.3 million | 7.4 | 6.3 million | 87 |
| Small Rural Towns (MM5) | 12.9 million | 7.2 | 11.3 million | 88 |
| Remote Communities (MM6) | 1.4 million | 5.0 | 1.2 million | 85 |
| Very Remote Communities (MM7) | 744,000 | 3.6 | 679,000 | 91 |
Note: The number of GP non-referred attendances per person was calculated using the Estimated Resident Population at 30 June 2021.
Source: Department of Health and Aged Care 2022b
Participation in bowel, breast and cervical cancer screening varies with remoteness:
- In 2019-20, the bowel cancer screening participation rate was highest for people living in Inner regional areas (47%) and lowest for people living in Very remote areas (27%) (AIHW 2022d).
- In 2019-20, the breast cancer screening participation rate was highest in Outer regional and Inner regional areas at 55% and 53%, respectively, and lowest for participants living in Very remote areas at 36% (AIHW 2022b).
- In 2018-21, the cervical screening participation rate was similar but declined across remoteness areas, from 63% in Major cities to 58% in Outer regional areas and 53% in Very remote areas (AIHW 2022e).
See General practice, allied health and other primary care services and Indigenous Australians and the health system
Health workforce
Australians living in rural, Remote and Very remote communities generally have poorer access to healthcare than people in Regional Centres and Metropolitan areas, and may need to travel long distances or relocate to attend health services or receive specialised treatment (AIHW 2022c). The clinical FTE rate indicates the full-time equivalent number of health professionals working clinical hours relative to the population. In 2016-2021 the clinical FTE per 100,000 population was:
- highest in Metropolitan areas (MM1) for many health professionals including specialists (all doctors other than GPs who require a referral from another doctor), occupational therapists, dentists, pharmacists, physiotherapists, psychologists
- higher in Large rural towns (MM3) compared with Metropolitan Areas (MM1) for optometrists, podiatrists and nurses and midwives
- highest in Large rural towns (MM3), Medium rural towns (MM4), and Remote (MM6) and Very remote (MM7) communities for GPs
- lowest in Small rural towns (MM5), for all health professionals (including GPs) except for pharmacists. (Department of Health and Aged Care 2022a) (Figure 8; Table S5).
Although the FTE rate for GPs increases with increasing remoteness, care should be taken in interpreting the data, as work arrangements in these areas have the potential to be more complicated (NRHA 2017). For example, there may be poor differentiation between general practice for on-call hours, activity for procedures and hospital work for GPs working in rural and remote areas, which affects the accuracy of statistics on GP supply and distribution (Walters et al. 2017).
See Health workforce
To customise the data displayed in Figure 8, select from the ‘Year’ and/or ‘Type of health professional’ drop-down menus. You may also view the Data Table by selecting its tab.
Figure 8: Employed health professionals, clinical full-time equivalent (FTE) rate, by Modified Monash (MM) category
This chart shows the clinical FTE rate of health professionals including dentists, general practitioners, nurses and midwives, occupational therapists, optometrists, pharmacists, physiotherapists, podiatrists, psychologists and specialists by area of remoteness and year. In 2016–2021, the clinical FTE rate of most health professionals was highest in Metropolitan Areas (MM1) except optometrists, podiatrists, nurses and midwives and GPs. The clinical FTE rate for all health professionals was lowest in Small rural towns (MM5), except for pharmacists.

Notes
- Calculations are based on the FTE clinical rate and report health practitioners working in clinical practice using the Estimated Resident Population of that year.
- FTE clinical rates are equal to the FTE number per 100,000 population, which is based on total weekly hours worked. For medical practitioners, the standard working week is 40 hours and for all other health practitioners it is 38 hours.
- Modified Monash (MM) category is derived from Modified Monash (MM) category of main job where available; otherwise, Modified Monash (MM) category of principal practice is used as a proxy.
- Numbers represent not only those in the labour force, but those employed and working in their registered profession.
Sources: ABS 2022f; Department of Health 2022a; Table S8.
Hospitalisations
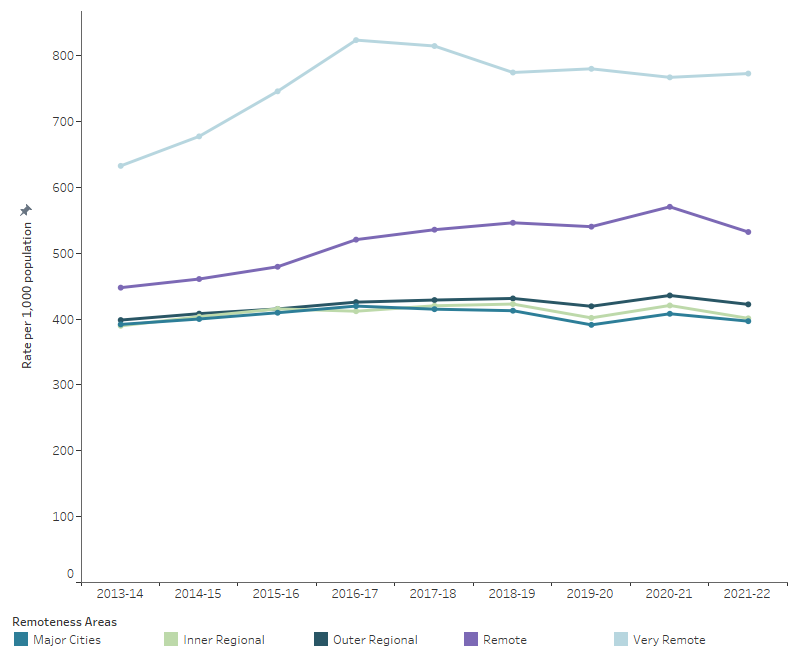
In 2021–22, the number of hospitalisations per 1,000 people was similar for Major cities and regional areas (AIHW 2022a). People living in Very remote areas were hospitalised at almost twice the rate as people living in Major cities and those in Remote areas at 1.3 times the rate, with no improvement since 2013–14 (Figure 9; AIHW 2023b).
Figure 9: Hospitalisations, by remoteness area of usual residence, public and private hospitals, 2013–14 to 2021–22
Notes
- Separations per 1,000 population are reported as directly age-standardised rates based on Australian population as at 30 June of the year of interest, the Australian population as at 30 June 2001 was used as the reference population.
- Remoteness of area of usual residence is based at the patient's area of residence (provided at Statistical Area level 2)
Source: AIHW 2023b
Overall, there was a decrease in the rate of all hospitalisations in 2021–22 across all except for Very remote areas, which could be due to the impact of COVID-19 on provision of healthcare services and reduced flow of patients seeking in-hospital care (AIHW 2023a).
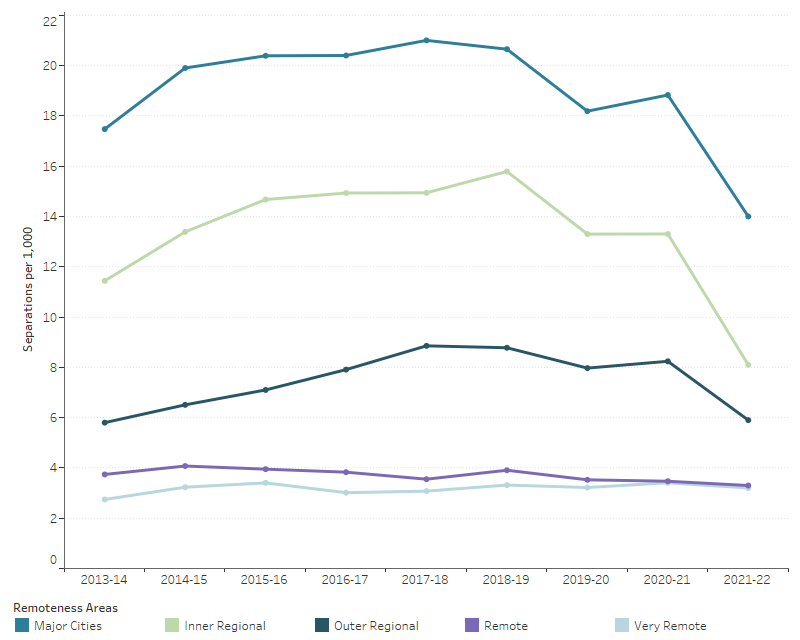
People in Major cities have higher rates of rehabilitation care hospitalisations compared with people living in other remoteness areas (Figure 10; AIHW 2023c). In 2021-22, there were 14 hospitalisations per 1,000 population living in Major cities compared with 8 for Inner regional areas, 6 for Outer regional areas, 3 for both Remote and Very remote areas. In part, this may reflect the distribution of private hospitals across remoteness areas, as private hospitals accounted for 80% of rehabilitation care separations (AIHW 2023c).
See Hospitals.
Figure 10: Hospitalisations for rehabilitation care, by remoteness area of usual residence, public and private hospitals, 2013–14 to 2021–22
Notes
- Separations per 1,000 population are reported as directly age-standardised rates based on the Australian population as at 20 June of the year of interest. The Australian population as at 30 June 2001 was used as the reference population.
- Separations for which care type was reported as Rehabilitation.
Remoteness of area of usual residence is based on patient's area of usual residence (provided as Statistical Area level 2).
Source: AIHW 2023c, Table S10.
Potentially preventable hospitalisations
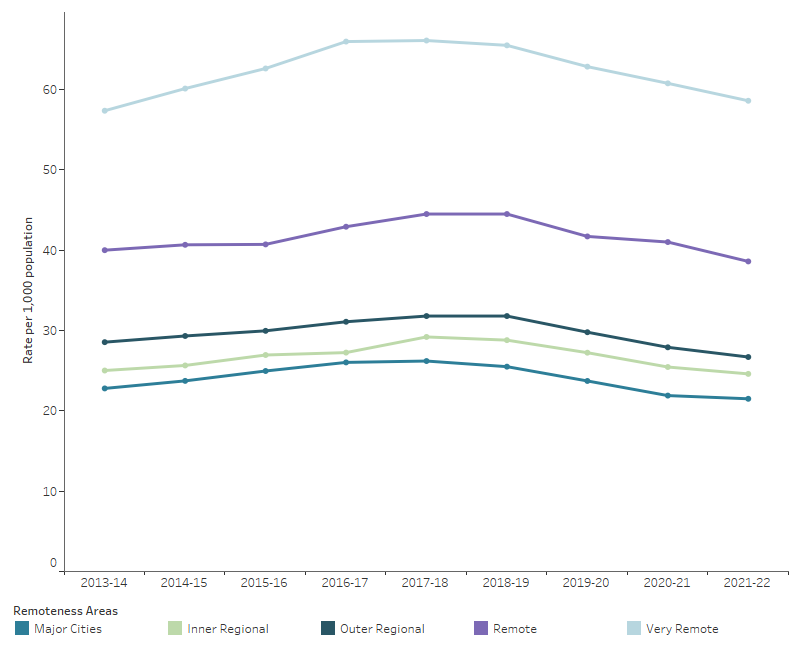
Potentially preventable hospitalisations (PPH) are for conditions where hospitalisation could have potentially been prevented through the provision of appropriate individualised preventative health interventions and early disease management, usually delivered in primary care and community-based settings. The rate of PPH increases with remoteness and is highest in Very remote and Remote areas (Figure 11; AIHW 2023d).
When compared with Major cities, the rate of PPH in 2021–22 was:
- slightly higher in Inner regional and Outer regional areas (1.1 and 1.2 times as high, respectively)
- 2–3 times as high for people living in Remote and Very remote areas (AIHW 2023d).
Figure 11: Potentially preventable hospitalisations, by remoteness area of usual residence, all hospitals, 2013–14 to 2021–22
Notes
- Separations per 1,000 population are reported as directly age-standardised rates based on the Australian population as at 30 June of the year of interest. The Australian population as at 30 June 2001 was used as the reference population.
- Remoteness of area of usual residence is based on the patient's area of residence (provided as Statistical Area level 2 for most jurisdictions)
Source: AIHW 2020b, AIHW 2023d, Table S11
Where do I go for more information?
For more information on rural and remote health see:
- Australian Burden of Disease Study: impact and causes of illness and death in Australia 2018
- Mortality Over Regions and Time (MORT) books
- Admitted patients
- National Rural Health Alliance
Visit Rural and remote Australians for more on this topic.
ABS (Australian Bureau of Statistics) (2017) Personal safety, Australia, 2016, ABS website, accessed 19 April 2022.
ABS (2019) Microdata: National Health Survey, 2017–18, AIHW analysis of detailed microdata, accessed 23 February 2022.
ABS (2021a) Regional population, ABS website, accessed 19 April 2022.
ABS (2021b) Remoteness structure, ABS website, accessed 10 January 2022.
ABS (2022a) Causes of death, Australia, ABS website, accessed 13 June 2023.
ABS (2022b) Education and work, Australia, ABS website, accessed 25 January 2023.
ABS (2022c) Household Income and Wealth, Australia, ABS website, accessed 25 January 2023.
ABS (2022d) Life tables, ABS website, accessed 25 January 2023.
ABS (2022e) Regional population, ABS website, accessed 25 January 2023.
ABS (2022f) Regional population by age and sex. Obtained from the ABS via data request on 28/09/2022, accessed 30 March 2023.
ABS (2023) Labour force, Australia, Detailed, ABS website, accessed 23 May 2023.
AIHW (Australian Institute of Health and Welfare) (2019) Family, domestic and sexual violence in Australia: continuing the national story 2019, AIHW, Australian Government, accessed 20 March 2022.
AIHW (2020a) Chronic conditions and multimorbidity, AIHW, Australian Government, accessed 15 March 2022.
AIHW (2020b) Disparities in potentially preventable hospitalisations across Australia: exploring the data [data set], aihw.gov.au, accessed 25 January 2023.
AIHW (2020c) National Drug Strategy Household Survey 2019, AIHW, Australian Government, accessed 20 March 2022.
AIHW (2021a) Australian Burden of Disease Study: Impact and causes of illness and death in Australia 2018, AIHW, Australian Government, accessed 29 April 2022.
AIHW (2021b) Cancer in Australia 2021, AIHW, Australian Government, accessed 20 March 2022.
AIHW (2021c) Profile of Indigenous Australians, AIHW, Australian Government, accessed 15 February 2022.
AIHW (2022a) Australian Burden of Disease Study: impact and causes of illness and death in Aboriginal and Torres Strait Islander people 2018 – summary report, AIHW, Australian Government, accessed 19 April 2022.
AIHW (2022b) BreastScreen Australia monitoring report 2022, AIHW, Australian Government, accessed 25 January 2023.
AIHW (2022c) Health workforce, AIHW, Australian Government, accessed 3 April 2023.
AIHW (2022d) National Bowel Cancer Screening Program monitoring report 2022, AIHW, Australian Government, accessed 25 January 2023.
AIHW (2022e) National Cervical Screening Program monitoring report 2022, AIHW, Australian Government, accessed 25 January 2023.
AIHW (2022f) Use of chronic disease management and allied health Medicare services, AIHW, Australian Government, accessed 13 June 2023.
AIHW (2023a) Admitted patient care, AIHW, Australian Government, accessed 2 June 2023.
AIHW (2023b) Admitted patient care 3: Who used these services? [data set], aihw.gov.au, accessed 31 May 2023.
AIHW (2023c) Admitted patient care 5:What services were provided? [data set], aihw.gov.au, accessed 31 May 2023.
AIHW (2023d) Admitted patient care 8: Safety and quality of health systems [data set], aihw.gov.au, accessed 31 May 2023.
AIHW (2023e) Mortality Over Regions and Time (MORT) books, AIHW, Australian Government, accessed 5 July 2023.
AIHW and NIAA (Australian Institute of Health and Welfare & National Indigenous Australians Agency) (2020) Aboriginal and Torres Strait Islander Health Performance Framework, 1.17 Perceived health status, AIHW, Australian Government, accessed 15 March 2022.
Carter J, Rutherford S and Borkoles E (2021) ‘COVID-19 vaccine uptake among younger women in rural Australia’, Vaccines (Basel), 10(1):1-13, doi:10.3390/vaccines10010026.
Department of Health and Aged Care (2021) Modified Monash Model Department of Health and Aged Care, Australian Government, accessed 16 February 2023.
Department of Health and Aged Care (2022a) Health workforce data tool [data set], health.gov.au, accessed 10 February 2023.
Department of Health and Aged Care (2022b) Medicare annual statistics – Modified Monash Model locations (2009-10 to 2021-22) [data set], health.gov.au, accessed 28 March 2023.
Fox P and Boyce A (2014) ‘Cancer health inequality persists in regional and remote Australia’, Medical Journal of Australia, 201(8):445–446, doi:10.5694/mja14.01217.
Lakhani HV, Pillai S, Zehra M, Sharma I and Sodhi K (2020) ‘Systematic review of clinical insights into novel Coronavirus (COVID-19) pandemic: persisting challenges in US rural population’, Environmental Research and Public Health, 17(12):1-14 doi:10.3390/ijerph17124279.
Lamb S and Glover S (2014) Educational disadvantage and regional and rural schools, Victoria University, accessed 19 April 2022.
Mackey W (2019) More regional Australians are moving to the city to study. Few return when they’ve finished, Grattan Institute, accessed 19 April 2022.
NRHA (National Rural Health Alliance) (2013) A snapshot of poverty in rural and regional Australia, NRHA, accessed 19 April 2022.
NRHA (2014) Income inequality experienced by the people of rural and remote Australia, NRHA, accessed 19 April 2022.
NRHA (2017) Health workforce, NHRA, accessed 25 February 2022.
Regional Education Expert Advisory Group (2019) National regional, rural and remote education strategy: final report, Department of Education, Australian Government, accessed 20 February 2022.
Walters L, McGrail MR, Carson DB, O’Sullivan BG, Russell DJ, Strasser RP, Hays RB and Kamien M (2017) ‘Where to next for rural general practice policy and research in Australia?’, Medical Journal of Australia 207(2):56–58, doi:10.5694/mja17.00216.
This page was last updated 11 September 2023. All information on this page is the most recent available, as at that date.


