Research methods
The study population consisted of ex-serving ADF members aged 17 years and older who lived in Australia, excluding those resident in Western Australia and Northern Territory. The analysis period was 1 July 2013 to 30 June 2020 and ex-serving members had to be alive on 30 June (reference date) to be included within the analysis for that financial year (but those excluded on this basis would be included in earlier years given they met the requirements at that time). For analysis of ex-serving members who died by suicide, see Health service use in the year before death by suicide among ex-serving ADF members.
Any health service use prior to becoming an ex-serving member was not included in the analysis as current serving members have access to different health services than ex-serving members, which would impact comparability and interpretation.
Types of health services used
The analysis included five types of health services based on the different data sources for each service type. These were:
- some primary care services (MBS) including general practitioner services, specialists, allied health, operations, and diagnostic services such as pathology and diagnostic imaging
- pharmaceuticals dispensed under the Pharmaceutical Benefits Scheme or the Repatriation Pharmaceutical Benefits Scheme (PBS/RPBS)
- admitted hospital care including DVA-funded services
- presentation to emergency departments, including DVA-funded services
- DVA-funded primary care services (MBS equivalent services).
Each of these health service types was split into mental health and non-mental health (see Classifications and codes). Further breakdowns such as GP and specialists were undertaken where possible. The definition for each of the analysed health service types and subcategories are outlined in Table 3.
Statistical methods
Descriptive analysis
The first stage of analysis was to describe the demographic (sex, age) and ADF service-related characteristics (service, rank, length of service, time since service, reason for separation from the ADF and DVA client status) of ex-serving members for each year in the study period (2013–14 to 2019–20). The second stage was descriptive analysis to examine health service use in each financial year within the study period. For each year, the estimates produced included the:
- number and proportion of ex-serving members who accessed any and each health service type per year
- number of health services used by all ex-serving members per year
- average health service use per ex-serving member
- average health service use per ex-serving member who accessed each service type.
These measures were reported for each of the five health service types described earlier, as well as for any health service use (use of at least one health service type each year). All measures were also disaggregated by mental health and non-mental health service categories and stratified by demographic and ADF service-related characteristics.
Logistic regression analyses
To examine factors associated with health service access, logistic regression models were fitted for the most recent year of data (2019–20), as health service use patterns were consistent over time. Separate models were estimated for each of the five health service types defined earlier, as well as for any health service, any mental health service, and any non-mental health service.
Each model modelled a binary outcome (health service users compared with non-users), with non-users as the reference group. Predictor variables included demographic and ADF service-related characteristics. The reference group for the predictors was the category with the highest frequency (the most commonly occurring group).
Results are presented as odds ratios (OR) with 95% confidence intervals. An OR greater than 1 indicates higher odds of health service access relative to the reference group, while an OR less than 1 indicates lower odds.
These estimates are crude and were not adjusted for potential confounding factors, such as demographic factors, ADF-service related factors or comorbidities.
Latent class analysis
The next stage of the analysis used a statistical approach referred to as latent class analysis (LCA) to identify subgroups based on health service use patterns in the most recent year (2019–20).
LCA was selected over alternative clustering methods such as k-means, hierarchical clustering due to its statistical robustness, model-based approach and better handling of mixed data types to identify service use patterns. LCA also provides objective fit statistics, estimates membership probabilities for class selection rather than forced classification, resulting in more reliable pattern identification. Studies have shown that LCA produces lower misclassification rates compared to traditional clustering methods, making it particularly suitable for identifying complex health service use patterns (Naldi and Cazzinga 2020; Aflaki et al 2022; Sinha et al 2021; Magidson and Vermunt 2002).
The health services that were included in the LCA analysis were as per Chitty et al 2023: mental health contact (MBS and ED/hospital), non-mental health contact (MBS and ED/hospital), investigation (such as diagnostic procedures, diagnostic imaging, and pathology from MBS), mental health medicine dispensed (PBS/RPBS), and non-mental health medicine dispensed (PBS/RPBS).
LCA as a data-driven model-based approach identifies underlying subgroups (called latent classes or groups) by estimating:
- group membership probabilities (likelihood of belonging to each group)
- the means and variances of the indicator variables within each group.
Individuals are then probabilistically assigned to the latent groups based on these two model parameters estimated on a maximum-likelihood basis.
Groups of individuals sharing similar patterns of the means and variances of each indicator variable are identified and grouped. This enables the distinctness of each identified groups to be assessed and qualitatively described.
The model building process to determine the optimal number of latent groups was iterative. Models with increasing number of groups (up to six) were fitted. The best-fitting model with the optimal number of groups was selected using several criteria:
- relative fit statistics (Akaike Information Criterion and Bayesian Information Criterion)
- classification diagnostics (entropy values close to 1, average posterior probability of class membership > 0.7 for each group, odds of correct classification based on posterior probabilities > 5 for each group and close correspondence between each latent group’s estimated probability of group membership and the proportion of cohort classified to that group according to posterior probability of group membership)
- smallest group size greater than 5% of the sample
- substantive model interpretability and parsimony.
Group labels were assigned post hoc. These labels were not based on pre-specified cut-offs but were instead informed by the model-estimated posterior probabilities and mean counts of health services use within each latent group, based on the data-driven grouping of individuals with similar patterns and intensity of service use.
Once latent groups were identified, multinomial logistic regression was used to examine how individual demographic and ADF service-related characteristics (independent variables) predicted group membership (dependent variable). The coefficients from the regression models were exponentiated to obtain relative risk ratios (RRR) with 95% confidence intervals. An RRR greater than 1 indicates a higher likelihood of belonging to a particular group (compared to the reference), while an RRR less than 1 indicates a lower likelihood.
Characteristics
This report included analysis of ex-serving members’ health services use by age and service related characteristics that are typically analysed by AIHW (for example see Characteristics of ex-serving Australian Defence Force members hospitalised for suicidality and intentional self-harm). However, it also included analysis by multimorbidity, continuity and regularity of GP care.
Multimorbidity
There were two co-morbidity indices that were used to measure the presence or absence of comorbidities at one year prior to the reference date.
The RxRisk comorbidity index is based on prescription medicines use (PBS/RPBS) and captures 46 selected chronic conditions using Anatomic Therapeutic Chemical (ATC) codes for prescribed medications (Pratt et al 2018). A one-year lookback period prior to the reference date was used to capture active comorbid conditions. A single prescription for any specified medication within each condition category was considered indicative of the presence of that condition. In this report, the weighted scores for 46 comorbid conditions as described by Pratt et al 2018 was used. The RxRisk Index was categorised as 0 (no comorbidities), 1 (moderate comorbidity burden) and 2+ (high comorbidity burden)
The Multipurpose Australian Comorbidity Scoring System (MACSS) based on principal and additional hospital diagnosis codes (admitted patient care), captures 102 selected comorbid conditions using the ICD10-AM codes (Homan et al 2005; Toson et al 2016). Each comorbid condition was flagged as absent or present based on a one-year look back period prior to the reference date. The number of MACSS comorbidities was categorized as none, one, or two or more conditions.
Continuity and regularity of GP care
Continuity of GP care was measured using the Usual Provider of Care (UPC) index, which calculates the proportion of GP visits (identified based on MBS item numbers, date of service and provider number) a patient has with their most usual GP (Welsh et al 2023). UPC as a measure of relational continuity of care was calculated using the formula:
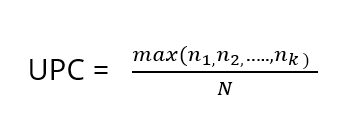
Where max (n1, n2,…nk) is the number of visits to the GP with whom the patient had the greatest number of visits, and N is the total number of visits by the patient to all providers during the same period. The UPC index reflects relational continuity with the same GP but does not capture continuity within a practice, which may also benefit patient care.
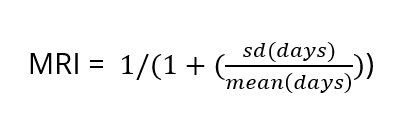
Regularity of GP care was measured using the Modified Regularity Index (MRI), which assesses the distribution of GP visits over time, based on the variation in the number of days between GP visits, with more even dispersion indicating better regularity (or planned, proactive care (Welsh et al 2023). MRI was calculated using the formula:
Both UPC and MRI were calculated for ex-serving members with at least three GP visits in the 12 months before the reference date, ensuring sufficient data to accurately access continuity and regularity of care (Dreiher et al 2012). Both UPC and MRI result in scores ranging from 0 to 1. The UPC index was categorised into five groups: low (index range 0–0.49), moderate (0.5–0.74), high (0.75–0.99) and perfect (1) continuity and those without a UPC index categorised separately. For analysis, the UPC categories were then dichotomised into poor continuity (low and moderate) and high continuity (high and perfect). The MRI was categorised into quintiles (least to most regular), with an additional category for those without an MRI score. For analysis, the MRI quintiles were then dichotomised into poor regularity (quintiles 1–3) and high regularity (quintiles 4 and 5).