Sex and service status group
Suicide rates by sex and service status group
Overview
This section presents suicide rates, age-adjusted suicide rates and numbers of deaths by suicide between 1997 and 2022 broken down by the service status groups (permanent, reserve, and ex-serving). While the absolute number of deaths by suicide has increased since the previous report (due to the expansion of the monitoring period) the suicide rates remain similar, indicating that the overall patterns in suicide risk remain the same.
How do suicide rates vary by service status and sex?
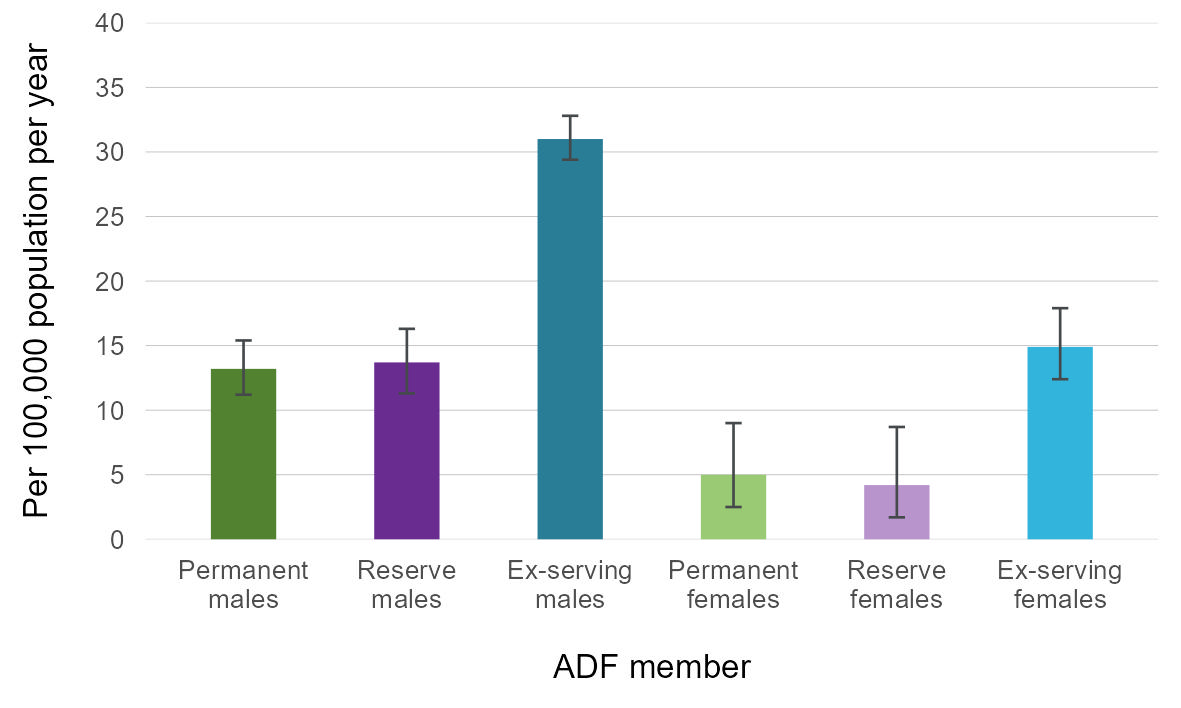
For those with service since 1985, the suicide rate was highest for ex-serving males. Suicide rates between 1997 and 2022 by service status and sex were as follows:
- 13.2 per 100,000 population per year for permanent males
- 13.7 per 100,000 population per year for reserve males
- 31.0 per 100,000 population per year for ex-serving males
- 5.0* per 100,000 population per year for permanent females
- 4.2* per 100,000 population per year for reserve females
- 14.9 per 100,000 population per year for ex-serving females.
Note: * Suicide rates denoted with a '*' should be interpreted with caution as the number of suicides is fewer than 20. These rates are subject to large fluctuations.
These rates are given in Figure 3 below. It is important to note that these groups are not homogeneous and there are other underlying factors contributing to these results other than service status and sex. The remainder of this report is dedicated to determining differences between subgroups of serving and ex-serving ADF members.
Figure 3: Suicide rate by service status group and sex, 1997–2022
Source: AIHW analysis of linked Defence historical personnel data–PMKeyS–NDI data 1985–2022.
How many ADF members died by suicide over the study period within each service status group?
Between 1997 and 2022 there were 1,763 deaths by suicide among members with ADF service since 1 January 1985. Of these, 1,464 occurred among ex-serving members, 174 among permanent members, and 125 among reserves. This is presented in Table 2.
| Group | Males | Females | Persons |
|---|---|---|---|
Serving | 163 | 11 | 174 |
Reserve | 118 | 7 | 125 |
Ex-serving | 1,343 | 121 | 1,464 |
All ADF Members | 1,624 | 139 | 1,763 |
Australian Population(a) | 52,963 | 16,061 | 69,024 |
Notes:
a. Number of deaths by suicide from all ADF members are included in the Australian population deaths by suicide count.
Source: AIHW analysis of linked Defence historical personnel data–PMKeyS–NDI data 1985–2022.
AIHW suicide and self-harm monitoring report data 1997–2022.
The number of deaths by suicide for permanent and reserve members combined and ex-serving members by year, is presented in Table 3. For the number of deaths by suicide for males and females by year see Supplementary table S2.3.
When interpreting Table 3, it is important to remember that the ex-serving population increases each year as described in Box 2. As such, the increase in ex-serving suicides across the years 1997 to 2022 is not indicative of any increase in suicide rate. See Figure 4 for suicide rates of ex-serving males and females over time. (For population sizes by year see Supplementary tables S11.2 to S11.4, see Data for a link to the tables).
| Year | Permanent and Reserve | Ex-serving | Total in all ADF service groups(a) |
|---|---|---|---|
1997 | 11 | 41 | 52 |
1998 | 13 | 55 | 68 |
1999 | 7 | 50 | 57 |
2000 | 16 | 48 | 64 |
2001 | 18 | 47 | 65 |
2002 | 14 | 37 | 51 |
2003 | 8 | 51 | 59 |
2004 | 12 | 44 | 56 |
2005 | n.p. | n.p. | 51 |
2006(b) | n.p. | n.p. | 42 |
2007(c) | 11 | 49 | 60 |
2008 | 8 | 50 | 58 |
2009 | 13 | 46 | 59 |
2010 | 13 | 63 | 76 |
2011 | 10 | 60 | 70 |
2012 | 7 | 55 | 62 |
2013 | 12 | 56 | 68 |
2014 | 12 | 66 | 78 |
2015 | 10 | 72 | 82 |
2016 | 15 | 74 | 89 |
2017 | 16 | 70 | 86 |
2018 | 6 | 71 | 77 |
2019 | 14 | 76 | 90 |
2020 | 12 | 78 | 90 |
2021 | 17 | 65 | 82 |
2022 | 13 | 58 | 71 |
Total | 299 | 1,464 | 1,763 |
Notes:
n.p. Not available for publication but included in totals where applicable, unless otherwise indicated. In this case this is a result of low numbers being potentially identifying.
- Consists of deaths by suicide in males and females for permanent, reserve, and ex-serving ADF members.
- From 2006 onwards, the ABS implemented a revisions process for coroner-certified deaths (such as suicides). This improved data quality by enabling additional deaths by suicide to be identified beyond initial processing (ABS 2018). For detailed information, see Technical notes.
- New ABS coding guidelines were applied for deaths registered from 1 January 2007. The new guidelines improve data quality by enabling deaths to be coded as suicide by ABS mortality coders if evidence indicates the death was from intentional self-harm (ABS 2018). For detailed information, see Technical notes.
Source: AIHW analysis of linked Defence historical personnel data–PMKeyS–NDI data 1985–2022.
How do suicide rates for permanent, reserve and ex-serving ADF members compare to the general population?
Comparisons of the suicide rate between ADF members and the general Australian population provide a sense of overall scale as well as an understanding of how suicide rates among ADF members have changed over time with respect to the trends in the general Australian population.
After adjusting for age (using Standardised Mortality Ratios (SMRs) to control for differences in age distributions) permanent and reserve males had a lower rate of suicide than the general Australian population. However, ex-serving males and females had a higher rate of suicide than the general Australian male and female population respectively.
Compared with the Australian male or female population (whichever is appropriate), age-adjusted suicide rates between 1997 and 2022 were:
- 47% lower for permanent males
- 45% lower for reserve males
- 26% higher for ex-serving males
- 100% higher (or 2.00 times) for ex-serving females.
The differences between the Australian female population and both permanent and reserve females were not statistically significant and are therefore not presented here (the differences listed above are statistically significant). While the 100% figure for ex-serving females is larger than the 26% figure for ex-serving males, it should be noted that these are both a comparison with the general Australian population adjusting for age and sex. The overall suicide rate for ex-serving females is significantly lower than it is for ex-serving males (as shown in Figure 2.1).
It is important to note that these groups are not homogeneous. There are other underlying factors contributing to these numbers which are explored throughout this report.
Unlike suicide rates, these SMRs cannot be used to compare suicide rates between service groups or across time. This is because each SMR is a measure that provides a comparison that is age-specific to the 2 populations involved, see Technical notes for further detail.
How have suicide rates changed over time for the different service status groups?
This section presents suicide rates over time. Due to suicide being a relatively rare event, small differences in numbers between years can have disproportionate influence on the population rate trends, making them difficult to interpret. To assist in overcoming this, the rates are presented as the aggregate of overlapping 3-year periods, increasing the number in each period and, thereby, reducing the volatility in the trend. Additionally, confidence intervals are presented to show the degree of statistical uncertainty around the rates and serve as a guiding caution in interpreting any trend over time.
Following the start of the monitoring period in 1997, there was a drop in the rate of suicide among ex-serving males, with the lowest rate recorded being in 2005-2007 (26.0 per 100,000 population per year). Since then, there was no consistent trend to 2014-2016. Over recent times, the suicide rate has been declining since 2014–2016 to 2020–2022 (33.3 to 27.6 deaths per 100,000 population per year). However, firm conclusions of a trend cannot be drawn as the period 2020–2022 includes preliminary deaths data that is likely to be adjusted upward by an unknown amount. See Technical notes.
There are no consistent trends in the suicide rates among permanent males, reserve males, and ex-serving females throughout the monitoring period due to the small number of suicide deaths each year. While fluctuating, the rates have stayed below those observed among ex-serving males throughout the period. The suicide rate per 100,000 population per year for the most recent 3-year period of 2020–2022 was 18.5 for permanent males, 13.4 for reserve males, and 12.6 for ex-serving females.
The interactive graph below (Figure 4) presents the suicide rates for males in each of the 3 ADF service status groups and ex-serving females, for all 3-year periods from 1997–1999 to 2020–2022. The rates of suicide for males and females for the Australian general population are presented in Figure 5 for reference.
Figure 4: Rate of suicide by service status and sex, 1997–1999 to 2020–2022
This time series line graph shows the weighted average suicide rate per 100,000 population per year by service status and sex over time by 3-year periods from 1997 to 1999, to 2020 to 2022.

This time series line graph shows the weighted average suicide rate per 100,000 population per year by service status and sex over time by year from 1997 to 2022.

How do suicide rates compare between ex-serving members with permanent service and reserve service?
Ex-serving ADF members may have served either in the permanent or reserve forces, or a combination of both over their ADF service career. The level of service duties and obligations vary greatly between the two, with permanent forces expected to render higher levels of service than reserves.
For this analysis, ex-serving members who were at any time engaged in permanent service will be considered ‘permanent ex-serving’, even if they were engaged in reserve service before fully separating. By contrast, those who joined and served solely in a reserve capacity will be considered ‘reserve ex-serving’.
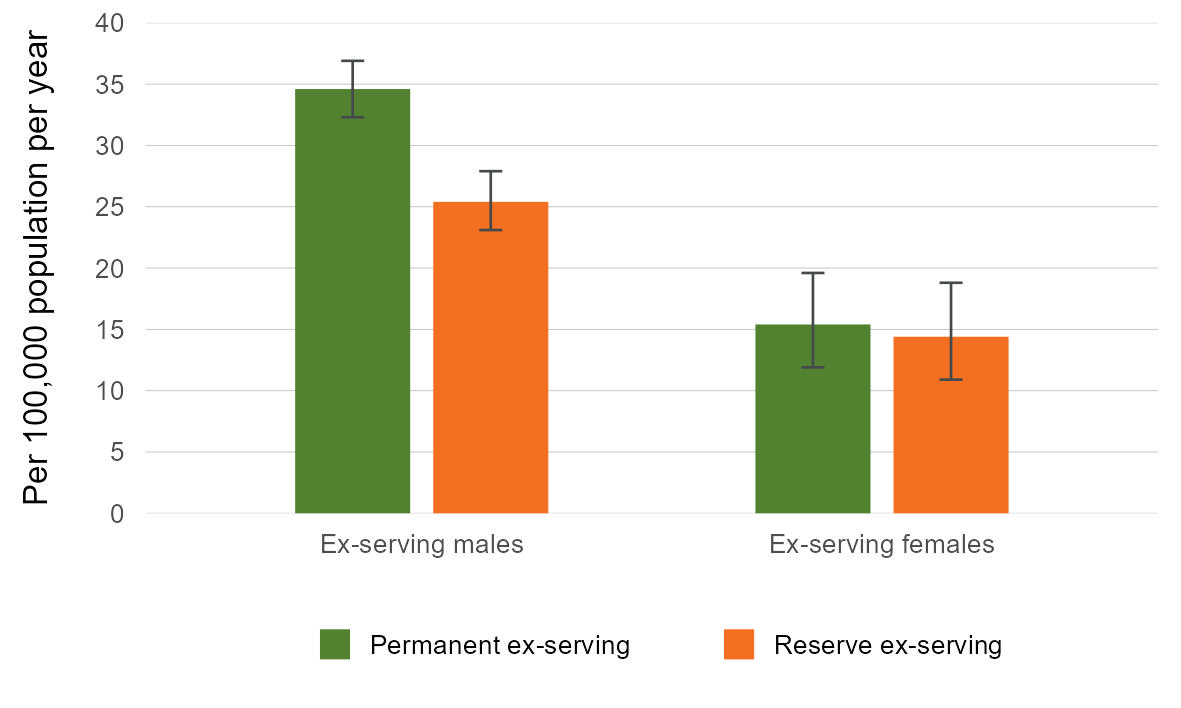
Between 1997 and 2022 the suicide rates for ex-serving ADF members were:
- 34.6 per 100,000 population per year for permanent ex-serving males
- 25.4 per 100,000 population per year for reserve ex-serving males
- 15.4 per 100,000 population per year for permanent ex-serving females
- 14.4 per 100,000 population per year for reserve ex-serving females.
These values are shown in Figure 6, which shows suicide rates are higher among permanent ex-serving males compared to reserve ex-serving males. There was no statistically significant difference in the suicide rates between permanent ex-serving females and reserve ex-serving females.
Figure 6: Suicide rates for permanent ex-serving and reserve ex-serving, males and females, 1997–2022
Source: AIHW analysis of linked Defence historical personnel data–PMKeyS–NDI data 1985–2022.
While overall, the rate of suicide is higher among permanent ex-serving males compared to reserve ex-serving males, this trend was only observed within the first 10 years of separation from the ADF. After 10 or more years after separation, there was no statistically significant difference in suicide rate between permanent ex-serving and reserve ex-serving males. See Time since separation (Figure 19).
Because of the:
- variation in suicide rates by prior service status over time after separation
- other potentially confounding factors such as reason for separation where the majority of involuntary medical separations are among permanent ex-serving members (96%)
- the relatively small number of suicides among the reserve ex-serving population when disaggregated by the various service-related characteristics, the permanent ex-serving and reserve ex-serving groups have been aggregated into ex-serving members in the remainder of this report.
For further analysis on the permanent ex-serving cohort including comparisons of suicide rates with the general Australian population and suicide rates by service-related characteristics, see Supplementary tables S10.1 to S10.3.
Data underlying this section are available in Supplementary tables S3.1 to S3.4, S4.1 and S4.2, S5.1 and S5.2, and S6.1. See Data for a link to the tables.
Please note, data for more recent years are subject to change: see Technical notes for further detail.
Help or support
If you need help or support, please contact:
- Open Arms – Veterans and Families Counselling – Phone: 1800 011 046
- Open Arms Suicide Intervention
- Defence All-hours Support Line (ASL) – Phone: 1800 628 036
- Defence Member and Family Helpline – Phone: 1800 624 608
- Defence Chaplaincy Support
- ADF Mental Health Services
- Lifeline – Phone: 13 11 14
- Suicide Call Back Service – Phone: 1300 659 467
- Beyond Blue Support Service – Phone: 1300 22 4636
For information on support provided by DVA, see: