In brief
Who we are and what we do
The Australian Institute of Health and Welfare (AIHW) is an independent corporate Commonwealth entity in the Health portfolio.
We develop, collect, analyse and report information from the national data collections of which we have custody, and from other credible data sources, in the following areas:
- health
- community services, including
- aged care services
- child care services
- child welfare services
- services for people with disability
- housing assistance.
We provide authoritative and timely information and analysis to governments, other organisations and the community in these subject areas.
We also provide national leadership and the necessary infrastructure for developing, maintaining and promoting information standards in health, welfare and housing assistance to ensure that data are nationally consistent and fit for purpose.
Our strategic directions—guiding the AIHW forward
- Further strengthen our policy relevance
- Improve the availability of information for the community and AIHW stakeholders
- Improve information quality, protecting privacy
- Capitalise on the contemporary information environment
- Cultivate and value a skilled, engaged and versatile workforce
We partner with our stakeholders
We work collaboratively
Collaborating with other entities is integral to the way the AIHW operates. Delivering on our mission—authoritative information to promote better health and wellbeing—would not be possible without strong relationships with our stakeholders. These relationships are built on the solid foundations of our enabling legislation and robust governance arrangements with a view to advancing the delivery of better health and welfare outcomes for Australians.
We engage closely with data providers and other stakeholders to understand their information needs and ensure data quality and integrity. We use their advice to help produce relevant and meaningful analyses that are useful for developing better policy and driving changes in service delivery. We do this through participation in national information committees and day-to-day interactions with data suppliers. These activities are crucial to promoting national consistency and comparability of data, and enhancing its quality and timeliness.
Our stakeholders
Our stakeholders are important to us—they are the various groups to which we are accountable, who fund us, or to which we target our products and services. They fall into one of more of these categories:
- the Australian Parliament and people of Australia
- the Australian Government and its departments and agencies; notably, the departments of Health, Social Services, Human Services, Education and Training, Prime Minister and Cabinet, Defence, and Veterans' Affairs; the Australian Bureau of Statistics; and various health and social services portfolio agencies
- state and territory governments and their departments with responsibilities for health, community services and justice
- health and welfare service providers, professionals and organisations
- the research community.
In particular, strong relationships with Australian Government and state and territory government agencies are critical to our activities. Much of the data collected and reported by the AIHW is provided to us by these agencies and relates to services they provide or fund. The AIHW works with relevant agencies to improve the timeliness and comparability of their information. Examples of agreements in place between the Institute and state and territory networks include those with: the Registrars of Births, Deaths and Marriages; the Australasian Juvenile Justice Administrators; and state and territory departments responsible for health, children and families, and prisoner health.
The AIHW also collaborates with selected Australian universities in specialist areas of data and information, and funds work carried out at these universities, supported by data-sharing agreements.
We deliver trusted data suited to policy needs
Our performance
The AIHW continued to improve its products and services during 2015-16.
We improved the availability of health and welfare information
We released 182 products (print and web) in areas as diverse as health expenditure, hospital statistics, vascular diseases and youth justice. We increased the range and variety of formats designed to make our products more accessible. Some of our more significant reports included:
- Australian Burden of Disease Study: impact and causes of illness and death in Australia 2011
- Educational outcomes for children in care: linking 2013 child protection and NAPLAN data
- National key performance indicators for Aboriginal and Torres Strait Islander primary health care: results from December 2014
- Housing assistance in Australia 2016 (web product)
- Cardiovascular disease, diabetes and chronic kidney disease—Australian facts: Aboriginal and Torres Strait Islander people.
Work was also completed on the AIHW's biennial reports:
- Australia's welfare 2015 was released in August 2015
- Australia's health 2016 was presented to the Minister for Health in June 2016 and tabled in September 2016 following commencement of the 45th Australian Parliament.
Our web products increasingly present our information in new ways, for example:

Around three-in-five households (59%) were homeless at the time of their allocation to public rental housing.
We completed 33 data linkage projects for academic researchers, research agencies and government departments as agreed under the National Collaborative Research Infrastructure Strategy.
We supplied data for a range of performance indicators in national agreements on health, housing and homelessness, disability and Indigenous reform.
We maintained a number of websites, such as: 
We improved the quality and timeliness of health and welfare information
Sixty per cent of our annual national collection releases were delivered in less than 1 year.
We enable access to our collections by external researchers following approvals by the AIHW Ethics Committee. There were 40 approvals this year.
We supported improved practices by data suppliers to validate data completeness and accuracy, including for homelessness data.

We promoted national standards in the provision and reporting of information through our METeOR information standards repository.

We also:
- achieved most of our performance deliverables and met most of our indicator targets or specified reference points listed in the 2015–16 Portfolio Budget Statements, as shown in our performance statement in Chapter 1 Our performance—those we did not meet are discussed in the performance statement
- lived within our financial resources
- complied with key legislative and regulatory requirements.
Further information about the products we produced in 2015–16 is provided in Chapter 2 Our products.
Our revenue is $48 million; 65% from clients
Our financial performance
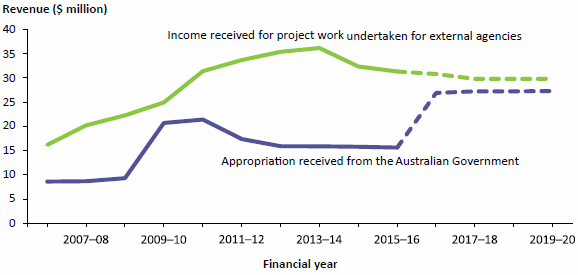
Both our revenue and expenditure fell slightly in 2015–16 while we maintained a small surplus. From 2016–17, our appropriation will increase due to the transfer of functions previously undertaken by the former National Health Performance Authority.
| Revenue | million |
|---|---|
| 2015–16 | $48.4 |
| 2014–15 | $49.2 |
| Expenditure | million |
|---|---|
| 2015–16 | $48 1 |
| 2014–15 | $48.7 |
| Surplus | million |
|---|---|
| 2015–16 | $0.3 |
| 2014–15 | $0.6 |
| Revenue split | 2015–16 |
|---|---|
| Appropriation | 32.3% |
| Clients | 64.7% |
| Interest and other | 3.0% |
| Assets minus liabilities (equity) | million |
|---|---|
| 2015–16 | $5.7 |
| 2014–15 | $5.3 |
Figure 1: Major revenue sources, 2006–07 to 2015–16, with projections, 2016–17 to 2019–20
Note: Data for this figure are available in Table A8.1.
Further information about the AIHW's financial performance is in 'Our financial performance' in Chapter 1 Our performance. The AIHW's financial statements are available in Appendix 9.
We released 182 reports/web products
Our communications
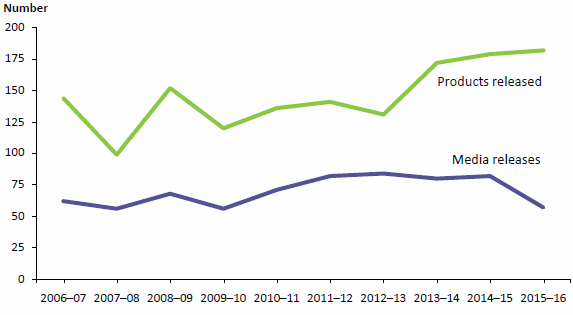
We aspire to communicate our data and analysis as widely as possible in free and accessible formats for all our stakeholders. We released slightly more products (print and web) than in the previous year. Fewer media releases were balanced by greater emphasis on engaging through social media, videos and graphical representations of statistics.
| Products | Number |
|---|---|
| 2015–16 | 182 |
| 2014–15 | 179 |
| Products 2015–16 | Number |
|---|---|
| Print ready reports | 120 |
| Web products | 62 |
| Web sessions | million |
|---|---|
| 2015–16 | 2.9 |
| 2014–15 | 2.7 |
| Media releases | Number |
|---|---|
| 2015–16 | 57 |
| 2014–15 | 82 |
| Media coverage | items |
|---|---|
| 2015–16 | 3,566 |
| 2014–15 | 4,173 |
Figure 2: Products released and media releases, 2006–07 to 2015–16
Note: Data for this figure are available in Table A8.2.
Further information about our reports, and online information and data, is in Chapter 3 Our communications. Product lists are in Appendix 2.
Our board reports through the Health Minister
Our organisation

The Hon.
Sussan Ley MP
The Australian Institute of Health and Welfare Act 1987 (AIHW Act; see Appendix 1) is our enabling legislation and establishes the AIHW Board as the Institute's governing body. The role and composition of the board are specified in section 8(1).
The board is accountable to the Parliament of Australia through the Minister for Health, and is responsible for setting the overall policy and strategic direction of the Institute. As at 30 June 2016, the Minister for Health and Aged Care was the Hon. Sussan Ley MP.
The Charter of Corporate Governance outlines the AIHW Board's structure, processes and responsibilities.
The Director of the AIHW manages the day-to-day affairs of the Institute with the assistance of an executive committee. Our staff operate within 8 organisational groups.
The Institute operates in accordance with the Public Governance, Performance and Accountability Act 2013 (PGPA Act). For planning purposes, it prepares a corporate plan and budget estimates as required by the PGPA Act. For reporting purposes, it prepares this annual report, which must include a set of annual financial statements and an annual performance statement, also as required by the PGPA Act.
Much of the work we undertake is subject to ethical clearance by the AIHW Ethics Committee, which is established by the AIHW Act.
Further information about how we operate is in Chapter 4 Our organisation.
We have 310 highly skilled staff
Our people
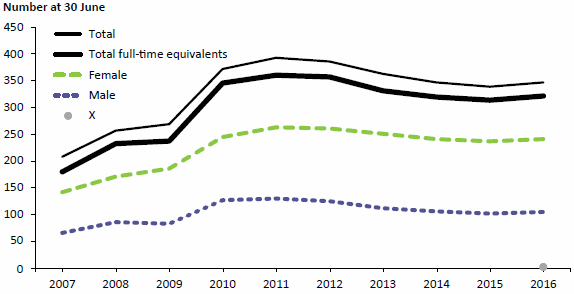
We strive to provide a workplace that offers fulfilling and challenging work, as well as promoting the professional and personal development of our employees. We rely on highly skilled and competent staff to support our strategic directions and work plan. The professionalism and expertise of our workforce have been prevailing constants throughout the AIHW's history. During 2015–16, we welcomed 20 staff from the former National Health Performance Authority (see the AIHW Director's report). Other than this, changes in staffing levels generally related to the requirements of project work undertaken for external agencies.
| Active staff | Individuals | Full-time equivalents |
|---|---|---|
| 30 June 2016 | 310 | 286 6 |
| 30 June 2015 | 308 | 284.8 |
| Active staff at 30 June 2016 | Individuals |
|---|---|
| Full-time | 225 |
| Part-time | 81 |
| Casual | 4 |
Figure 3: Staff numbers, 2007–2016
Note: Data for this figure are available in Table A8.3.
Further information about our staff, human resource services, facilities services and workplace health and safety is in Chapter 5 Our people.


