
Chapter 1 Our performance
Our activities are underpinned and guided by legislative and administrative requirements, contractual obligations and financial objectives. These include requirements to produce a corporate plan and Portfolio Budget Statements (PBS) each year, which outline our proposed activities and performance information.
This chapter encompasses our 2015–16 performance statement, which is the required manner for reporting on all performance criteria included in our corporate plan. It focuses on our performance in achieving our key performance indicators and expected major deliverables for the year.
The chapter also summarises our financial performance, which is detailed in our 2015–16 financial statements in Appendix 9, and our compliance with legislation on reporting.
Statement by accountable authority
Understanding our performance
The purpose of the Australian Institute of Health and Welfare (AIHW), are stated in the Australian Institute of Health and Welfare Corporate Plan 2015–16 to 2018–19 (corporate plan), as follows:
Purpose
Authoritative information and statistics to promote better health and wellbeing.
Role
We are committed to providing high-quality national health and welfare-related data and analysis across all relevant sectors, presented in meaningful and relevant ways and delivered in a timely manner. Accurate statistical information, comprehensive data development and high-quality analyses support an increased understanding of health and welfare issues. This evidence base is critical to good policymaking and effective service delivery, both of which have a direct impact on the lives of Australians.
We develop, collect, analyse and report information drawn from the national data collections for which we are custodians, and from other credible data sources.
We maintain close engagement with our data providers to ensure the quality and integrity of our work, to understand their information needs and to use their advice to help us produce relevant and meaningful analyses that are useful for developing better policy and driving changes in service delivery. All of this is conducted with a view to enabling the delivery of better health and welfare outcomes for Australians.
We also provide national leadership and the necessary infrastructure for developing, maintaining and promoting information standards in health, welfare and housing assistance to ensure that data are nationally consistent and fit for purpose.
We produce many public reports and actively promote our work to governments, other organisations and the community.
The AIHW's single outcome—that is, its intended impact on the Australian community, as stated in the 2015–16 PBS, is:
Outcome
A robust evidence base for the health, housing and community sectors, including through developing and disseminating comparable health and welfare information and statistics.
Our work provides governments, key stakeholders and the broader Australian community with valuable evidence and insights about key issues affecting the health and welfare of Australia's population. This can be crucial in informing difficult decisions on complex policy matters in these areas of vital national interest.
The information and data we publish, and otherwise make available, inform open debate and discussion at the national and jurisdictional level of significant issues aimed at securing a sustained increase in quality of life for Australians over time.
As the AIHW's work does not have a measurable direct impact on the health and welfare of the community, we assess the value of our work by the level of government, stakeholder and community confidence in, and use of, our products. External confidence in the AIHW is demonstrated by our exemplary reputation and acknowledgment of our achievements over many years. It is also reflected in the high level of engagement by other organisations with us, in terms of pursuit of joint endeavours and use of our services. Other ways to assess the value placed on our contribution are the level of our external funding and the volume and variety of commissioned project work.
Our achievements and valued contribution rest on our demonstrated record in providing information that is:
- authoritative, accurate and timely
- useful for governments, service providers and the community
- in formats that are useful to individual users.
We aim to continually build on and enhance our capabilities to ensure we are best meeting our statutory responsibilities and satisfying our stakeholders. This is reflected in our strategic directions (see 'Who we are and what we do'), taking into account the rapidly changing and competitive environment in which we operate (see the corporate plan, available at 'Australian Institute of Health and Welfare Corporate Plan 2015–16 to 2018–19'). Our single PBS program, as stated in the 2015–16 PBS, is:
Program
Develop, collect, analyse and report high-quality national health and welfare information and statistics for governments and the community.
Our performance criteria and results
In the corporate plan, we included the following 2 program objectives:
- improve the availability of health and welfare information
- improve the quality of health and welfare information.
These objectives were to be tested by 14 performance criteria of two types: 9 deliverables and 5 key performance indicators. The source for all these performance criteria is the 2015–16 PBS available at 'Australian Government 2015–16 Health Portfolio Budget Statements'. Some were to be measured in more than one way.
Our performance results
Our results against each performance criterion are detailed in tables 1.1–1.4, grouped by program objective and type of criterion. Comments are provided that give additional context or indicate where this may be found.
Deliverables contributing to improving data availability
Table 1.1: Results for 2015–16 performance criteria: deliverables contributing to improving the availability of health and welfare information
| Planned deliverable | Result | Performance | Comment |
|---|---|---|---|
| Present to the Minister for Health a new edition of: | ? | ? | ? |
|
We presented Australia's welfare 2015 and Australia's health 2016 by the due dates. | Achieved | Delivery of each of these reports is required by the Australian Institute of Health and Welfare Act 1987 (AIHW Act). |
| Release a range of information products relevant to key policy areas by 30 June 2016, including: | We released by 30 June 2016: | ? | All the products identified provide information relevant to areas of key public policy. |
|
|
Achieved | 'Indigenous primary health-care indicators' provides further information. |
|
|
Achieved | 'Interrelationships between cardiovascular disease, diabetes and chronic kidney disease in Indigenous Australians' provides further information. |
|
|
Achieved | Public and private hospitals at a glance provides further information. |
|
|
Achieved | This report was delivered ahead of schedule in May 2015. |
|
|
Achieved | We also released an analysis covering 25 years of health expenditure (see 'Growth in health expenditure'). |
|
? | ? | ? |
|
|
Achieved | ? |
|
|
Achieved | 'The current state of cervical screening: on the cusp of change' provides further information. |
|
We did not release by 30 June 2016:
|
Not achieved | This report is a new version relative to previous financial year reports, which includes new performance indicators for the screening program and data with different reference periods. Development of the report required more time. |
| Continue to operate the National Aged Care Data Clearinghouse to provide access to significant aged care collections, including by: | ? | ? | ? |
|
We received 48 requests and responded to 46 requests during the year; the remaining 2 were cancelled by the client. The median time for completion of requests was 18 days. | Achieved | ? |
|
We supplied data for the Steering Committee for the Review of Government Service Provision's Report on government services and for reporting on Residential aged care and Home Care as per agreed timetables. | Achieved | ? |
| Continue to operate the Data Integration Services Centre to undertake complex data integration (linkage) projects as agreed under the National Collaborative Research Infrastructure Strategy 2013, including by: | We completed data linkage services, including linkage of other data sets to Medicare Benefits Schedule and Pharmaceutical Benefits Scheme data, the National Death Index and the Australian Cancer Database, as agreed under the strategy for: | ? | Projects may be for academic researchers, government departments and research agencies. |
|
|
Achieved | We work to enhance our data linkage and analytical capabilities and methodologies.
Figure 1.4 shows trends. |
| Continue to operate the National Centre for Monitoring Vascular Diseases. | We released 10 products under centre arrangements. | Achieved | Appendix 2 lists these products under 'Vascular diseases'. |
| Improve the availability of information by releasing or completing at least: | We released or completed: | ? | ? |
|
|
Achieved | Figure 1.1 shows trends. |
|
|
Achieved | Figure 1.2 shows trends. |
|
|
Partly achieved | 'Requests for customised data analysis completed' explains this result. Figure 1.3 shows trends. |
-
In the 2015–16 PBS, for this deliverable, the 2014–15 year was inadvertently referenced rather than the intended 2013–14 year.
-
A product is a public release of data or information on a discrete topic occurring on a single day, which was not previously publicly available. It may be in the form of a written report, data tables or other communication products, including interactive web products.
Indicators of improving data availability
| Key performance indicator | Result | Performance | Comment |
|---|---|---|---|
| Collect, produce and release data and information that assist community understanding, policy purposes or research purposes, within privacy and confidentiality constraints, such that: | ? | ? | ? |
|
Ten of the 104 Essential Statistical Assets for Australia listed by the Australian Bureau of Statistics (ABS) relate to 15 AIHW data collections and cover fields as diverse as housing assistance, homelessness, perinatal health, disability, cancer, hospitals and hospital activity, alcohol and other drugs, and mortality. | ? | Appendix 6 lists AIHW data collections.
The Essential Statistical Assets for Australia are detailed at '1395.0 - Essential Statistical Assets for Australia, 2014'. |
|
We maintained our collections securely; there were no known data breaches. | Achieved | Chapter 4 provides more detail about our data security arrangements. All data releases fully complied with all privacy and confidentiality requirements. |
|
Our collections were enhanced, notably with the addition of Medicare Benefits Schedule and Pharmaceutical Benefits Schedule data. | Achieved | Enhancements, greater and smaller, occur whenever funding permits. |
|
Forty new external research projects were approved by the AIHW Ethics Committee. These projects—most involving data linkage—will be completed securely at the AIHW. | Achieved | Figure 4.2 shows trends. |
|
All our publications, including those about collections, are available free of charge as portable document format (PDF) documents on the AIHW's website. Increasingly, key publications are being made available in hypertext markup language (HTML) format and data are being made available in manipulatable formats, such as spread sheets, data cubes and similar components. | Achieved | Many statistical products are released with supplementary information as well as static reports with text, tables and figures. Figure 1.2 shows trends for statistical products released with manipulatable data. |
|
We actively participate in a range of national committees to identify information needs and to agree on and implement solutions.
We maintain relationships and/or agreements with a range of organisations. We actively contribute to the evidence base for policy and service delivery. |
Achieved |
Appendix 5 lists 88 committees in which we participate. Chapter 4 details organisations with which we have agreements. Chapter 2 Our products provides information on several specific products where we have met current and emerging information needs. |
| Provision of free, high-quality information measured by reaching at least: | All AIHW products are available free of charge at 'AIHW Website'.
We provided high-quality information, as demonstrated by: |
? | ? |
|
|
Not achieved | 'Australia's health downloads' explains this result, which was impacted by the double dissolution of the Australian Parliament. Figure 1.5 shows trends. |
|
|
Achieved | Figure 1.6 shows trends. |
|
|
Achieved | Figure 1.7 shows trends. |
|
|
Not achieved | 'Media references to the AIHW and its products' explains this result. Figure 1.8 shows trends. |
| Leadership in satisfying information-related development requested by the Australian Government and state and territory governments, such that there is: | ? | ? | ? |
|
We contribute through participation in key forums, such as the Deputy Secretaries Data Group and via the associated Data Champions network. These groups are key components of the new Australian Public Service (APS) data committee structure implemented through the public sector data management agenda established in 2015–16.
We remain a member of the National Statistical Service and an active participant in the Statistical Clearing House Advisory Forum. |
Achieved | ? |
|
We took a lead role in the development, coordination and supply of data for performance indicators in the COAG national agreements on health, housing and homelessness, disability, and Indigenous reform for publication in the Steering Committee for the Review of Government Service Provision's Report on government services and other publications. This included working with relevant working groups to agree defined indicator specifications, extraction of data, and provision of relevant data quality information to support performance reporting.
Selected indicator specifications are also made available via AIHW's online metadata register, METeOR. |
Achieved | The annual Report on government services provides information on the equity, effectiveness and efficiency of government services in Australia. The 2016 report was progressively released by the Productivity Commission after 27 January 2016.
Relevant working groups and committees—for example, the National Health Information and Performance Principal Committee— are among those listed in Appendix 5. See 'Improving performance through metadata' for information on METeOR. |
-
The figure for website visits excludes the METeOR, Specialist Homelessness Services, and Closing the Gap Clearinghouse websites.
Deliverables contributing to improving data quality
| Planned deliverable | Result | Performance | Comment |
|---|---|---|---|
| Perform high-quality data validation and support improved data validation practices by data suppliers by: | ? | ? | ? |
|
We completed data capture for these 4 collections for the first time using Validata®, resulting in improved data quality. | Achieved | ? |
| Finalise the data linkage phase of national reporting on the educational outcomes of children in child protection services. | We published information in Educational outcomes for children in care: linking 2013 child protection and NAPLAN data about the data linkage process undertaken. | Achieved | This linkage of data across the education and child protection sectors provides nationally comparable data for monitoring and reporting (see 'Educational outcomes for children in care: data linkage'). |
| Develop a data quality framework for housing and homelessness administrative data collections. | We developed a framework and commenced expansion into a more generic Quality Management Framework, which is now being applied to other administrative data collections we hold. | Achieved | A Quality Management Framework is internal infrastructure that enables development and ongoing monitoring of quality for collections. |
Indicators of improving data quality
| Key performance indicator | Result | Performance | Comment |
|---|---|---|---|
| Exemplify and promote the National Statistical Service Key Principles by ensuring that: | We exemplified and promoted the National Statistical Service Key Principles in our: | ? | ? |
|
|
Partly achieved | Transparent, proactively managed business processes, which improve the efficiency and effectiveness of our data management practices, are being introduced progressively across our data holdings. |
|
|
Partly achieved | Automation of repetitive business processes is being introduced progressively for managing our data and products and is gradually improving the timeliness of our data releases. |
| Improved timeliness of statistical information products measured by ensuring that: | For 25 AIHW annual national collection releases that occurred: | ? | ? |
|
|
Achieved | Figures 1.9 and 1.10 show trends and plot results. |
-
This relates to products that fully report or publicly release an annual national data collection that is collated by the AIHW.
Analysis of our performance results
Summary of our performance results for 2015–16
On the basis of the results in tables 1.1–1.4, the AIHW can be considered to have met its purpose.
All performance criteria were achieved, partly achieved or, where they were measured in several ways, were achieved for at least two measures.
Of our 14 performance criteria relating to our single purpose:
- 7 deliverables were met according to all measures—4 relating to the objective 'Improve the availability of health and welfare information' and 3 relating to the objective 'Improve the quality of health and welfare information'
- 2 deliverables were met for at least two measures—both relating to availability
- 3 key performance indicators were met according to all measures—2 relating to availability and 1 relating to quality
- 1 key performance indicator was met for at least two measures—relating to availability
- 1 key performance indicator was partly met—relating to quality.
Factors contributing to our performance
As described in greater detail in our corporate plan, the AIHW's environment encompasses:
- competing for business in a changing policy and operational environment, including:
- a reliance on external funding
- an uncertain institutional environment
- operating in a changing information environment, including need to:
- maintain the trust of data providers
- understand emerging data trends and issues
- enhance the use of data linkage
- respond to changing demands for information
- understand the policy and program environment
- protecting information through strong privacy and data security arrangements.
There were no changes to our purpose, activities or capabilities or to the environment in which we operate that had a significant impact on our performance during 2015–16. Change relating to the transfer of some of the functions of the former National Health Performance Authority did not have a significant impact on our performance during 2015–16.
Trends in performance results
Several quantitative measures of our performance criteria described in tables 1.1, 1.2 and 1.4 lend themselves to trend analysis and a more general discussion of results over time. At the same time, for those measures for which we did not achieve targets, the reasons are discussed.
Products released
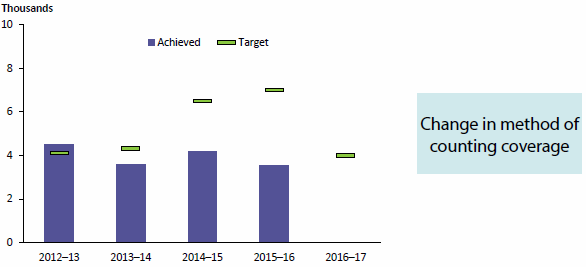
We have increased the number of products we release with some variability from year to year (Figure 1.1; see also Figure 2).
Figure 1.1: Products released, 2012–13 to 2015–16, with targets, 2012–13 to 2016–17
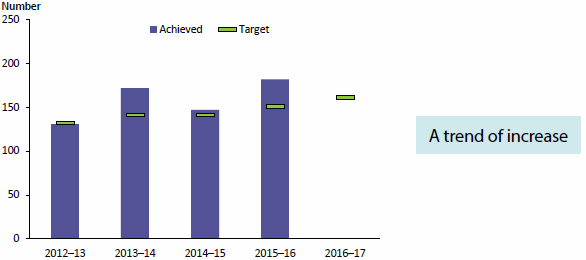
Note: Data for this figure are available in Table A8.4.
Statistical products released with manipulatable data
We have worked to increase the proportion of our statistical products that are available in formats that permit manipulation by users to produce the specific information they are looking for, in formats that are commonly available to them. Currently this indicator, which is a new one for the AIHW, shows that 54% of our statistical products were released with manipulatable data, compared with 50% in 2014–15 (Figure 1.2).
Figure 1.2: Proportion of statistical products released with manipulatable data, 2014–15 to 2015–16, with targets, 2015–16 to 2016–17
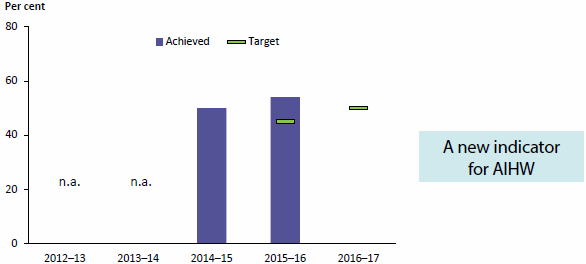
Note: Data for this figure are available in Table A8.5.
Requests for customised data analysis completed
We have worked to complete requests we receive for customised data analysis through our website application form. There was an increase in number of applications between 2013–14 and 2014–15. Our expectation was that applications would again increase; however, this proved incorrect (Figure 1.3). Demand decreased in 2015–16 and the number of requests completed reflects this drop. We set a lower target for 2016–17 and will review the indicator.
Figure 1.3: Requests for customised data analysis completed, 2013–14 to 2015–16, with targets, 2015–16 to 2016–17
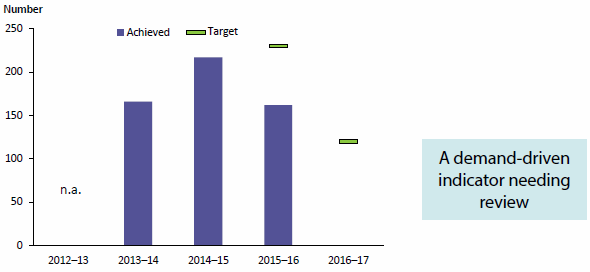
Note: Data for this figure are available in Table A8.6.
Requests for access to collections using data linkage, and projects completed
As well as requests for customised data analysis from external clients, some researchers ask us for the results of data linkages between their data collections and ours. In these cases, external researchers must submit project proposal applications for ethical clearance (see 'AIHW Ethics Committee') before being granted access to linkage results.
The AIHW Ethics Committee secretariat and relevant data custodians provide advice on how to progress applications. Trend information on the number of projects approved can be found in Figure 4.2 and, since 2012–13, has remained fairly steady at between 34 and 41 each year. Our expectation is that the number of applications will increase because the AIHW now has access to collections of Medicare Benefit Schedule and Pharmaceutical Benefit Schedule data not previously available.
Once approval is obtained, the AIHW undertakes the linkages in a secured environment on a cost recovery basis. In 2015–16, though we met our target of 30, the 33 projects completed fell from 38 in 2014–15, as we dealt with issues related to preparation of the new Medicare Benefit Schedule and Pharmaceutical Benefit Schedule data collections for linkage, as well as an increase in the complexity of the linkage required for individual projects. Trend information shows that, since 2013–14, the number of projects completed has decreased (Figure 1.4). However, our expectation is that the number of completed projects will increase as the arrangements for project approval and supply of data become more streamlined.
Figure 1.4: Requests for data linkage results completed, 2012–13 to 2015–16, with targets, 2014–15 to 2016–17
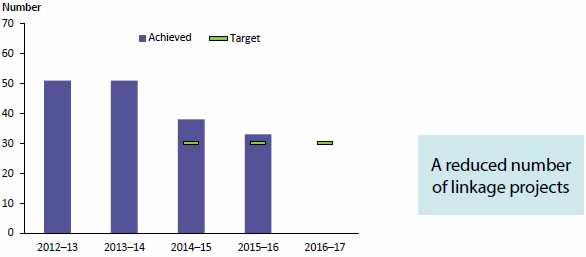
Note: Data for this figure are available in Table A8.7.
Examples of research that has been enabled by our provision of the data linkage results to external researchers can be found in Chapter 2 Our products.
Australia's health downloads
Australia's health is Australia's premier report card on the health of Australians and their health system. The large number of downloads of this publication reflects its value to users as a compilation of information from our data collections and those of other organisations; making the information available to Australians in useful compendiums released every 2 years. The number of annual downloads is expected to show some periodicity due to biennial release but also a general rise reflecting our efforts to make this document an indispensable national resource. We set our target for 2015–16 in expectation of a high volume of downloads in June 2016, when it was expected to be tabled in the Australian Parliament. Due to the double dissolution of the parliament, tabling was not possible in 2015–16 and the target was not reached (Figure 1.5). Tabling and release occurred in September 2016.
Figure 1.5: Australia's health downloads, 2012–13 to 2015–16, with targets, 2012–13 to 2016–17
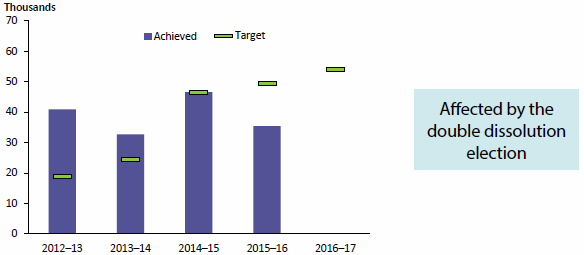
Note: Data for this figure are available in Table A8.8.
Australia's welfare downloads
Our expectations for Australia's welfare downloads are similar to those for Australia's health as Australia's welfare is also released biennially and the trends show a pattern of periodicity and increase (Figure 1.6).
Figure 1.6: Australia's welfare downloads, 2012–13 to 2015–16, with targets, 2012–13 to 2016–17
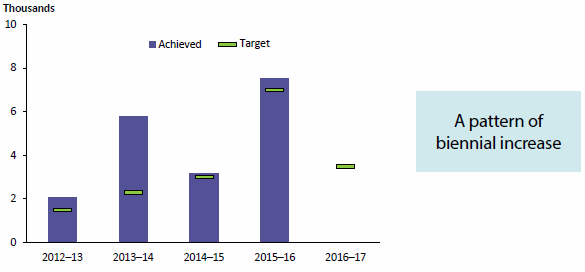
Note: Data for this figure are available in Table A8.9.
AIHW website sessions
We work to provide free, high-quality information through our website. The number of downloads reflect our success in making our data collections and information we report about them, available to Australians in interesting and diverse formats. The pattern shown is one of steady increase (Figure 1.7; see also Figure 3.1).
Figure 1.7: AIHW website sessions, 2012–13 to 2015–16, with targets, 2012–13 to 2016–17
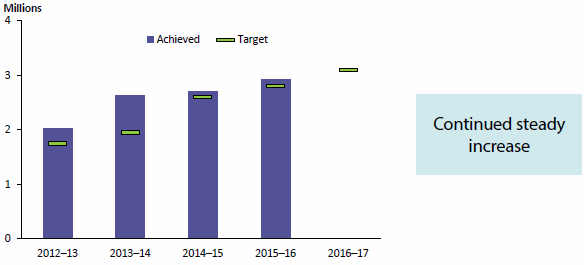
Note: Data for this figure are available in Table A8.10.
Media references to the AIHW and its products
We issue media releases highlighting many of our products at the time of their release. The media references generated can also drive community debate about the information we produce. However, the number of media releases fell in the last year from 82 in 2014–15 to 57 in 2015–16, reflecting our increased focus on engaging more directly with the wider community through social media, videos and graphical representations of statistics (see Figure 2). There has also been a fall from 2014–15 of 14.5% in media mentions—down to 3,566 items (Figure 1.8; see also Table 3.3).
Media references have varied between 3,500 and 4,500 in each of the last 4 years and we have not reached all of our targets. As explained in last year's annual report, since we set the targets for 2014–15 and 2015–16 used in the PBS in May 2015, we changed how we count media coverage to provide a better picture of coverage of unique news stories by excluding estimates of syndicated coverage. The target for 2016–17 has been reset to account for this change.
Figure 1.8: Media references to the AIHW and its products, 2012–13 to 2015–16, with targets, 2012–13 to 2016–17
Note: Data for this figure are available in Table A8.11.
Collections reported within a year of the collection period
Since 2011–12, we have been working to improve the timeliness of our statistical information products. The elapsed time to release of these products includes:
- time taken by data providers, after the end of the collection period, to prepare administrative data for supply to us
- time taken by us to prepare data for release—ensuring that the statistics and analyses are of the quality and accuracy required for broader dissemination and publication.
We work with data providers to introduce systems that assist them in providing data more quickly. For example, using the AIHW's Validata® application, data providers can validate the data they supply more easily and quickly. Together with our own efforts to reduce time taken to release data, this allows us to report earlier in the collection cycle than in previous years for those collections. In previous annual reports, we have noted that the average number of days to release has fallen progressively over recent years.
Our indicator of the timeliness of our statistical information products relates to the length of time between the end of the data collection period and the release of annual publications that fully report or publicly release national data collections that we collate. Publications produced by AIHW collaborating centres are not included. The indicator shows a pattern of improvement in the proportion of collections reporting within a year (Figure 1.9). There has been marked improvement for some collections (Figure 1.10).
Figure 1.9: Proportion of collections reported within a year of the collection period, 2012–13 to 2015–16, with targets, 2014–15 to 2016–17
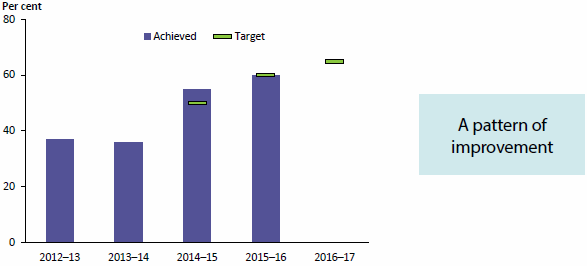
Note: Data for this figure are available in Table A8.12.
Figure 1.10: Distribution of time to release for annual national data collections, 2011–12 to 2015–16
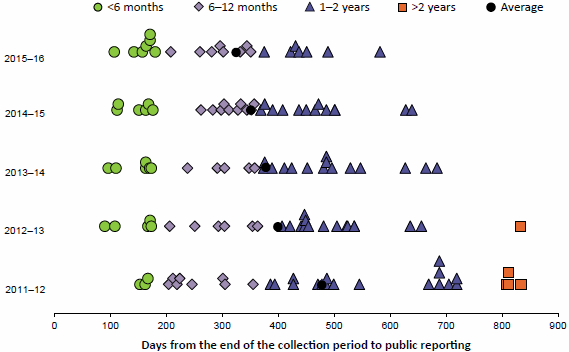
Note: Data for this table are available in Table A8.13.
Improving performance through metadata
We help other agencies to manage their metadata (or information about data) for a particular sector or subject area using METeOR—the AIHW's online metadata registry. Over recent years, there has been a marked increase in the number of agencies that have chosen to use METeOR as their metadata repository and become Registration Authorities. Nominated Registration Authorities include several that are supported by national ministerial council processes. For example, the Health Registration Authority is underpinned by the Australian Health Ministers' Advisory Council. Individual government agencies have been set up as Registration Authorities to register, develop and endorse their own metadata, supported by the high-quality structures and processes within METeOR.
METeOR is available at 'METeOR home'. The advanced search page in METeOR which has a list of all the Registration Authorities is available at 'Search registry'.
In 2015–16, we improved the quality and timeliness of information held by us and others by:
- promoting national standards in the provision and reporting of information through our METeOR information standards repository, where:
- the National health data dictionary and the National housing and homelessness data dictionary were both updated on a regular basis throughout the year
- 1,785 metadata items were made standard or endorsed in METeOR
- 444 metadata items were superseded, retired or archived.
Our financial performance
Results
The AIHW's financial results since 2011–12 are summarised in Table 1.5.
Table 1.5: Financial results, 2011–12 to 2015–16 ($ million)
| Financial results | 2011–12 | 2012–13 | 2013–14 | 2014–15 | Change 2014–15 to 2015–16 |
2015–16 |
|---|---|---|---|---|---|---|
| Income | 52.237 | 52.225 | 52.982 | 49.240 | Decrease | 48.401 |
| Expenditure | 54.086 | 51.822 | 52.926 | 48.671 | Decrease | 48.135 |
| Surplus (or deficit) | (1.849) | 0.403 | 0.056 | 0.569 | Decrease | 0.266 |
| Total assets | 31.848 | 33.752 | 37.200 | 42.119 | Increase | 42.612 |
| Total liabilities | 27.578 | 29.079 | 32.471 | 36.821 | Increase | 36.926 |
| Total equity | 4.270 | 4.673 | 4.729 | 5.298 | Increase | 5.686 |
Income and expenditure
Figure 1 shows the relative importance of our two main income types over time—appropriation income from the Australian Parliament and income from externally funded projects—including budgeted revenue for the next 4 years.
Due to the annual whole-of-Australian Government efficiency dividend, our appropriation income from the Australian Parliament fell to $15.625 million in 2015–16, compared with $15.8 million in 2014–15 (Table 1.6 and Figure 1.11).
Due to funding ceasing for a small number of large projects, income from externally funded projects fell to $31.3 million in 2015–16 from $32.4 million in 2014–15—a decrease of 3.2%. Most of this income came from Australian Government departments, with the largest funder being the Department of Health.
Interest income rose to $759,000 in 2015–16 from $682,000 in 2014–15.
Employee-related expenditure fell to $33.8 million in 2015–16 from $35.1 million in 2014–15. This was because fewer staff were needed to complete externally funded projects.
The overall result for the year was a surplus of $266,000.
Table 1.6: Income and expenditure, 2011–12 to 2015–16 ($ million)
| Income and expenditure | 2011–12 | 2012–13 | 2013–14 | 2014–15 | Change 2014–15 to 2015–16 |
2015–16 |
|---|---|---|---|---|---|---|
| Appropriation revenue | 17.389 | 15.912 | 15.898 | 15.800 | Decrease | 15.625 |
| Revenue for project work for external agencies | 33.690 | 35.410 | 36.176 | 32.365 | Decrease | 31.334 |
| Interest | 1.138 | 0.897 | 0.890 | 0.682 | Increase | 0.759 |
| Other revenue | 0.020 | 0.006 | 0.018 | 0.394 | Increase | 0.683 |
| Total revenue | 52.237 | 52.225 | 52.982 | 49.240 | Decrease | 48.401 |
| Employee-related expenditure | 36.028 | 36.910 | 36.173 | 35.054 | Decrease | 33.817 |
| Other expenditure | 18.058 | 14.912 | 16.753 | 13.617 | Increase | 14.318 |
| Total expenditure | 54.086 | 51.822 | 52.926 | 48.671 | Decrease | 48.135 |
| Surplus (or deficit) | (1.849) | 0.403 | 0.056 | 0.569 | Decrease | 0.266 |
Figure 1.11: Revenue sources, 2006–07 to 2015–16
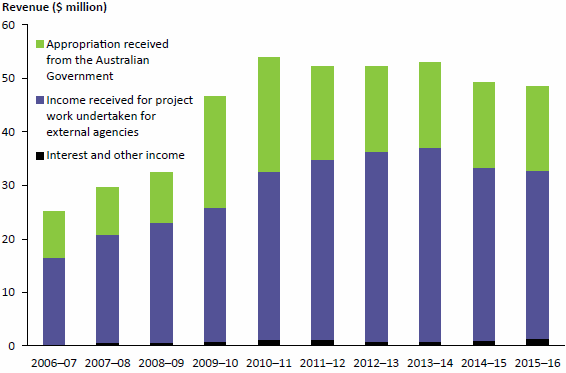
Note: Data for this figure are available in Table A8.14.
Balance sheet
Assets totalled $42.6 million in 2015–16—a rise of $0.5 million on the previous year (Table 1.7). The cash balance component of financial assets remains high at $27.2 million, most of which is invested in term deposits in accordance with our investment policy.
Liabilities rose by $0.1 million to $36.9 million in 2015–16 from $36.8 million in 2014–15. This increase relates entirely to an increase in income received in advance.
Overall, total equity increased to $5.7 million, from $5.3 million the previous year.
Table 1.7: Balance sheet summary, 2011–12 to 2015–16 ($ million)
| Balance sheet summary | 2011–12 | 2012–13 | 2013–14 | 2014–15 | Change 2014–15 to 2015–16 |
2015–16 |
|---|---|---|---|---|---|---|
| Financial assets | 29.240 | 31.590 | 26.821 | 32.420 | Increase | 33.655 |
| Non-financial assets | 2.608 | 2.162 | 10.379 | 9.699 | Decrease | 8.957 |
| Total assets | 31.848 | 33.752 | 37.200 | 42.119 | Increase | 42.612 |
| Provisions | 10.262 | 11.164 | 10.967 | 11.082 | Increase | 11.817 |
| Payables | 17.316 | 17.915 | 21.504 | 25.739 | Decrease | 25.109 |
| Total liabilities | 27.578 | 29.079 | 32.471 | 36.821 | Increase | 36.926 |
| Equity | 4.270 | 4.673 | 4.729 | 5.298 | Increase | 5.686 |
Cash flow
Net cash received in 2015–16 from operating activities was $1.6 million. This related mainly to income received in advance at the end of year. We spent a net amount of $0.4 million on the purchase of property, plant and equipment, and leasehold improvements in 2015–16, compared with $0.2 million in 2014–15.
The net cash increase over the year was $1.7 million, increasing the cash balance to $27.2 million from $25.6 million (see the 'Cash flow statement for the period ended 30 June 2016' in Appendix 9).
Financial outlook
Our appropriation income from the Australian Parliament will increase substantially in 2016–17 because of the transfer of responsibilities from the National Health and Performance Authority (NHPA). This will be slightly offset by whole-of-Australian Government efficiencies. We have budgeted for income from externally funded projects to be approximately $31.0 million (see Figure 1).
Our total expenditure in 2016–17 is expected to be higher than for 2015–16 due to the transfer of the NHPA functions. We are also expecting an increase in staff numbers. We have budgeted to break even in 2016–17, before an accrual of $442,000 required by compliance with relevant accounting standards in relation to the AIHW's new office lease. We have obtained approval from the Department of Finance to run a loss to cover this accrual for at least the next 2 years. This will have no effect on cash balances and will reverse over the lifetime of the lease.
The value of our land and buildings is expected to fall in 2016–17 due to depreciation of fit-out costs, which will continue over the term of the lease. We do not expect other significant changes in the balance sheet items.
Auditor-General's report
The Australian National Audit Office conducts an annual audit of our financial statements. The auditors issued an unqualified audit opinion that the financial statements for 2015–16 were appropriately prepared and give a 'true and fair view' of our financial position (see the auditor's report).
Our compliance with legislation on reporting
We complied with the key legislative and regulatory requirements that must be reported in this annual report. Information may be found on:
- the Work Health and Safety Act 2011 and the Environment Protection and Biodiversity Conservation Act 1999 in Chapter 5 Our people
- other specific matters required to be reported by legislation in Appendix 7.
The 'Compliance index' provides more details about the sources of the various compliance requirements.