Chapter 2 Our products
This chapter highlights some of our products released in 2015–16.
The AIHW offers a broad variety of data and information-related products and services covering a wide range of health and welfare topics.
This chapter provides highlights from a sample of products released in 2015–16. For more information about each topic please refer to the full report or web product.
Our products
Final results from the Australian Burden of Disease Study 2011
The Australian Burden of Disease Study: impact and causes of illness and death in Australia 2011 is an important resource for health policy formulation and service planning, and for monitoring population health. Burden of disease analysis combines information from multiple data sources to count and compare the total fatal and non-fatal health loss from diseases and injuries in a population, and its attribution to specific risk factors.
Undertaken for the first time in 8 years the report provides updated estimates for the Australian population and the Aboriginal and Torres Strait Islander population for over 200 diseases and injuries and 29 risk factors. The study incorporates methodological developments from recent global studies, adapted for the Australian health policy context.
The study reports that chronic diseases such as cancer (19%), cardiovascular diseases (15%), mental and substance use disorders (12%) and musculoskeletal conditions (12%), along with injuries (9%), contributed the most burden in 2011 (Figure 2.1). Almost one-third (31%) of the burden was due to the modifiable risk factors included in the study.
Figure 2.1: Disease burden, by disease group and sex, 2011
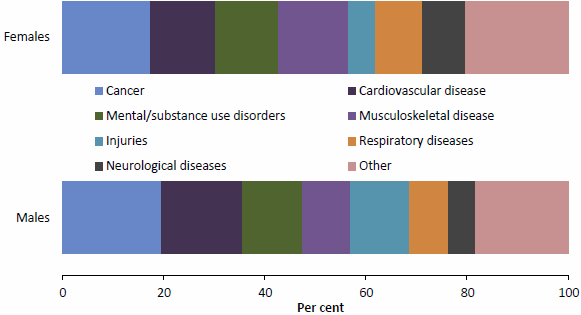
Note: Data for this figure are available in Table A8.15.
During the study, we have been building infrastructure that enables efficient updates of burden of disease estimates as well as more detailed analysis for particular diseases and risk factors, and other extensions. For example, projects are underway to model diseases as risk factors for other diseases (such as, diabetes as a risk factor for coronary heart disease).
The report is available at 'Australian Burden of Disease Study: impact and causes of illness and death in Australia 2011'.
Educational outcomes for children in care: data linkage
Data linkage brings together information about people, places and events from different data collections based on common features. Linking of data provides a more comprehensive picture of a subject, and is one of the most powerful ways of adding value to the data already held by many organisations. We have a strong record in data linkage—or data integration—both in our own work and in facilitating the work of other researchers. The AIHW has been accredited as 1 of 3 Integrating Authorities for the integration of Commonwealth data—meaning that the Institute has met stringent criteria covering project governance, capability, data management, and the protection of privacy and confidentiality.
Limited national information has been available on the educational outcomes for children in care. We aimed to break new ground exploring the academic performance of children in care when we linked data from the Child Protection National Minimum Data Set and the National Assessment Program—Literacy and Numeracy (NAPLAN). Over 3,500 children in care (aged between 7 and 17) from 6 states and territories (New South Wales, Victoria, Western Australia, Tasmania, Australian Capital Territory and Northern Territory) were included in the linkage.
NAPLAN assesses Year 3, 5, 7 and 9 students in 5 domains—reading, writing, spelling, grammar and punctuation, and numeracy skills—against agreed national minimum standards. Children whose scores fall below these benchmarks are likely to have difficulty making satisfactory progress at school.
The report showed that across the assessment domains and 4 year levels, 44%-83% of children in care achieved the benchmarks, while 17%–56% did not. The proportions of children who achieved the benchmarks were lower among older children in care—74%–82% for Year 3 students and 44%-69% for Year 9 students.
Compared with all children, the results for children in care were 13–30 percentage points lower across the literacy and numeracy assessment domains. This gap was bigger for Year 9 students (24 and 30 percentage points for reading and numeracy respectively) relative to Year 3 students (13 and 15) (Figure 2.2).
Figure 2.2: National minimum standards achievement among Year 3, 5, 7 and 9 students for the NAPLAN reading and numeracy assessment domains, 2013
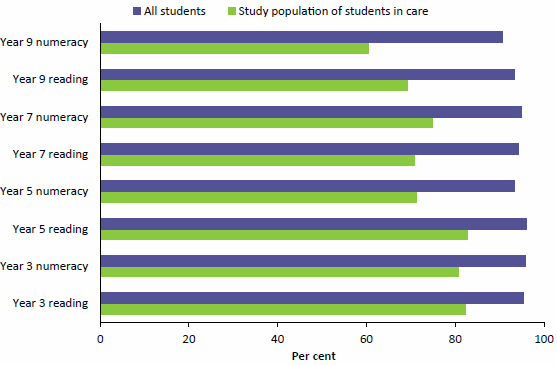
Note: Data for this figure are available in Table A8.16.
Note that academic achievement by children in care is likely to be affected by complex personal histories and multiple forms of disadvantage, including poverty, maltreatment, family dysfunction and instability in care and schooling.
The report is available at 'Educational outcomes for children in care: linking 2013 child protection and NAPLAN data'.
Linking child protection and youth justice supervision data
Research shows that children and young people who have been abused or neglected are at greater risk of engaging in criminal activity and entering the youth justice system. With the recent introduction of a national unit record child protection data collection, we are able to link child protection and youth justice supervision data to explore the relationships between the two.
Young people in child protection and under youth justice supervision 2013–14 presents information on young people aged 10–17 who, in 2013–14, were involved in the child protection system and were subject to a youth justice supervision order. Linked data from two separate collections available from four states and territories were used.
From the records of nearly 17,000 young people who were involved in the child protection system or under youth justice supervision at some time during 2013–14 in Victoria, South Australia, Tasmania and the Australian Capital Territory, we were able to show that about 5% were in both the child protection system and under youth justice supervision (Figure 2.3).
Figure 2.3: Overlap of young people in child protection and youth justice supervision, 2013–14
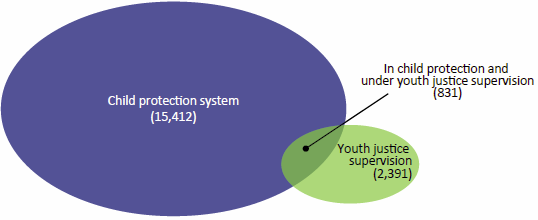
The data linkage showed that:
- almost half (45%) of those in detention were also involved in the child protection system—23 times the rate for the general population
- about one-third (34%) of those under community-based supervision were also involved in the child protection system
- about 8% of those who were the subject of a care and protection order were also under youth justice supervision in the same year—although not necessarily at the same time—compared with just 0.3% of the general population aged 10–17.
We will extend the results from the linked data collection over time as data become available for more states and territories to gain a better understanding of the characteristics and pathways of children and young people who are both in the child protection system and under youth justice supervision. This will assist support staff, case workers and policymakers to achieve the best possible outcomes for these children and young people.
The report is available at 'Young people in child protection and under youth justice supervision 2013–14'.
Results of a survey of children and young people in out-of-home care
In the bulletin The views of children and young people in out-of-home care: overview of indicator results from a pilot national survey 2015 we present results from a new national survey collected as part of state and territory local case management processes during February to June 2015. The responses of 2,083 children aged 8–17 who were under the care of appropriate government authorities, such as the relevant minister or departmental chief executive, in the eight states and territories are reported against 8 indicators under the National Standards for Out-of-Home Care.
Key findings reported by the surveyed children include:
- more than 9 in 10 (91%) felt both safe and settled in their current placement
- two-thirds (67%) usually get to have a say in what happens to them, and people usually listen to what they say
- most (94%) felt close to at least one family group—the people they live with now, family members they do not live with, or both
- most (97%) had an adult who cares about what happens to them now and in the future
- many (87%) received adequate support to participate in sport, community or cultural activities from their carer or someone else
- more than half of those aged 15–17 (58%) were getting as much help as they needed to make decisions about their future.
This pilot survey provides valuable information on how local case management processes can be used to give children in care a voice.
The bulletin is available at 'The views of children and young people in out-of-home care: overview of indicator results from a pilot national survey 2015' and is complemented by more detailed data at 'National framework for protecting Australia’s children'.
Analysing medication use by prisoners
Medication use by Australia's prisoners 2015: how is it different from the general community? compares medications taken by prisoners with people in the general community (for example, Figure 2.4).
The poor health and complex health needs of prisoners are reflected in the number and types of medications they take—prisoners were more likely than those in the general community to be taking medication for health problems including mental health issues, addictions and chronic conditions. Contextual information from a focus group of prison health professionals is used to discuss some of the differences between prescribing in a prison and in the general community.
The bulletin is available at 'Medication use by Australia's prisoners 2015: how is it different from the general community?'.
Figure 2.4: Use of antidepressants, analgesics and antipsychotics by prisoners, compared with the general population, 2015
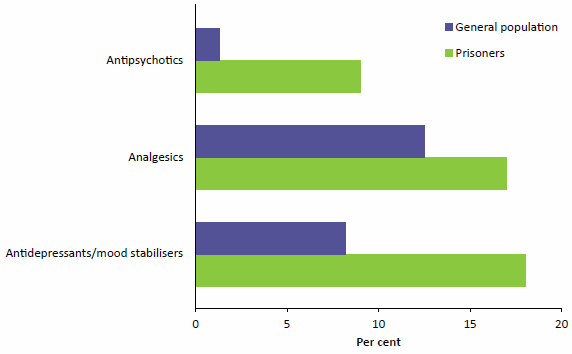
Note: Data for this figure are available in Table A8.17, where margin of error data are shown.
Decrease in neural tube defects since folic acid was added to bread
In 2015–16, we reported on the health impacts of mandatory fortification of bread with the nutrients: folic acid in Australia; and iodine in Australia and New Zealand. Adding folic acid to the diet of Australians aimed to reduce the prevalence of neural tube defects—serious birth defects—while adding iodine aimed to stem the re-emergence of iodine deficiency.
The report followed a framework with a step-wise progression from the policy change to the policy objective. After mandatory fortification, there were increased levels of folic acid and iodine in the food supply and increased intakes among the population. The rate of neural tube defects in Australia significantly decreased, with the largest decreases occurring among teenagers and Aboriginal and Torres Strait Islander women (Table 2.1). In Australia, the re-emergence of iodine deficiency was mitigated. In New Zealand, several small surveys have shown improvement in iodine intakes.
Table 2.1: Key mandatory folic acid fortification health outcomes in Australia
| Key monitoring question | Pre-mandatory fortification |
Post-mandatory fortification |
Outcome |
|---|---|---|---|
| Has folic acid increased in our food supply? | ? | ? | ? |
| Mean folic acid level of bread | 20-29 μg/100 g | 134-200 μg/100 g | Desired outcome achieved |
| Are food industries complying with mandatory requirements? | Not applicable | Mills and baking businesses have systems in place to ensure compliance | Desired outcome achieved |
| Have folic acid intakes increased? | ? | ? | ? |
| Mean folic acid intakes in women aged 16-44 | 102 μg/day | 247 μg/day (142% increase) |
Desired outcome achieved |
| Has the folate status improved? | ? | ? | ? |
| Mean red blood cell folate in women aged 16-44 | No adequate red blood cell folate baseline data available | All women: 1,647 nmol/L
Pregnant women: 1,958 nmol/L |
Not applicable: data did not support an overall assessment or a rating was not appropriate |
| Has the incidence of neural tube defects (NTDs) decreased? | ? | ? | ? |
| NTD incidence per 10,000 conceptions that resulted in a birth | Total study population
All women: 10.2 Indigenous women: 19.6 |
Total study population
All women: 8.7 (14% decrease) |
Desired outcome achieved |
| Does mandatory folic acid fortification result in adverse population health effects? | ? | ? | ? |
| Proportion of the population with folic acid intakes above the upper level of intake | Women aged 16-44: 0%
Persons aged 19 and over: 0% |
Women aged 16-44: 0%
Persons aged 19 and over: <1% |
Not applicable: data did not support an overall assessment or a rating was not appropriate |
| Cancer and all-cause mortality | ? | No increase in cancer or all-cause mortality can be directly associated with increase in folic acid intakes in adults | Desired outcome achieved |
Source: AIHW 2016. Monitoring the health impacts of mandatory folic acid and iodine fortification. Cat. no. PHE 208. Canberra: AIHW.
Monitoring the health impacts of mandatory folic acid and iodine fortification forms part of an independent review of the mandatory fortification requirements and illustrates the benefits of collaborating with stakeholders to develop a logical assessment framework and synthesising data and literature to monitor the health impacts of policy.
The report is available at 'Monitoring the health impacts of mandatory folic acid and iodine fortification 2016'.
Interrelationships between cardiovascular disease, diabetes and chronic kidney disease in Indigenous Australians
In Cardiovascular disease, diabetes and chronic kidney disease—Australian facts: Aboriginal and Torres Strait Islander people we highlight that Aboriginal and Torres Strait Islander people are disproportionately affected by these three chronic diseases compared with non-Indigenous Australians. They appear earlier, progress faster, present more often alongside other chronic diseases and result in higher hospitalisation and death rates.
Compared with non-Indigenous Australians, Indigenous Australians:
- had higher rates of risk factors for these conditions—being 2.6 times as likely to smoke daily, 1.2 times as likely to be overweight or obese, and 1.2 times as likely to have high blood pressure
- had a higher rate of cardiovascular disease (CVD)—27% compared with 21% for non-Indigenous adults—3.5 times the prevalence of diabetes (see Figure 2.5 for age-specific differences in prevalence rates) and 4 times the prevalence of chronic kidney disease (CKD)
- were more likely to have 2 or more of these diseases concurrently—38% for Indigenous compared with 26% for non-Indigenous Australians
- had higher rates of hospitalisation—almost twice as high for CVD, 1.4 times as high for diabetes and 5 times as high for CKD (excluding dialysis)
- were hospitalised earlier for CVD—52% were aged under 55 when hospitalised compared with 17% among non-Indigenous Australians
- had higher death rates—1.5 times as high for CVD, 4 times as high for diabetes and 3 times as high for CKD.
These data highlight the magnitude of inequalities in chronic diseases in the population. Ongoing monitoring of these diseases will help drive positive change by informing policy frameworks and programs seeking to improve chronic disease detection and management.
The report is available at 'Cardiovascular disease, diabetes and chronic kidney disease—Australian facts: Aboriginal and Torres Strait Islander people'.
Figure 2.5: Prevalence of diabetes among persons aged 18 and over, by Indigenous status and age, 2011–13
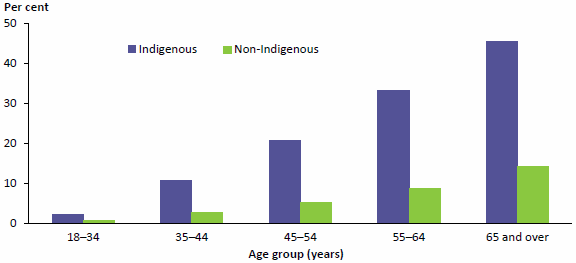
Note: Data for this figure are available in Table A8.18, where confidence intervals are shown.
The current state of cervical screening: on the cusp of change
Cervical screening will be undergoing a major change next year, with a new National Cervical Screening Program (NCSP) set to start on 1 May 2017 using a human papillomavirus (HPV) test as its primary screening test. This is a major difference to the way women have been screened for cervical abnormalities and cancer to date, which has used the Pap test.
This change is in response to the need for the NCSP to adapt to a new environment, including a greater understanding of the role HPV plays in cervical cancer, and the introduction of the National HPV Vaccination Program in 2007. The latter—by protecting vaccinated women from infection with specific types of HPV—aims to reduce cervical abnormalities and eventually cervical cancers.
The AIHW monitors the NCSP on an annual basis. While this reporting has always been important for monitoring the performance of the NCSP, these data now also serve the purpose of setting benchmarks prior to this change in cervical screening.
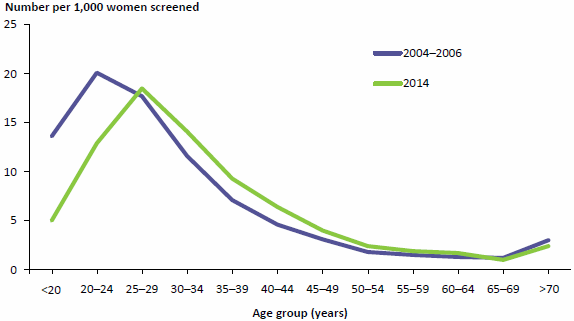
One key measure to benchmark is the detection of high-grade cervical abnormalities in women, which has been most affected by HPV vaccination, as vaccinated women are expected to experience fewer abnormalities. Visible in the under-20 age group several years ago, a reduction in detected abnormalities is now apparent in the 20–24 age group, and starting to become apparent in the 25–29 age group in 2014 (Figure 2.6).
Our data will also be used to set benchmarks for other key measures before the major change in cervical screening.
Figure 2.6: Women with a high-grade cervical abnormality detected by histology, by age, 2004-2006 and 2014
Note: Data for this figure are available in Table A8.19.
Breast cancer in young women: key facts about breast cancer in women in their 20s and30s is the first national report presenting key data specific to breast cancer in women in this age group. This report provides an overview of breast cancer, risk factors for young women, breast cancer detection and diagnosis methods, and key summary measures including incidence, hospitalisations, survival and mortality. Accompanying documents included an infographic bookmark (illustrated) and PowerPoint presentation slide pack to meet the needs of different audiences. This report was launched at Cancer Australia's Pink Ribbon Breakfast by Prime Minister Malcolm Turnbull.
The report is available at 'Breast cancer in young women: key facts about breast cancer in women in their 20s and 30s'.
Leading causes of premature death
Leading causes of premature death are outlined in a web report, Premature mortality in Australia, 1997-2012, and 15 fact sheets that measure and describe the impact of premature mortality—that is, deaths among people younger than 75. Analyses of the almost 50,000 premature deaths in 2012 showed coronary heart disease, lung cancer and suicide to be the top three leading causes of death in people aged under 75. This product focuses on the major causes of death—both overall, and among certain age groups—and explores current patterns and trends over time. The fact sheets explore population-level approaches that target specific causes of premature death which may have contributed to improvements in death rates for some causes. Detailed supplementary tables and updated General Record of Incidence of Mortality (GRIM) books also accompanied this release.
The web report is available at 'Premature mortality in Australia 1997–2012'.
Acute kidney injury—a first national snapshot
Acute kidney injury in Australia: a first national snapshot presents the first national information on acute kidney injury (AKI) and its impact. Hospitalisations of people whose principal diagnosis was AKI more than doubled between 2000–01 and 2012–13, from 8,050 to 18,010.
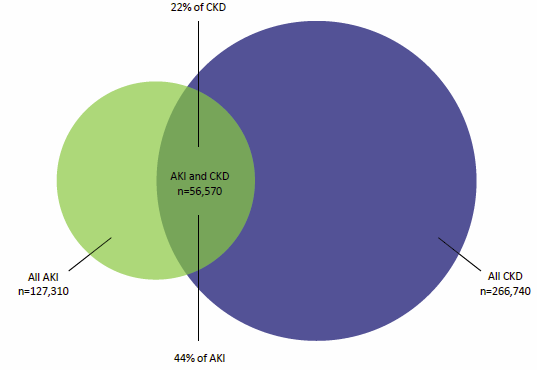
The burden of this condition is not equally distributed across the population, with higher burden experienced by Aboriginal and Torres Strait Islander people, older people, males and those living in very remote and more socioeconomically disadvantaged areas. Hospitalisations of people whose principal or additional diagnosis was AKI are also longer than average hospital stays (11.4 days compared with 5.6 days, respectively). The report examined the relationship between AKI and chronic kidney disease (CKD) as the conditions are known risk factors for each other. In 2012–13, of 127,310 hospitalisations involving AKI as the principal or additional diagnosis, 56,570 (44%) were for patients with both AKI and CKD (Figure 2.7).
The report is available at 'Acute kidney injury in Australia: a first national snapshot'.
Figure 2.7: Hospitalisations for acute kidney injury and chronic kidney disease, 2012–13
Growth in health expenditure
The last 25 years in Australia was a period marked by a growing, ageing population, a growing economy, significant improvements in medical technologies and treatments and increased spending on health.
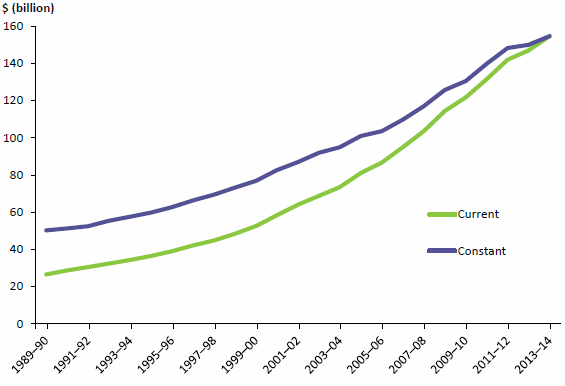
Our report 25 years of health expenditure in Australia: 1989–90 to 2013–14 showed that health spending rose by more than $100 billion (207%) over the period 1989–90 to 2013–14 from $50.3 billion to $154.6 billion (Figure 2.8). As a constant amount—adjusted for inflation—this change is from 6.5% to 9.7% of gross domestic product.
The latest update in the health expenditure series (for 2013–14) showed that growth in 2013–14 was relatively slow according to most measures. Total health expenditure grew in 2013–14 by 3.1% in real terms, after adjusting for inflation. This was higher than the 1.1% growth experienced in 2012–13 but 1.9 percentage points lower than the average annual growth over the past decade (5.0%).
Growth in expenditure was also relatively slow on a per person basis. An estimated $6,639 was spent per person on health in 2013–14, which was $94 more in real terms than in the previous year. This 1.4% growth was less than half the average annual growth over the past decade (3.3%).
This report is available at '25 years of health expenditure in Australia: 1989–90 to 2013–14'.
Figure 2.8: Expenditure on health, current and constant prices, 1989-90 to 2013–14
Note: Data for this figure are available in Table A8.20.
Public and private hospitals at a glance
Our web report Australia's hospitals at a glance 2014–15 includes summary information on public and private hospitals, including their resources, services provided and the characteristics of patients who received care. This report is a companion to the 2014–15 Australian hospital statistics suite of publications.
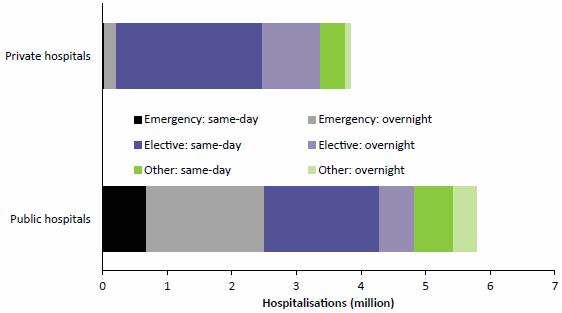
In 2014–15, there were 10.2 million hospitalisations, or admissions, including 2.5 million involving surgery. Admissions to hospital can be categorised as Emergency (required within 24 hours) or Elective (required at some stage beyond 24 hours).
In 2014–15:
- public hospitals accounted for 92% of emergency admissions, and 73% of these were overnight admissions
- private hospitals accounted for 58% of elective admissions, and 72% of these were same-day admissions (Figure 2.9).
Figure 2.9: Hospitalisations for public and private hospitals, by same-day/ overnight status and urgency of admission, 2014–15
Note: Data for this figure are available in Table A8.21.
Between 2010–11 and 2014–15:
- emergency admissions in public hospitals increased by an average 3.4% each year compared with 2.2% in private hospitals
- elective admissions in private hospitals increased by an average of 4.1% each year, compared with 2.5% in public hospitals.
The web report is available at 'Australian hospitals 2014–15 at a glance'.
Over one-third of specialist homelessness clients seek domestic and family violence support
Our 'first time' analysis of the characteristics of those people experiencing domestic and family violence who presented to specialist homelessness services in the period 2011–12 to 2013–14 showed that about 187,000 adults and children sought assistance from specialist homelessness services for reasons of domestic and family violence. They represented 36% of the 520,000 specialist homelessness clients who accessed support during the 3-year period.
Only 9% of domestic and family violence clients were able to be provided with long-term accommodation when first requested.
More information on domestic and family violence and homelessness from 2011–12 to 2013–14 is presented at 'Domestic and family violence and homelessness 2011–12 to 2013–14'.
Services for people with problematic alcohol and other drug use
Alcohol and other drug treatment services assist people to tackle their drug use through a range of treatments. In 2014–15, treatment agencies provided 170,367 treatment episodes to an estimated 114,912 clients (an average of 1.5 episodes per client). This equates to a rate of about 1 in 200 people in the general population. About 2 in 3 clients were male (67%) and 1 in 2 were aged 20–39 (54%). Despite only comprising 2.7% of the population, 1 in 7 (15%) clients were Aboriginal and Torres Strait Islander.
Alcohol, cannabis, amphetamines and heroin have remained the most common principal drugs of concern for clients since 2005–06. Nationally, alcohol was the most common principal drug of concern in 2014–15, accounting for 38% of episodes. Counselling continues to be the most common main treatment type provided for clients (2 in 5 episodes since 2005–06).
The report is available at 'Alcohol and other drug treatment services in Australia 2014–15'.
Latest information on housing assistance
Our web report, Housing assistance in Australia 2016, presents information on the types of housing assistance available in different segments of the housing sector, including government, not for profit and the private rental sectors. The 2016 edition was delivered in an online format, including an infographic (illustrated), allowing for a concise and timely release of key information and statistics and its release was accompanied by a series of tweets in an effort to better capture the audience in non-government organisations which have a direct interest in the material presented. We found that, as at 30 June 2015, there were 427,800 social housing dwellings (about 4% of all households) with around 817,300 tenants, the majority (82%) of whom lived in public rental housing. Across all social housing programs, over 3 in 5 main tenants (62%) were women. Among public housing tenants, 44% reported they had a disability and 53% were single adults who lived alone. Almost 75% of new public rental housing and community housing were provided to people with the greatest need, with 59% of households indicating they were homeless before starting their public rental housing tenancy.
Waiting lists for social housing remain long, with almost 200,000 applicants on lists in 2014–15.
The web report is available at 'Housing assistance in Australia 2016'.
Palliative care
We released data on palliative care during National Palliative Care Week. We found that:
- Medicare Benefit Schedule payments for palliative medicine specialist services increased by 79% over the latest 5-year period (from $3.0 million in 2009–10 to $5.3 million in 2014–15)
- while half (51%) of palliative care hospitalisations were for those aged 75 and over, a substantial proportion (11%) were for patients under 55
- the palliative care workforce in 2014 consisted of 3,269 nurses and 192 specialist palliative care physicians
- 1 in 6 public acute hospitals had a hospice care unit.
This web product is available at 'Palliative care'.

Indigenous primary health-care indicators
We collect national key performance indicator data from primary health-care organisations that receive funding from Commonwealth, state and territory health departments to provide services to Aboriginal and Torres Strait Islander people. The number of organisations from which we have collected these data has increased substantially over the six reporting periods, from 90 in June 2012 to 233 in December 2014. National Key Performance Indicators for Aboriginal and Torres Strait Islander primary health care: results from December 2014 presents the information on 21 indicators that focus on maternal and child health, preventative health and chronic disease management.
Improvements were seen in 3 of the 5 client health outcomes measures for which trend data were available; small positive changes were seen for smoking status among all clients and for both glycosylated haemoglobin levels and blood pressure of clients with type 2 diabetes.
Improvements were also seen in 17 of the 19 process of care measures, including those showing whether primary health-care organisations record patient birthweight, alcohol consumption and smoking status. Recording of these 3 indicators increased between June 2012 and December 2014 (Figure 2.10).
The report is available at 'National key performance indicators for Aboriginal and Torres Strait Islander primary health care: results from December 2014'.
Figure 2.10: National key performance indicator results for selected process of care measures for primary health-care organisations, 30 June 2012 and 31 December 2014
Note: Data for this figure are available in Table A8.22.