Summary
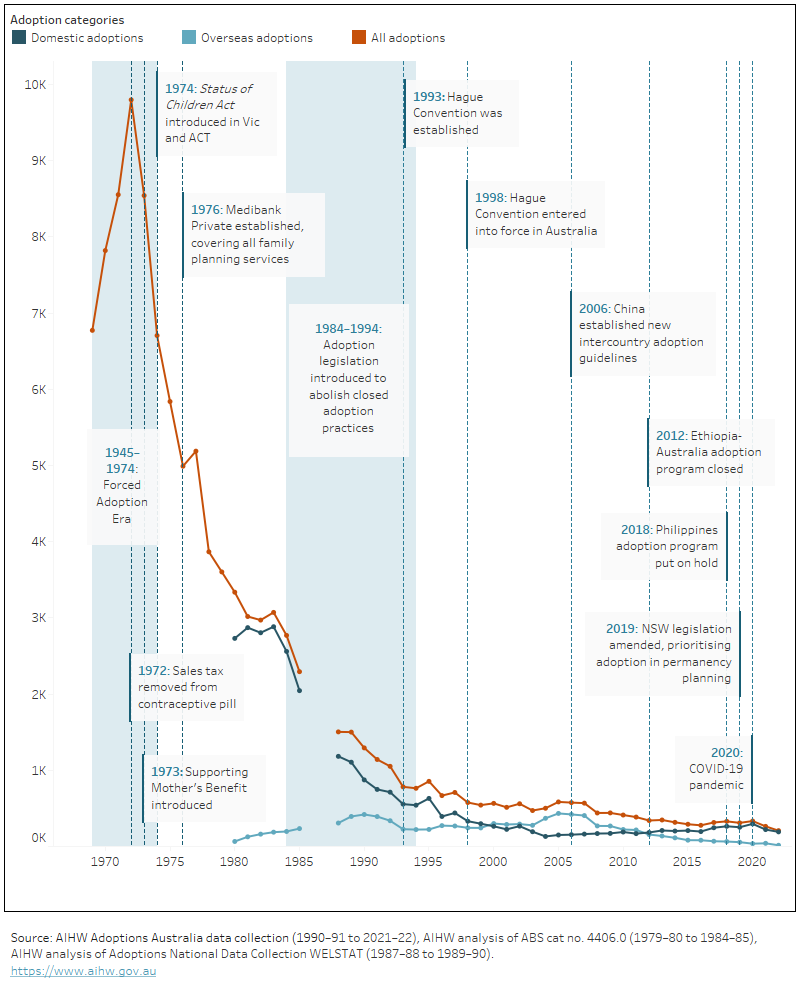
In Australia, adoption numbers have fallen from 6,733 in 1968–69 to 208 in 2021–22. This decrease reflects broader societal and policy changes occurring within Australia and worldwide (Higgins 2012).
This report explores how changing societal, legislative, and social views have affected numbers of adoptions over the last 53 years (Figure 1). Trends in adoptions can be categorised into domestic adoptions of Australian children (local and known child adoptions) and children born overseas (intercountry adoptions).
The line chart shows the number of finalised adoptions in Australia from 1968–69 to 2021–22, alongside historical key moments. After a large increase in finalised adoptions between 1968–69 to 1971–72 which occurred during the era of forced adoption, the number of adoptions have declined substantially.

Notes
1. Each year represents a financial year, for example 2022 represents the 2021–22 financial year.
2. No national data were collected in 1985–86 and 1986–87.
3. National data prior to 1979–80 did not differentiate between overseas and domestic adoptions.
4. Totals for 1979–80 to 1981–82, 1983–84, 1984–85, 1987–88, 1988–89 and 1991–92 include adoptions involving children where birthplace or relationships to the adoptive parent(s) was unknown. Therefore, numbers for subcategories may not add to those for the total. A full list of these data discrepancies is in Table S10 in the Adoptions Australia supplementary data tables.
5. Prior to 1998–99, 'intercountry adoptions' were referred to as 'adoptions of overseas-born children by non-relative'.


