Apparent consumption of alcohol in Australia: 1944–45 to 2019–20
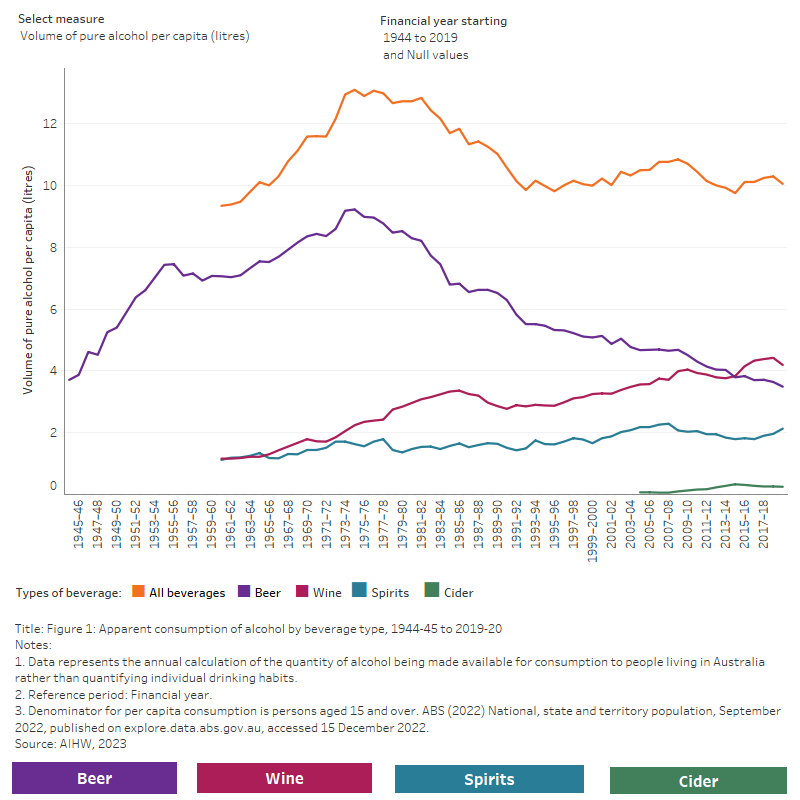
The figure shows how apparent consumption of different beverage types has changed between 1945 and 2020. Since 2014–15, wine has contributed more to total alcohol consumption than any other beverage type.
Trends in apparent consumption of alcohol
In 2019–20, 208.8 million litres of pure alcohol were made available in Australia, a 0.7% decrease from 210.3 million litres in 2018–19. Before 2019–20, apparent consumption of pure alcohol had consistently increased since 2014–15 (186.9 million litres).
The trends in the total amount of alcohol made available were not reflected in per capita consumption. After alcohol consumption peaked at around 13 litres of pure alcohol per capita in 1974–75, it declined to 10 litres in 1991–92. Despite a smaller peak of 11 litres in 2008–09, apparent consumption has remained relatively stable at around 10 litres per capita from 2010–11 through to 2019–20.
This indicates that as the total amount of alcohol in Australia increased between 2014–15 and 2018–19, the Australian population also increased, resulting in stable levels of consumption per capita.
Recent trends in apparent alcohol consumption were different for different beverage types, as shown in Figure 2.
Figure 2: Per capita consumption of pure alcohol by beverage type over time.
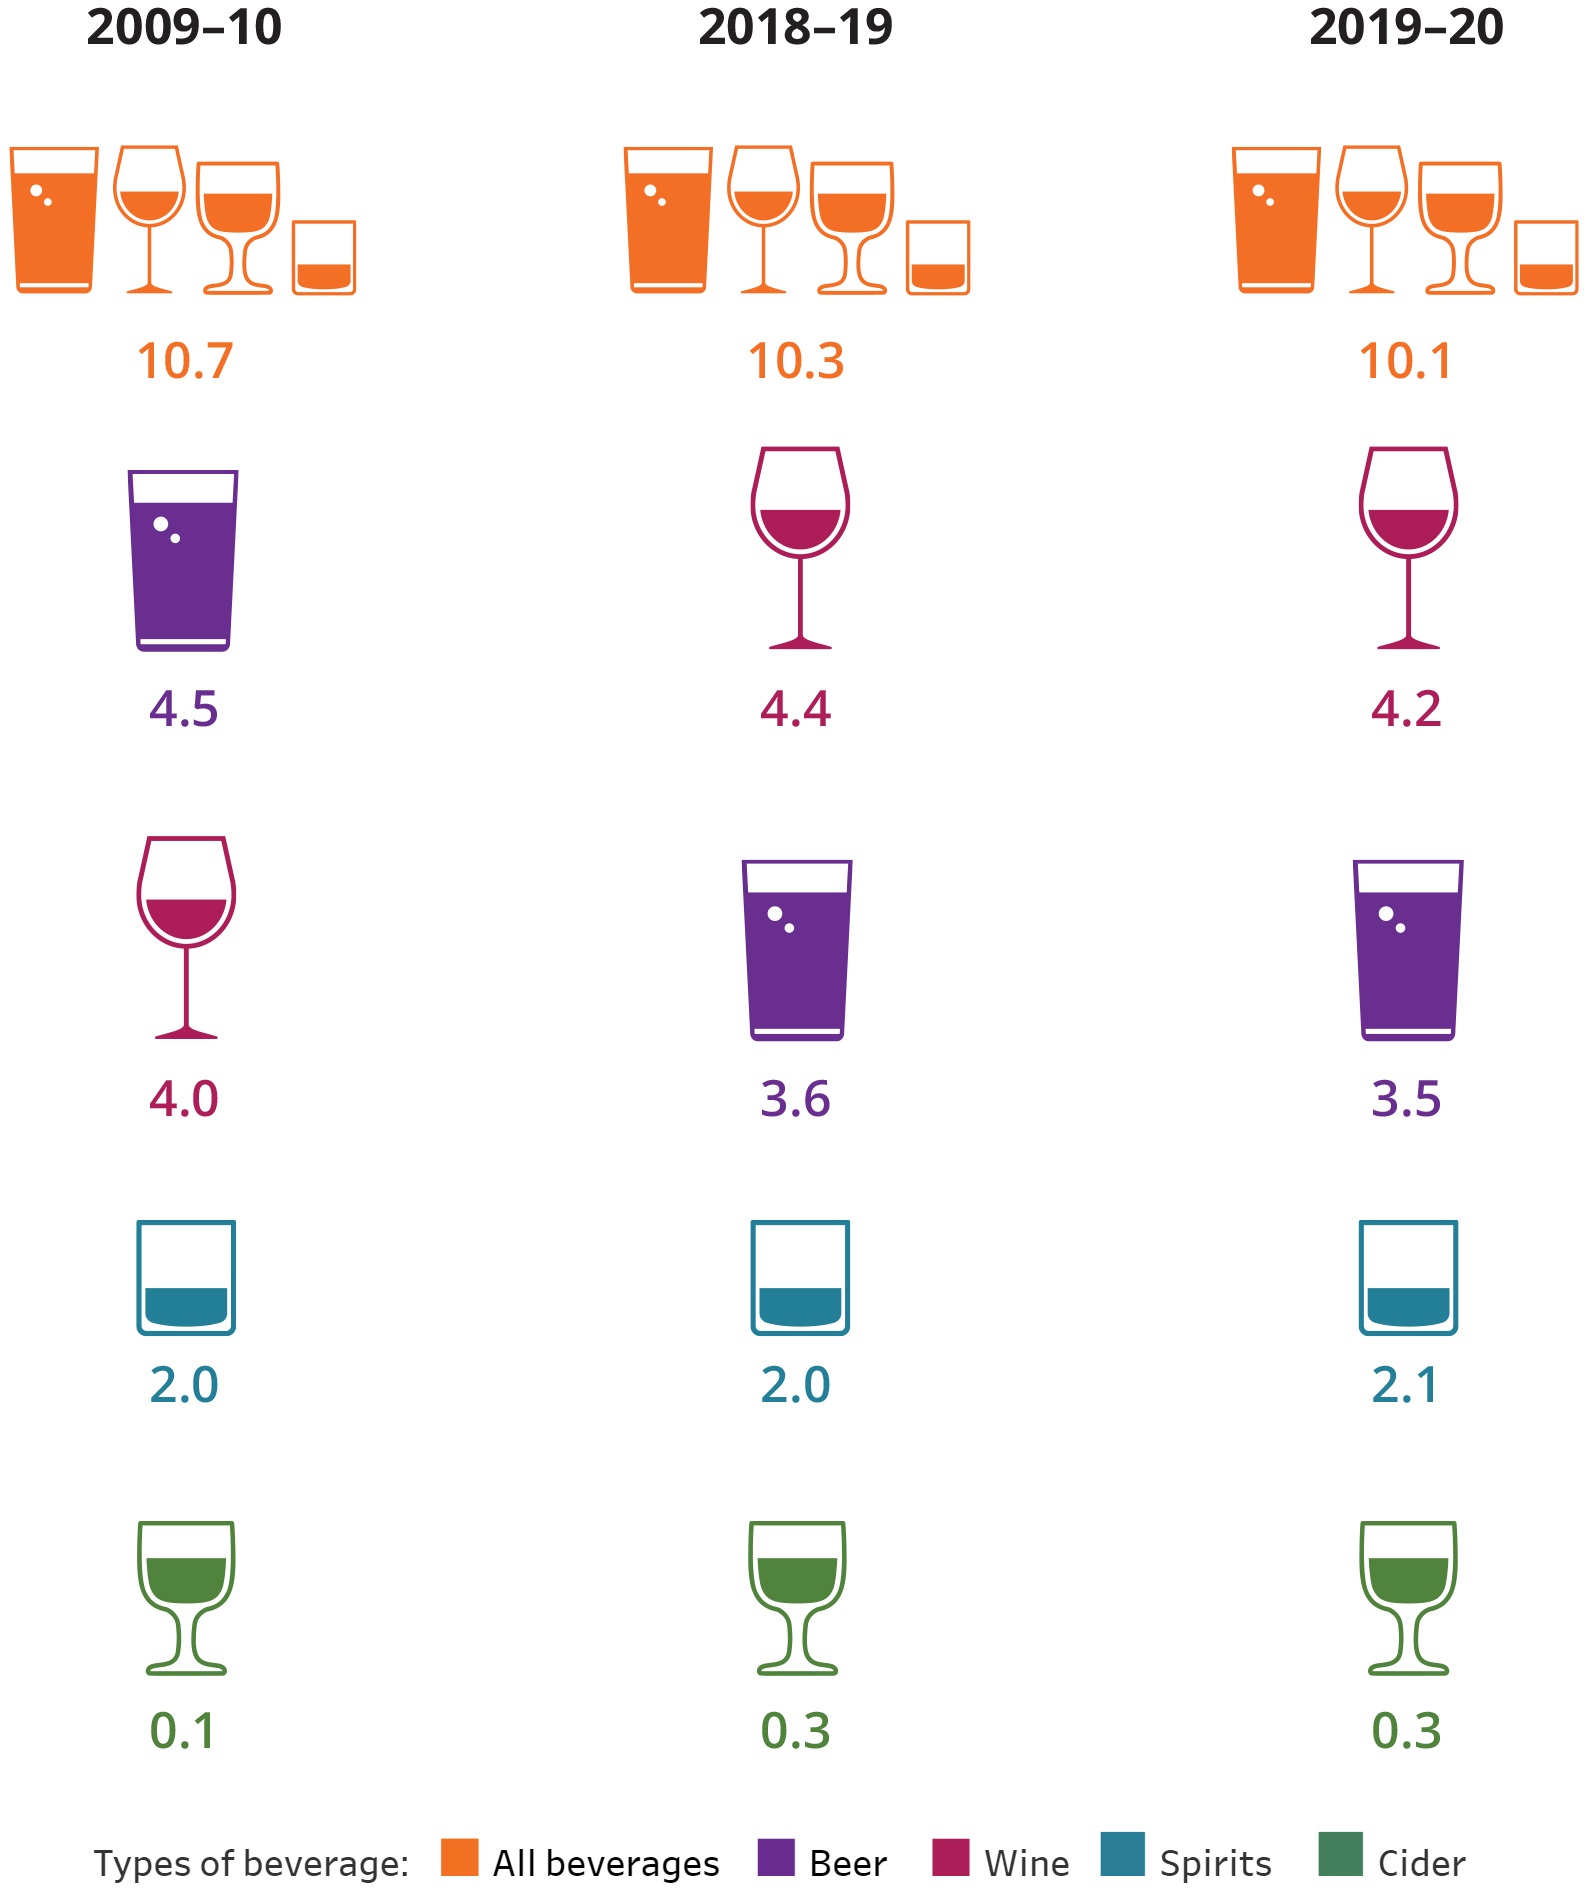
Source: AIHW 2023, tables 1, 3, 5–7.
The largest difference seen between 2018–19 and 2019–20 was a 10% increase in the apparent consumption of spirits, up to 44.2 million litres of pure alcohol. This growth has been consistent since 2016–17 when a total of 35.5 million litres of pure alcohol from spirits were consumed.
This change is particularly notable when compared to changes in other beverage types between 2018–19 and 2019–20:
- 72.4 million litres of alcohol from beer were made available in 2019–20, a decrease of 2.8% from 74.5 million litres in 2018–19.
- Apparent consumption of wine decreased by 3.8% to 87.0 million litres of pure alcohol in 2019–20. This is the first time that apparent wine consumption has decreased since 2012–13 (70.4 million litres).
- Cider consumption has remained stable at 5.2 million litres of pure alcohol.
Despite these changes, wine still made up the largest proportion of apparent alcohol consumption at 42% of all available alcohol in 2019–20 (Figure 3).
Figure 3: Breakdown of apparent consumption of alcohol in 2019–20 by beverage type.
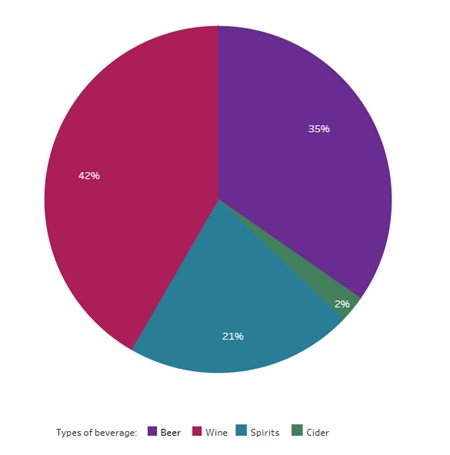
Source: AIHW 2023.
Apparent consumption of beer
People in Australia consumed 82 litres of beer per capita in 2019–20, equating to an average of 3.5 litres of pure alcohol each. This is the lowest amount seen since the late 1940s and continues the long-standing trend of decreasing beer consumption since the peak in 1974–75, when people consumed an average of 190 litres of beer (or 9.2 litres of pure alcohol).
While overall beer consumption has been decreasing, an increasing proportion of that beer has been mid-strength. In 2019–20:
- 23% of all beer consumed was mid-strength, the highest amount seen since the categories were created in 2000–01 when 11% of beer was mid-strength.
- 73% of beer was full-strength, a slight decrease from 76% in 2000–01.
- Just 4.4% of beer was low-strength, a substantial drop since 2001–02 (13%).
Apparent consumption of wine
In 2019–20, 87.0 million litres of pure alcohol in the form of wine were made available in Australia, a decrease from 90.4 million litres in 2018–19. Despite this reduction, per capita consumption of wine is still at one of the highest levels in the past 60 years (Figure 4).
Figure 4: Years with the highest consumption of pure alcohol from wine since 1960, litres per capita.
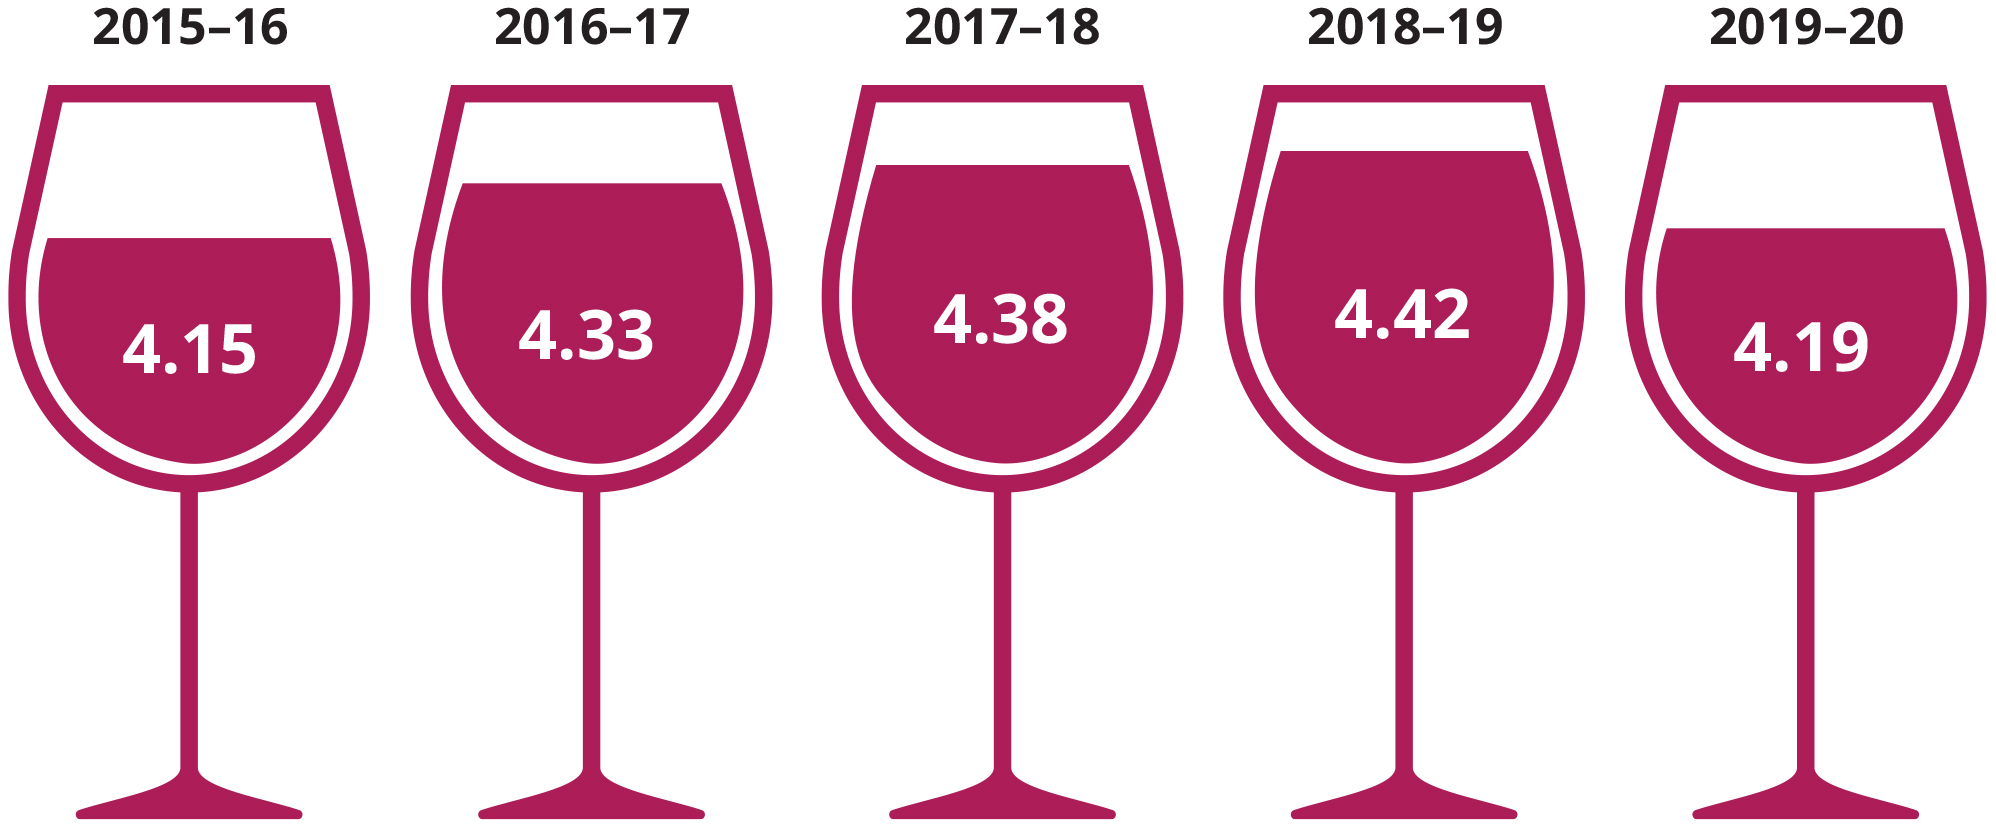
Source: AIHW 2023, Table 3.
Prior to the decline in 2019–20, apparent consumption of alcohol from wine had consistently increased from 3.8 litres per capita in 2013–14.
Apparent consumption of spirits
Spirits saw a 19% increase in availability from 1.8 litres of alcohol per capita in 2016–17 to 2.1 litres in 2019–20. This is the highest level seen since the peak of spirits consumption in 2007–08 (2.3 litres per capita).
While apparent consumption of spirits is now close to 2007–08 levels, the types of spirits being consumed have changed substantially. Ready-to-drink beverages (for example, spirits mixed with soft drinks) made up 48% of spirits consumption in 2007–08, but just 28% in 2019–20. This decrease occurred following a change in tax to ready-to-drink beverages in 2008.
As a result, unmixed spirits such as vodka, whiskey, and liqueurs are now at their highest level of consumption since the category was reported separately in 2002–03, with people consuming an average of 1.5 litres of pure alcohol from unmixed spirits in 2019–20.
Apparent consumption of cider
Cider continues to make up a small portion of the total amount of alcohol made available in Australia. In 2019–20, only 0.25 litres of pure alcohol from cider were consumed per capita, down from the peak of 0.33 litres per capita seen in 2014–15.