Introduction and background
Overview
Where we live and the built and commercial environment that surrounds us impacts our health behaviours and wellbeing in many ways. Access to alcohol through the number of and distance to alcohol outlets in the places we live can affect how much alcohol we consume and alcohol-related harm (Azar et al. 2016; Gilmore et al. 2015; Hobbs et al. 2020).
Around three quarters (77%) of people aged 14 and over in Australia have consumed a full serve of alcohol in the previous 12 months and this has not changed in recent years (AIHW 2020; AIHW 2024a). The legal age to purchase or consume alcohol in a licensed venue in Australia is 18. In 2019, 30% of people aged 14–17 drank any alcohol and 33% of adults aged 18 and over drank alcohol in ways that increased the risk of alcohol-related disease or injury, exceeding the current National Health and Medical Research Council (NHMRC) Guidelines for Alcohol Consumption (see Box 1) (AIHW 2021b; NHMRC 2020).
Alcohol-related risks and harms
Alcohol consumption is widespread within Australia and entwined with many social and cultural activities. But it is also a major health issue and associated with both health (for example, many forms of cancer, liver cirrhosis, brain damage and dementia and some forms of heart disease and stroke) and social harms (for example, crime, drink driving and violence including family domestic and sexual violence) (AIHW 2024a).
Alcohol was the 5th leading risk factor contributing to disease burden in Australia in 2018. Around 4.5% of the total disease burden from premature deaths and ill health was due to alcohol consumption in 2018 (AIHW 2021a).
Alcohol consumption can also cause a range of negative health outcomes. These can be short term and immediate such as poisoning and injury, or long term such as dependency, chronic liver disease, and certain cancers. Recent evidence shows that no level of alcohol consumption is risk free (GBD 2016 Alcohol Collaborators 2018).
Alcohol also contributes to social harms and antisocial behaviour. The latest findings from the 2022–2023 National Drug Strategy Household Survey (NDSHS) found almost 1 in 7 (14.7%) recent drinkers took part in at least one potentially harmful activity while under the influence of alcohol in the previous 12 months and 1 in 13 (7.6%) reported driving a motor vehicle (AIHW 2024a).
Australian guidelines for drinking alcohol
In December 2020, the NHMRC released updated Australian guidelines to reduce health risks from drinking alcohol. Box 1 summarises how alcohol intake is measured in accordance with the guidelines.
Box 1: What are the revised Australian alcohol guidelines?
These are the Australian guidelines to reduce health risks from drinking alcohol, as published by the NHMRC (NHMRC 2020).
Guideline 1: To reduce the risk of harm from alcohol-related disease or injury, healthy men and women should drink no more than 10 standard drinks a week and no more than 4 standard drinks on any one day.
The less you drink, the lower your risk of harm from alcohol.
This guideline does not describe a “risk-free” level of drinking. As a general rule, the less alcohol a person chooses to drink, the lower their risk of alcohol-related harm. Drinking within the levels outlined in guideline 1 keeps the lifetime risk of dying from an alcohol-related disease or injury to below 1 in 100 for healthy men and women.
Guideline 2: To reduce the risk of injury and other harms to health, children and people under 18 years of age should not drink alcohol.
Guideline 3:
- To prevent harm from alcohol to their unborn child, women who are pregnant or planning a pregnancy should not drink alcohol.
- For women who are breastfeeding, not drinking alcohol is safest for their baby.
While this report uses data from the 2019 NDSHS which pre-date the 2020 guidelines, the guidelines can give an indication of how many people were drinking at levels that increased their risk of alcohol-related disease or injury according to the current understanding of what constitutes a ‘risky’ amount of alcohol (AIHW 2021b). Using the 2020 guidelines means the findings of this report can be related to current policy development.
Selling alcohol in Australian outlets
Restricting availability of alcohol is one of the most cost-effective ways to minimise alcohol harm (Anderson et al. 2009). The National Alcohol Strategy 2019–2028 provides policy options that consider the transparency of licensing decisions and the role of communities in contributing to these decisions as a way of preventing and minimising alcohol-related risks and harms (Department of Health and Aged Care 2019).
To be able to sell alcohol in Australia, a business needs to have an appropriate licence (except in some special circumstances). This varies by the type of business being run and the state or territory the business is operating in. Licences have conditions (for example, operating hours) that vary by state and by area. Businesses involved in selling alcohol are referred to as alcohol outlets in this report, and include those where you can drink on site, such as restaurants, bars, clubs, and pubs, and those that sell alcohol you can take away to drink elsewhere such as dedicated retail bottle shops, hotel drive-through bottle shops, and boutique retail stores. Some businesses can be a combination of these such as hotels which provide for the sale of alcohol for ‘consumption on’ the premises and the sale of alcohol for ‘consumption off’ the premises. There are also businesses that sell alcohol wholesale, which will include many wine growers and cellar doors, but these were typically excluded from the analyses (see Technical notes).
How does alcohol outlet access influence consumption?
There is evidence from Australia and internationally showing that living closer to alcohol outlets is one factor associated with increased risky drinking behaviour (Azar et al. 2016; Gilmore et al. 2015; Hobbs et al. 2020). Other factors include, the number of outlets, days and times of operation, and clustering of outlets, which influence the risks and harms associated with alcohol (Anderson et al. 2009). This report adds to this knowledge base and is a methodological resource for future work.
Determinants of alcohol consumption
Understanding access to alcohol in an area – that is, how close and how many outlets there are – can be used to inform liquor licensing, public health and urban planning decisions to reduce the harms from alcohol consumption. Making alcohol less available through control of outlets can reduce harm from alcohol consumption in a cost-effective way (Anderson et al. 2009). Limiting the availability of and access to alcohol reduces alcohol consumption and alcohol-related harms, with varying effectiveness depending on the specific context.
From a public health perspective, the location of, and access to alcohol outlets, are environmental and commercial determinants of health. Environmental determinants of health are the environments where we live, work, play and age, including natural and built environmental factors, climate change and severe weather events and geographic location (AIHW 2024b). Commercial determinants are factors that are detrimental to health and relate to the private sector drive to promote products and choices to consumers which stem from a profit motive (Casswell 2013; Department of Health and Aged Care 2021; West and Marteau 2013). Commercial determinants were noted to be a challenge for preventive health by the WHO director general, Margaret Chan, in 2013, and contribute to the tension between prevention initiatives and profit driven companies trying to increase sales of products that can be detrimental to health (Kickbusch et al. 2016).
Purpose of this report
This report presents estimates of the variation in the number, rate per 1,000 adults and spatial accessibility index of licensed alcohol outlets in individual small geographic areas (also known as Statistical Areas level 2 or SA2) in 6 Australian states (NSW, Qld, SA, Tas, Vic and WA). It includes the information provided by the liquor licensing authorities of each state on licensed premises in their jurisdiction on (or close to) the 31 December 2018, except for SA which is for 2021 (see Technical notes for details and the types of licences included in the analysis). This data is intended as a resource for research, policy development and planning, and a methodological tool. The mapped findings in this report are presented for Capital city areas and Non-capital city areas to allow users to compare areas with similar population density and proximity to alcohol outlets.
This report also includes an additional example analysis of data from the NDSHS 2019 for people living in Capital city areas (SA1) to investigate the relationship between distance to the closest alcohol outlet and risk of harm from risky drinking and harm from experiencing an alcohol-related incident like verbal or physical abuse from someone under the influence of alcohol
The method developed by the AIHW is based on the American Centres for Disease Control and Prevention (CDC) guidelines on measuring alcohol outlet density (CDC 2017). Full details of the methodology are available in the Technical notes .
This work is important, as being able to purchase alcohol within a short distance of the home is one factor that may result in people being more likely to experience the negative outcomes associated with alcohol such as injuries, violence, and chronic disease health risks.
Geography and measures
These analyses relate to the people living in small geographic areas (SA2) of selected Australian states and the number of alcohol outlets or distance to the closest outlet/s in those areas.
Not all information is presented in this report as there are over 2,000 small geographic areas (SA2) included in these analyses (for full details see Technical notes: Analytical considerations for geographic analyses).
This information is intended to show the variability across selected Australian states in the density of and access to alcohol outlets using 3 mapped measures:
- the number of outlets per small geographic area (see Number of alcohol outlets in small geographic areas (SA2) of selected Australian states)
- the number of outlets per 1,000 adults in small geographic areas (see Alcohol outlets per 1,000 adults in small geographic areas (SA2) of selected Australian states)
- the Spatial accessibility Index to alcohol outlets in small geographic areas (SA2) – which ranks areas in order of highest access to lowest access based on the distance to the closest 5 outlets (which may be outside of the area), and the population of the area (see Access to alcohol outlets in small geographic areas (SA2) of selected Australian states).
An additional 2 measures demonstrate how the geographic data can be used in combination with other data from the NDSHS 2019 to provide information with relation to the people living in the areas:
- the average distance to closest alcohol outlet for populations in small geographic areas in selected Australian states in 2018 (see Distance to alcohol outlets and alcohol-related risks and harms for selected Australian states)
- the average distance to closest alcohol outlet and associated risks and harms for people aged 14 and over in Capital city areas of selected Australian states (see Distance to alcohol outlets and alcohol-related risks and harms for selected Australian states)
There are many different ways this information can be used to help inform research and policy. For example, local planners may want information about the number of alcohol outlets in a specific area and how this also relates to the number of adults in the same area. Researchers may find an accessibility index which considers more than one outlet or area a more useful way to compare areas for potential risk of alcohol-related harms.
Box 2: Definitions
Australian States refers to the six Australian States; New South Wales (NSW), Queensland (Qld), South Australia (SA), Tasmania (Tas), Victoria (Vic), and Western Australia (WA), for which data on alcohol outlets was available for this project. These six jurisdictions make up approximately 97% of the Australian population (ABS 2019).
Risky alcohol consumption refers to people exceeding Guideline 1 of the Australian guidelines to reduce health risks from drinking alcohol, as published by the National Health and Medical Research Council: To reduce the risk of harm from alcohol-related disease or injury, healthy men and women should drink no more than 10 standard drinks a week and no more than 4 standard drinks on any one day (NHMRC 2020).
The National Drug Strategy Household Survey (NDSHS) collects information on alcohol consumption behaviours, and experiences of harm from other people under the influence of alcohol for people aged 14 and over.
Risks and harms considered in this study from the NDSHS 2019 were:
- Self-reported risky alcohol consumption using the current 2020 NHMRC Alcohol guidelines.
- Self-reported alcohol-related incidents (verbal and physical abuse, being put in fear by someone under the influence of alcohol).
Small geographic areas in this report refer the Statistical Areas (indicated as SA1 or SA2) that are based on the Australian Statistical Geography Standard (ASGS) 2016 a standardised classification of Australia into small areas (ABS 2016).
Capital city areas in this report are based on the ABS Greater Capital City Statistical Areas which are the areas that represent the functional area of each of the capital cities of Australia which includes populations who regularly socialise, shop or work within the city, but may live either in the city or in the small towns and rural areas surrounding the city (ABS 2016).
Capital city Central Business District (CBD) areas: These are the SA2 areas in the capital cities that are named after or include the name of the capital city (in this report, Adelaide, Brisbane City, Hobart, Melbourne, Perth City and Sydney-Haymarket-The Rocks)
Non-capital city areas are the areas not defined as being part of a Capital city area. Also called the Rest of State region (ABS 2016).
People refers to the number of people (in this case adults) living within an area. When measuring distance by road to the closest alcohol outlet, a centroid or single point for the centre of the population in the small geographic area (SA1) is used, rather than the locations of where every person in the area lives. This is considered a good approximation of the average distance of each person to their closest outlet for small geographic areas like SA1 (CDC 2017). The SA1 distances are averaged for SA2 which are larger and contain 1 or more SA1.
Density means how many alcohol outlets there are within an area.
Distance as measured by road between a population weighted centroid and an alcohol outlet in an SA1. Measured in metres and/or kilometres. The SA1 distances are averaged for SA2 which are larger and contain 1 or more SA1.
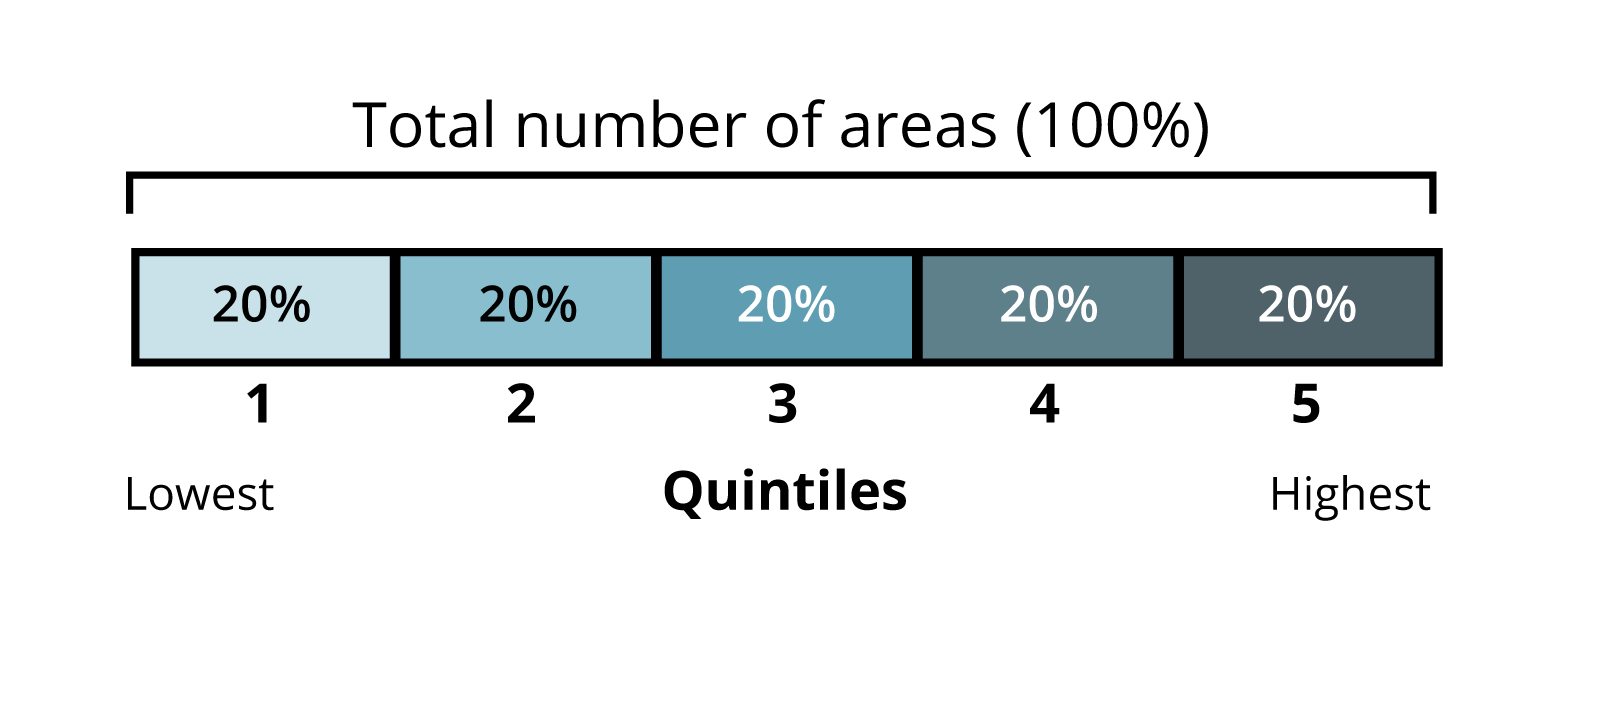
Spatial Accessibility Index is a measure of access consumers have to a service – in this case alcohol outlets. The Spatial Accessibility Index for an area indicates the relative accessibility to alcohol outlets when compared with other areas – a higher result represents higher access. The score is not individually meaningful. In this report areas are organised into quintiles for each 20% of areas from the 20% of areas with the lowest Spatial Accessibility Index (or lowest access) to the 20% of areas with the highest Spatial Accessibility Index (or highest access).
For more information on any of these measures see the Technical notes.