Analytical considerations for geographic analyses
When using a method such as the one developed by the AIHW which is based on the work by the Centres for Disease Control and Prevention (CDC 2017) to explore the number of, and distance to alcohol outlets (or another location of interest) for geographic areas in Australia it is important to have a clear purpose.
For this work, the purpose was to create a method to use geographic data on physical locations of a commercial service – alcohol outlets – in maps showing measures of alcohol access for small geographic areas.
The secondary purpose was to demonstrate how the data on geographic locations of alcohol outlets could be used in combination with measures of alcohol consumption and harms from the AIHW National Drug Strategy Household Survey 2019 (AIHW 2020).
Both these purposes, along with the data being available for selected Australian states, led to some choices on how we analysed and output the data which are outlined below.
Type of outlet
All jurisdictions in Australia have a licensing system in place to regulate the sale of alcohol. However, the number of categories of licences available and conditions attached to each licence differ across the jurisdictions (Howard, et al. 2014).
Specified caterer licences were excluded (although in NSW, the on-premise licence also allows for the provision of alcohol for catering purposes) as were wholesaler/producer licences. In many jurisdictions, alcohol producers (such as wine producers, brewers and distillers) have special licence types that primarily allow them to sell alcohol in a wholesale setting. They may also choose to have onsite tastings at cellar doors, make their product available at a restaurant on site and/or sell their own alcohol to the public for takeaway consumption. However, not all producers choose to have on site tastings, restaurants or sales, and there can be restrictions on the volume of alcohol they are allowed to sell for takeaway consumption and the specific licence conditions vary by jurisdiction. As such, this licence type has been excluded from these analyses, similar to other research. The types of premises for each State included in this work are provided in Table 1.
A limitation of this work is that all venues were treated equally, regardless of whether they were a boutique packaged store or a large, packaged liquor store.
| Jurisdiction | Licence types included |
|---|---|
New South Wales | Club Hotel On premise Small bar Hotel Packaged liquor |
Victoria | Full club General Late night (general) Late night (on-premise) On-premise Restaurant and café General Late night (general) Late night (packaged liquor) Packaged liquor licence |
Queensland | Commercial Hotel Commercial Other – Bar Commercial Other – Subsidiary On Premises Commercial Special Facility Community Club Community Other Nightclub Commercial Hotel Commercial Other – Subsidiary Off Premises |
South Australia | Club General and Hotel On Premises Residential Restaurant and Catering Small venue Packaged Liquor Sales Liquor Production and Sales |
Western Australia | Casino Club Hotel Hotel Restricted Nightclub Restaurant Small bar Special Facility Licence Tavern Tavern Restricted Hotel Liquor store Tavern |
Tasmania | Club General On On-restaurant Special General Off Special (online/Internet) |
Geographic measures
Data can be presented using a range of geographies, including by areas smaller than states and territories such as SA1 or SA2. Reporting at these smaller, more ‘local’ areas can show results that may be masked by results for the whole of Australia, or for states and territories – allowing a better understanding for the local community, clinicians, policymakers and researchers.
For the main purpose of this report showing mapped measures of access, we used SA2 and Greater Capital City/Rest of State areas, referred to throughout the report as Capital city areas and Non-capital city areas. For the demonstration of how outlet location data could be used in combination with measures of alcohol consumption and harms, SA1 were used to create the summary statistics.
The final number of areas used in this report differs to the total number of SA2 in Australia in the ABS 2016 geography used for this report to align with the timeframe of the data (ABS 2016) as ACT, NT and Other Territories have been excluded due to data being unavailable for the timepoint at the time of the request for this report, as have certain other non-habitable areas, or areas not accessible by road. In this report, we have included 2088 SA2 and the 24 Greater Capital City/Rest of State areas in the 6 jurisdictions (NSW, Vic, Qld, WA, SA, and Tas) where data on alcohol outlets was available for the time period.
Figure 1: Number of SA2 included and excluded for geographic analyses
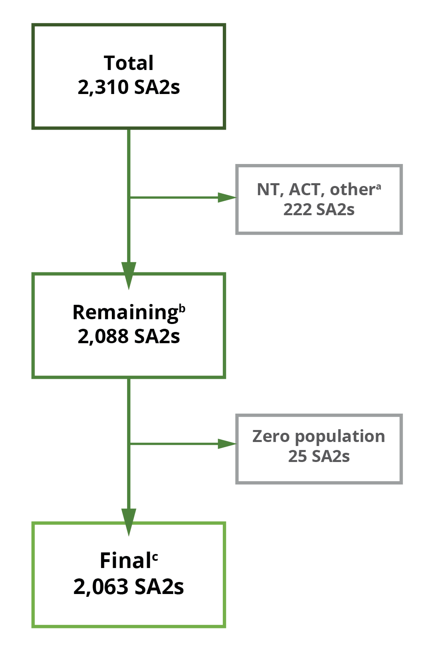
Notes:
- SA2s in NT, ACT and Other territories, and islands such as Norfolk Island and Lord Howe Island, or without geographical boundary (these SA2s are the ones with “No usual address or “Migratory - Offshore – Shipping were unable to be included in the analysis.
- remaining SA2s used for number of outlets.
- final SA2s used for rate and access measures.
Due to the smaller number of results in these smaller areas (particularly for data sources like surveys) and the strict privacy and confidentiality controls applied to data, results are sometimes unable to be reported for all small areas in Australia and larger geographies may need to be used.
When presenting data by geographic areas, it is important to choose levels of geography that are appropriate to the data and research question. For example, would presentation of data by remoteness areas, state and territory and/or greater capital cities show significant differences? For this report, the data are presented for small geographic areas, and also for Greater Capital City areas (referred to as Capital city areas) and Rest of State areas (referred to as Non-capital city areas) as cities have denser populations and greater numbers of retail outlets (including alcohol outlets) than Rest of State areas.
Density measures
There are different approaches to measure outlet alcohol density which vary in their simplicity and accuracy. These may be container-based, distance-based, or spatial access measures (CDC 2017). Each approach has its own strengths and weaknesses, which should be considered when choosing which is most appropriate.
Container-based measures
Container based approaches are a crude analysis of alcohol outlet density. They present the number of outlets by a selected denominator - population, area, or roadway distance. The container may be defined by the user (for instance, using a landmark or address as the centre of a 5km radius) or can be pre-defined (for instance geopolitical borders such as state or council boundaries, or statistical areas such as SA1 or SA2). In this report the measures number of outlets per area and number of outlets per 1,000 adults per area have been used.
Distance-based measures
Distance-based measures describe the distance between a standard reference point and alcohol outlets. The standard reference points can be addresses, such as for landmarks of interest (for example, a school). Alternatively, population-weighted centres (centroids) can be used. In this report, the distance between population weighted centroid and closest alcohol outlet has been used.
These approaches are also described as travel cost approaches, such as describing the distance or time to the closest service of interest (Zhang et al. 2011). These approaches are a simple and intuitive measure, that may be unrealistic (Zhang et al. 2011).
Different units of distance can be used, and the most appropriate choice will depend on the context. For example, when looking at a densely populated urban area where most people are likely to walk to their nearest outlet, walking distance or time will be the most suitable unit of distance to use. In contrast, in a sparsely populated area where most people are likely to drive to their nearest outlet, driving-time may be the most suitable unit.
In general, distance can be measured between the two points of interest as
- the most direct, straight-line distance, or
- the road distance, or
- travel time using travel infrastructure such as roads, footpaths, or public transport.
In this report kilometres and metres of road distance have been used between the weighted population centre of an SA1 and the closest alcohol outlet/s. Drive time was assessed to be of limited use for this report due to the variation in distances, speed limits and impracticality of driving to outlets in cities compared with rest of state areas across Australia. The results for all SA1 within an SA2 were averaged to create the SA2 value.
Spatial access measures
Spatial access measures describe the access to outlets from a reference point. In the same way as distance-based measures, the reference point could be an address or landmark, or a population weighted centre (centroid).
The spatial access approach then uses a calculation which considers the distance from the reference point (in this analysis, the population weighted centre of an SA1) to a fixed number of closest outlets. The number of outlets is usually between 5 and 9 (5 are used in this analysis), based on evidence on decision-making in environmental conditions (CDC 2017). The higher the SAI, the more access there is to outlets from the reference point. The results for all SA1 within an SA2 were averaged to create the SA2 value.
Which density measures should be used?
Distance and spatial access measures provide a more comprehensive picture of alcohol access in an area compared to container measures. They are better at describing population exposure to outlets in an area, and whether there are clusters of outlets – which are associated with higher risks of harmful consumption and alcohol-related harms. This makes them more suitable for evaluating harms than container-based methods. However, these approaches are more complex and demanding on resources, and are more difficult to communicate, while container-based approaches are less resource intensive and are simple to understand (CDC 2017).
Density measures used in this report
This report demonstrates each of these approaches. The container-based measures, number of outlets per SA2 and number of outlets per 1,000 population per area are shown. The distance-based approach is explored using driving distance from a population weighted centroid to closest outlet. Further, this work demonstrates an example of the application of the distance-based approach which combines driving distance to the closest outlet to the population weighted centroid with self-reported data on alcohol consumption and harms from the AIHW National Drug Strategy Household Survey 2019 (AIHW 2020). Finally, this work includes an example of the spatial accessibility index approach.