
Chapter 3 Leading causes of ill health
3.0 Introduction
Australia has one of the highest life expectancies in the world and the majority of Australians consider themselves to be in good health.
But while death rates continue to decline and the burden of disease in the population has improved (including both fatal and non-fatal impacts), not all Australians are as healthy as they could be.
Chronic diseases are the leading cause of ill health and death in Australia. In 2014–15, more than 11 million Australians had at least one of eight selected chronic diseases, and one-quarter of the population had two or more of them. The effects of chronic disease can be profound, both on an individual's health and wellbeing and on the health care system.
This chapter profiles the leading causes of ill health in Australia, both physical and mental, and the impact of these illnesses. It includes a feature article on the key results from the Australian Burden of Disease Study recently undertaken by the AIHW.
According to these results, cancer, cardiovascular diseases, mental and substance-use disorders, musculoskeletal disorders and injuries account for around two-thirds of the burden in Australia.
About 31% of the burden of disease could have been prevented by reducing exposure to modifiable risk factors such as tobacco use, harmful alcohol use, high body mass, physical inactivity and high blood pressure. These risk factors are covered in more detail in 'Chapter 4 Determinants of health'.
This chapter also examines premature mortality—that is, deaths before the age of 75. Even though the premature mortality rate has fallen dramatically over the past 100 years or so, one-third of deaths in Australia in 2013 were considered premature.
It also looks at vaccine preventable diseases, such as influenza and pertussis (whooping cough), and how they affect different population groups in our community.
3.1 Burden of disease and injury in Australia
Introduction
While the health of the population is monitored using separate measures of morbidity and mortality (as described elsewhere in this publication), it is important for health policy-making and service planning to be able to combine information on both of these measures. This enables health policymakers and service planners to be able to recognise and assess the varying impact of morbidity and mortality for different diseases, injuries and risk factors.
The Australian Burden of Disease Study (ABDS) recently undertaken by the AIHW provides information on the burden of disease for the whole population, as well as for the Aboriginal and Torres Strait Islander population (Box 3.1.1). The study builds on the AIHW's previous burden of disease studies and disease monitoring work and provides Australian-specific burden of disease estimates for 200 diseases and injuries, grouped into 17 disease groups, and for 29 risk factors, for 2003 and 2011.
This feature article highlights the key results of the ABDS for the Australian population as a whole. (The Indigenous component was still being finalised at time of preparation of this feature article.) It also provides a comparison of burden between Australia and other Organisation for Economic Co-operation and Development (OECD) countries, using international burden of disease data.
Health loss across the life course
Overall, in 2011 there were 201 years of healthy life lost due to dying or living with disease or injury for every 1,000 people in Australia. This is equivalent to 4.5 million DALY in total.
As expected, the overall disease burden increased with age, except for over 85 where it was much lower due to the smaller population (Figure 3.1.1).
Males experienced more burden than females, but the age distribution of burden is very similar for males and females.
Children (aged under 15 years) and adolescents and young adults (15–24 years) experienced a similar number of DALY in 2011, although the sources of this burden are quite different. In children, the burden is evenly shared between fatal burden (due to dying prematurely) and non-fatal burden (due to ill health), whereas in adolescents and young adults, ill health accounts for more burden than dying prematurely.
The total burden increased with increasing age, and was highest in those aged 65–84. The increased burden between the ages of 25 and 84 was mostly due to the increased burden of dying prematurely, as the burden from ill health was similar across these age groups.
While the total burden for very old Australians (those aged 85 and over) is quite low, the rate of burden (that is, the number of DALY per 1,000 population) in this age group is the highest.
Box 3.1.1: What is burden of disease and why is it useful?
Burden of disease analysis quantifies the gap between a population's actual health and an ideal level of health in a given year—that is, every individual living in full health to the theoretical maximum life span—for all diseases at the same time. It does this by measuring both the burden of living with ill health as well as the burden of dying prematurely. It also quantifies the contribution of various risk factors to this burden. Because the same methods are used for all diseases, it means that the health impacts of different diseases and injuries can be validly compared, which is valuable for informing health policy and service planning.
Non-fatal burden is expressed as years lived with disability (YLD). YLD measures the proportion of healthy life lost due to living with a disease in a given year. Total YLD are influenced by the number of people with each disease, how long they spend living with its effects and how severe those effects are.
Fatal burden, which is expressed as years of life lost (YLL), measures the years lost between the age at which a person dies and the number of years they could have potentially gone on to live, based on the current best life expectancy across the world. Total YLL are influenced by both the number of deaths and the ages at which the deaths occur. (Note that YLL is different to 'premature mortality', described in 'Chapter 3.2 Premature mortality', which specifies an age cut-off in order to identify early deaths.)
Non-fatal and fatal burden are added together to produce a single summary measure called disability-adjusted life years (DALY). One DALY is one year of 'healthy life' lost due to illness and/or death—the more DALY associated with a disease or injury, the greater the burden. DALY are estimated for every occurrence of every disease and then added together for the whole population, to indicate the total disease burden.
The attributable burden is the amount of burden that could be avoided if the risk factor were removed. There are 29 separate risk factors analysed in the ABDS 2011. These were selected because they are modifiable and there is strong evidence that they are linked to diseases that occur in Australia. While it is an extensive list, it does not cover all potential risk factors.
Details on the methods used to calculate burden of disease are contained in the report Australian Burden of Disease Study: impact and causes of illness and death in Australia 2011.
Figure 3.1.1: Composition of total burden and DALY rate, by age and sex, 2011
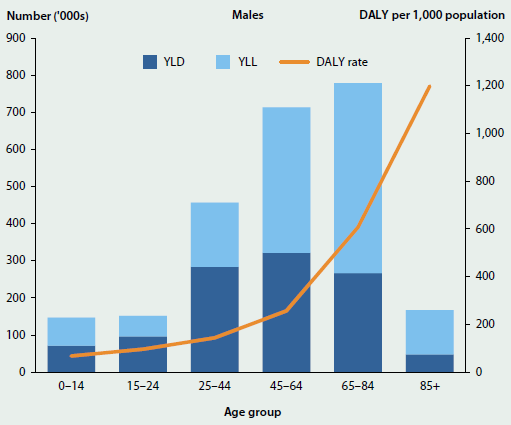
Source: Australian Burden of Disease Study 2011; Table S3.1.1.
Chronic diseases and injuries dominate
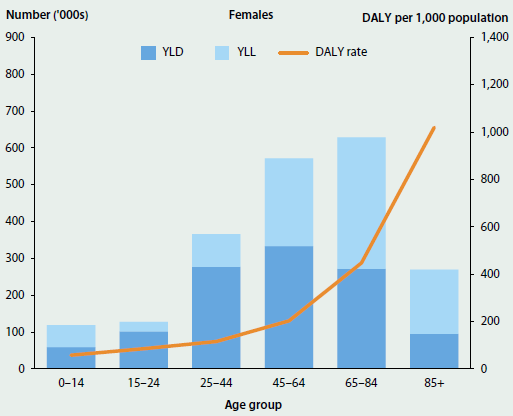
At the disease group level, cancer, cardiovascular disease, mental and substance use disorders, musculoskeletal disorders, and injuries contributed the most burden in Australia in 2011. Together, they accounted for around two-thirds of the disease burden (69% of males and 62% of females) (Figure 3.1.2). The patterns of disease group contribution for males and females were largely similar, although there were a few exceptions; for example, injuries accounted for a higher proportion of burden in males than females.
Figure 3.1.2: Burden of disease, by disease group and sex, 2011
Source: Australian Burden of Disease Study 2011; Table S3.1.2.
Among the five highest-burden disease groups, the total burden from cancer, cardiovascular disease and injuries was mainly due to people dying early, while the burden from mental and substance use disorders and musculoskeletal disorders was mainly due to people living with the various conditions. The small contribution of fatal burden in these two groups highlights the importance of including non-fatal health outcomes when measuring population health.
The share of burden between males and females also varied by disease group. Males experienced almost three-quarters (72%) of the burden from injury and a greater share of the burden from cardiovascular (59%), endocrine and infant and congenital diseases (57% each), and from cancer (56%). Females experienced a greater share of the burden from blood and metabolic disorders (59%), neurological conditions (58%) and musculoskeletal conditions (55%).
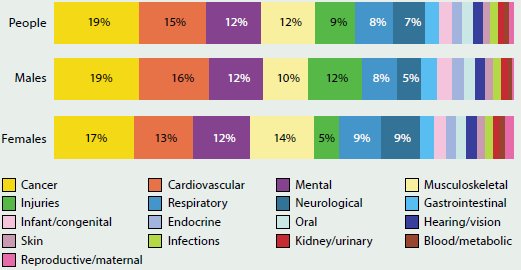
Across the life course, there is a change in the disease groups that cause the majority of burden. Infant and congenital conditions were the main causes of burden in infancy (Figure 3.1.3), while mental and substance use disorders were the main causes in late childhood, adolescence and adulthood to age 49. Cancer caused the most burden for those aged 50–79, while cardiovascular disease was the major cause of burden in older Australians. Other major causes of burden included respiratory conditions in children, adolescents and young adults; injuries in ages 15–44; musculoskeletal conditions in ages 25–74 and neurological conditions in older Australians.
Figure 3.1.3: Burden of disease, by disease group and age, 2011
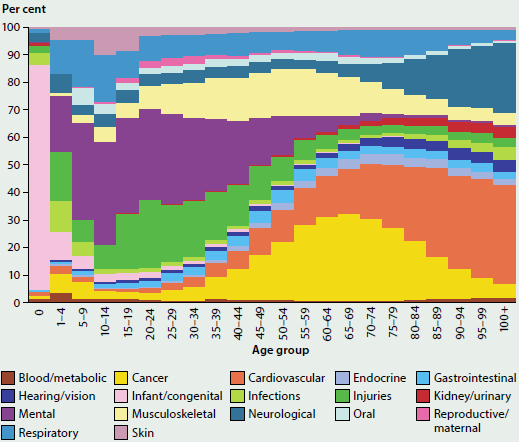
Source: Australian Burden of Disease Study 2011; Table S3.1.3.
Specific diseases causing the most burden
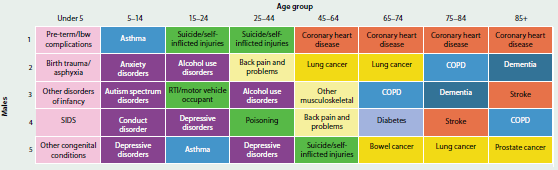
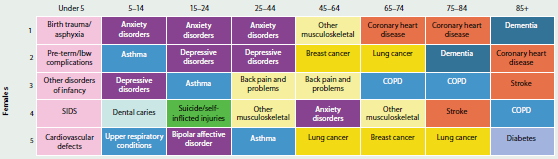
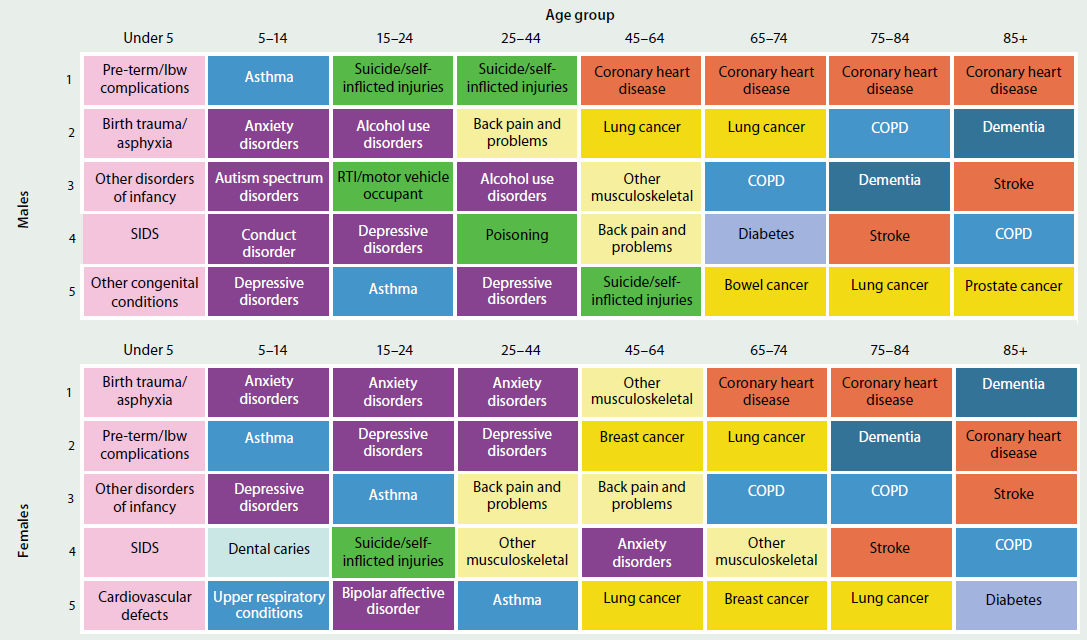
The diseases and injuries causing the most burden were generally similar for males and females, although there are some differences in specific age groups (Figure 3.1.4).
Infant and congenital conditions (specifically pre-term birth complications, birth trauma and asphyxia, sudden infant death syndrome, cardiovascular defects and other disorders of infancy) make up a large proportion of burden in children under 5 years.
Asthma was the main cause of burden in boys aged 5–14, followed by anxiety disorders, whereas in girls this order was reversed. Suicide and self-inflicted injuries were the main causes of health loss for males (15–44 years) but for females it continued to be anxiety disorders.
For men aged 45 and over, coronary heart disease was the leading cause of burden, followed by lung cancer for those aged 45–74, chronic obstructive pulmonary disease (COPD) for those aged 75–84 and dementia for those aged 85 and over. Other musculoskeletal disorders was the leading cause of burden in women aged 45–64, while coronary heart disease was the leading cause of burden in women aged 65–84. Dementia was the leading cause of burden in women aged 85 and over.
Stroke, COPD and diabetes were also responsible for a large proportion of burden in older Australians.
Figure 3.1.4: Leading causes of total burden, by age and sex, 2011
See this figure as a larger image
Source: Australian Burden of Disease Study 2011; Table S3.1.4.
Changes since 2003
There was a 6.9% increase in the number of DALY between 2003 and 2011, from 4.2 million to 4.5 million. However, after taking the impact of the increasing age of the population into account (by using age-standardised rates), overall burden decreased from 211 to 190 DALY per 1,000 people—a decrease of 10%. Most of this improvement came from decreases in the rate of fatal burden (15%), by preventing or delaying deaths from particular diseases or injuries. There was also a smaller (3.8%) improvement in the non-fatal burden. This suggests that, overall, the impact from gains in life expectancy for the population is not outweighed by more ill health.
Comparison of age-specific rates indicates that there was little change in overall burden between 2003 and 2011 for those aged 1–50. However, the burden was lower in 2011 for infants and those aged 55–89, but higher for those aged 95 or more. The increase in the number of DALY experienced by those aged 55–89 is due to the increased population in this group relative to 2003 (Figure 3.1.5).
Figure 3.1.5: Number and rates of total burden, by age, 2003 and 2011
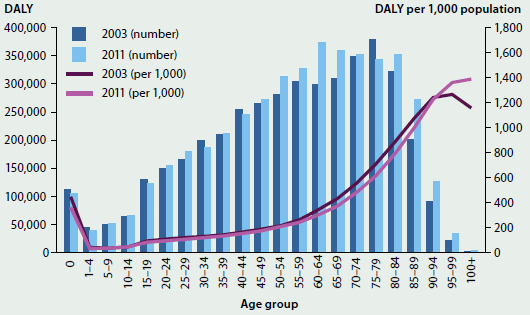
Source: Australian Burden of Disease Study 2011; Table S3.1.5.
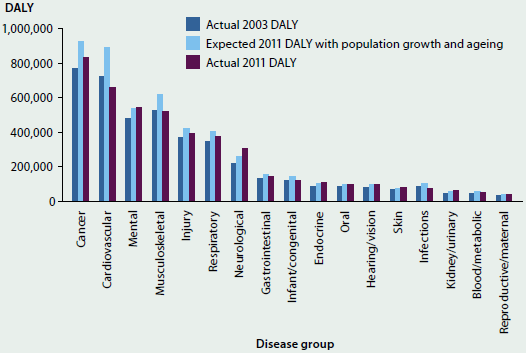
Figure 3.1.6 compares the actual estimates for 2003 and 2011 for each disease group with those that would have been expected based on population increase and ageing since 2003.
Generally, the actual 2011 DALY for most disease groups was lower than would have been expected. This indicates an improvement in the underlying disease burden of these groups.
Cardiovascular disease and infections were lower in 2011 than in 2003. While the overall burden of cancer and injuries was higher in 2011 than 2003, these increases were lower than expected based on population changes.
Conversely, actual 2011 DALY were substantially higher for neurological conditions than would be expected based on population changes. Kidney and urinary diseases, skin disorders, hearing and vision disorders, and endocrine disorders were also slightly higher than expected.
Figure 3.1.6: Expected and actual DALY, 2003 and 2011
Source: Australian Burden of Disease Study 2011; Table S3.1.6.
A large proportion of the burden is preventable
A large proportion (31%) of the burden experienced by the population could be prevented by reducing the exposure to modifiable risk factors.
The five risk factors included in the ABDS that caused the most burden were tobacco use, high body mass, high alcohol use, physical inactivity and high blood pressure (see 'Chapter 4 Determinants of health'). Table 3.1.1 also shows the proportion of burden (DALY) in each disease group attributable to that risk factor. For example, 22% of all cancer DALY is due to tobacco use, 4.5% is due to high body mass, 3.3% is due to alcohol use, and 6.4% is due to physical inactivity. (Note that it is not possible to add these proportions together to find the total amount of cancer DALY due to these risk factors, because the same burden may be attributed to more than one risk factor.)
While there are known associations between these risk factors and many diseases and conditions, burden was only attributed to a risk factor where there is sufficient evidence that the risk factor causes the disease and its contribution can be measured.
Table 3.1.1: Proportion of total burden, and burden of selected disease groups, attributable to the five risk factors causing the most burden, 2011
| Disease group |  Tobacco use (%) |  High body mass (%) |  High alcohol use (%) |  Physical inactivity (%) |  High blood pressure (%) |
|---|---|---|---|---|---|
| All disease groups | 9.0 | 5.5 | 5.1 | 5.0 | 4.9 |
| Disease group | Tobacco use (%) | High body mass (%) | High alcohol use (%) | Physical inactivity (%) | High blood pressure (%) |
|---|---|---|---|---|---|
| Cancer | 22.0 | 4.5 | 3.3 | 6.4 | |
| Cardiovascular | 12.0 | 21.1 | 4.8 | 21.2 | 31.7 |
| Mental | .. | .. | 12.2 | .. | .. |
| Injury | .. | .. | 20.6 | .. | .. |
| Respiratory | 36.2 | .. | .. | .. | .. |
| Endocrine | 3.5 | 49.4 | 2.0 | 29.7 | .. |
| Kidney/urinary | .. | 27.5 | .. | .. | 21.5 |
.. Indicates that there was no burden from this disease group that could be attributed to the risk factor in this study.
Source: Australian Burden of Disease Study 2011.
Overall, alcohol was the leading contributor to burden for those aged 0–44; tobacco for those aged 45–84; and high blood pressure for those over 85. From 0–84, males experienced a higher amount of burden due to the three top-ranking risk factors. After the age of 85, females experienced a higher amount of burden due to the top three risk factors.
The risk factors able to be measured in 2003 contributed to 28% of the total burden (DALY) in 2003. These same risk factors contributed to 27% of the total burden in 2011. This small decrease in the proportion of burden attributable to these common risk factors between 2003 and 2011 may reflect success in reducing either the exposure to these risk factors or the burden from the diseases and injuries linked to them.
How do we compare with other similar countries?
International comparisons are important and can provide a useful perspective on global disease burden. However, comparing the health of populations between countries is complex, with many factors being important. Comparisons of disease burden must be made using estimates that are internally consistent and produced using common methods. While the ABDS 2011 has sought to maintain the same broad methodological approach as used for recent global studies, there are sufficient differences that results from the ABDS 2011 cannot be compared with results from other burden of disease studies. Instead, the Global Burden of Disease (GBD) 2013 is used here to compare the burden of disease in Australia with other countries or regions.
When comparing the top 20 diseases contributing to DALY in Australia, using GBD 2013 results, most rates of burden for Australia were similar to the average rates for OECD countries (GBD 2013 Collaborators 2015). However, the rates of burden for ischaemic heart disease and lung cancer were significantly lower in Australia compared with the average rates of burden for OECD countries (Figure 3.1.7).
Figure 3.1.7: Total burden of selected high burden diseases in Australia compared with OECD countries, 2013
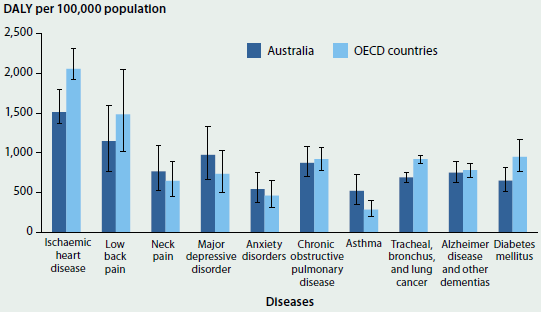
Source: AIHW analysis of GBD 2013; Table S3.1.7.
What is missing from the picture?
ABDS 2011 is based on the best current knowledge, methods and available data, as suited to the Australian context. Nevertheless, there are some limitations which further development work may reduce.
The ABDS 2011 burden of disease estimates are currently limited to 2003 and 2011. Frequent and up-to-date burden of disease estimates would provide better insight into the areas in which improvements are taking place, and which diseases, injuries or risk factors require greater attention from policymakers and service planners.
For the non-fatal component, ABDS 2011 was able to use detailed Australian data for many diseases and injuries. However, where some data gaps remain, reliance on overseas data or old Australian data remains. For some diseases, such as coronary heart disease and epilepsy, results were partly based on state-level linked hospital and deaths data from Western Australia, so may be limited as to their applicability to Australia as a whole. Reliability of estimates would be significantly improved if national linked data could be used.
The ABDS 2011 did not estimate the burden where diseases are also risk factors for other diseases (for example, diabetes is a risk factor for coronary heart disease). Projects are currently under way to estimate the burden due to diseases such as diabetes.
The scope of the ABDS 2011 report was limited to the total population (including by state and territory, remoteness area and socioeconomic group) and to Indigenous Australians; however, there are a range of other deeper analyses that can be undertaken using the available data. This includes looking more closely at: particular diseases and disease groups (for example, kidney disease); particular risk factors (for example, nutrition, intimate partner violence, social determinants of health); and certain population groups (for example, working age adults, older Australians). With appropriate data, further work could also be undertaken to disaggregate subnational estimates (for example, by state and territory by remoteness) or to explore the burden at local levels (for example, by Primary Health Networks).
Where do I go for more information?
More information, including an overview of methods and limitations, from the Australian Burden of Disease Study 2011.
Analysis from the Indigenous component of the ABDS 2011, and full documentation of methods, will be available later this year.
Reference
GBD (Global Burden of Disease) 2013 Collaborators 2015. Supplement to global, regional, and national incidence, prevalence, and years lived with disability for 301 acute and chronic diseases and injuries in 188 countries, 1990–2013: a systematic analysis for the Global Burden of Disease Study 2013. Lancet 386(9995):743-800; doi:10.1016/S0140-6736(15)60692-4.
3.2 Premature mortality
In Australia, as in most developed countries, the vast majority of deaths occur at older ages: the median age at death in 2013 was 82 years. In general, cancers and chronic diseases, such as coronary heart disease, are the leading causes of death at older ages. Deaths due to external causes of injury and poisoning, such as suicide and accidents, are more common among people younger than 45. Summary mortality statistics are usually influenced by diseases among the elderly and are less reflective of the patterns of deaths in younger age groups.
This article measures and describes the impact of premature mortality in Australia—that is, deaths among people younger than 75 (see Box 3.2.1). It highlights and expands on the web report, Premature mortality in Australia 1997–2012 and on the accompanying series, Leading cause of premature mortality in Australia fact sheets.
Box 3.2.1: Measuring premature mortality
'Premature mortality' refers to deaths that occur at an age earlier than a selected cut-off. For this analysis, deaths among people aged under 75 are considered premature. This is a conservative cut-off—it is lower than the current median age at death (82 years in 2013) and the current life expectancy at birth (80 for males and 84 for females in 2013). It was chosen to allow for comparisons over time, across population groups and between countries. Premature deaths can be summarised in terms of 'potential years of life lost' (PYLL). For example, if dying before the age of 75 is considered premature, then a person dying at age 40 would have lost 35 potential years of life. Premature mortality measures are distinct from burden of disease estimates, which normally uses the measure 'years of life lost' (YLL). See 'Chapter 3.1 Burden of disease and injury in Australia'.
Despite relatively high standards of health and health care in Australia, not all Australians fare equally well in terms of their health and longevity, including premature mortality (AIHW 2014). This article also examines differences in premature mortality among different population groups, specifically among people living outside Major cities or in lower socioeconomic areas.
Overview of premature mortality in Australia
Of all deaths in Australia in 2013, about 1 in 3 (34%) occurred among people aged under 75 (Figure 3.2.1), representing 50,900 premature deaths. This equates to a premature mortality rate of 235 deaths per 100,000 population (or about 1 in 426) aged under 75 or, put another way, there were 861,000 potential years of life lost as a result of death before the age of 75. Males accounted for 62% of premature deaths, and 85% of premature deaths were of people aged 45–74. A greater proportion of premature deaths were among infants aged under 1 (2.2%) than among children aged 1–14 (1.0%).
Figure 3.2.1: Premature mortality in Australia, by age and sex, 2013
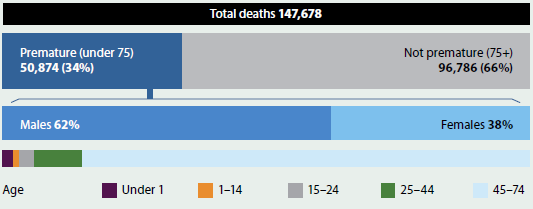
Source: AIHW National Mortality Database; Table S3.2.1.
The leading cause of premature death in 2011–2013 was coronary heart disease (10% of deaths among people aged under 75; see Table 3.2.1). Lung cancer (8.9%) was second but was the leading cause among females aged under 75. Suicide (4.6%) was the third leading cause of premature death and the greatest contributor to potential years of life lost. The top 10 causes of premature death together contributed 46% to the total causes of premature death.
Two of the leading causes of premature death among females are diseases that mainly affect females—more than 99% of breast cancer diagnoses (which ranked second among the 10 leading causes of premature death for women) are among females; and ovarian cancer (which ranked 9th) exclusively affects females.
Note that many of the following tables combine 3 years of data to reduce the effect of variations in death rates from year to year.
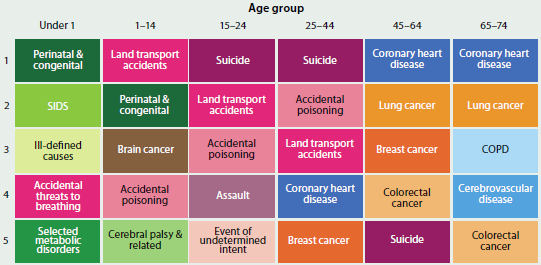
The leading causes of premature death differ by age (Figure 3.2.2). In general, deaths from chronic disease and cancer were more common among people aged 45 and over, while injury and accidental poisoning deaths were more common among people aged 1–44. (Accidental poisoning may result from agents such as alcohol, narcotics, sedatives and anti-inflammatory drugs.) Among infants, conditions originating in the perinatal period and congenital conditions were responsible for most deaths.
| Rank | Males Cause of death | Males Number | Males % | Females Cause of death | Females Number | Females % | People Cause of death | People Number | People % |
|---|---|---|---|---|---|---|---|---|---|
| 1 | Coronary heart disease | 11,887 | 12.7 | Lung cancer | 5,336 | 9.3 | Coronary heart disease | 15,223 | 10.1 |
| 2 | Lung cancer | 8,141 | 8.7 | Breast cancer | 5,259 | 9.2 | Lung cancer | 13,477 | 8.9 |
| 3 | Suicide | 5,161 | 5.5 | Coronary heart disease | 3,336 | 5.8 | Suicide | 6,881 | 4.6 |
| 4 | Colorectal cancer | 3,572 | 3.8 | COPD | 2,303 | 4.0 | Colorectal cancer | 5,867 | 3.9 |
| 5 | COPD | 3,003 | 3.2 | Colorectal cancer | 2,295 | 4.0 | COPD | 5,306 | 3.5 |
| 6 | Cerebrovascular disease | 2,995 | 3.2 | Cerebrovascular disease | 2,268 | 4.0 | Breast cancer | 5,296 | 3.5 |
| 7 | Land transport accidents | 2,672 | 2.9 | Cancer, unknown, ill-defined | 1,770 | 3.1 | Cerebrovascular disease | 5,263 | 3.5 |
| 8 | Liver disease | 2,665 | 2.8 | Suicide | 1,720 | 3.0 | Cancer, unknown, ill-defined | 4,346 | 2.9 |
| 9 | Cancer, unknown, ill-defined | 2,576 | 2.8 | Ovarian cancer | 1,600 | 2.8 | Liver disease | 3,836 | 2.5 |
| 10 | Diabetes | 2,425 | 2.6 | Pancreatic cancer | 1,589 | 2.8 | Pancreatic cancer | 3,826 | 2.5 |
Notes
- COPD refers to chronic obstructive pulmonary disease.
- % refers to the percentage of all deaths.
Source: AIHW National Mortality Database; Table S3.2.2.
Figure 3.2.2: Top five leading causes of premature death, by age, 2011–2013
Notes
- Colours indicate the broad cause of death category (blue = chronic disease, orange and brown = cancer, purple and pink = injury and poisoning, green = other cause of death).
- While cancers have been distinguished from other chronic diseases in this figure, they are also classed as chronic diseases.
- 'COPD' refers to chronic obstructive pulmonary disease.
Source: AIHW National Mortality Database; Table S3.2.2.
State and territory analysis
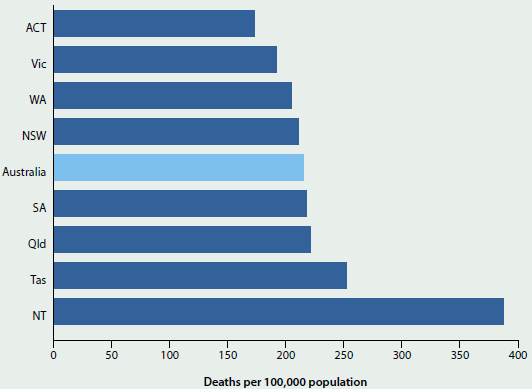
The rate of premature mortality varied considerably between states and territories in 2011–2013 (Figure 3.2.3). After adjusting for differences in age structure, the Australian Capital Territory had the lowest rate (173 deaths per 100,000 people aged under 75), followed by Victoria (192) and Western Australia (205). The age-standardised premature mortality rate in the Northern Territory (388) was more than twice as high as the rate in the Australian Capital Territory. The Northern Territory has the highest proportion of Indigenous residents (about 30%) of all Australian states and territories and the majority of the Northern Territory's land mass is classified as remote (Taylor & Bell 2013). The following section, 'Inequalities in premature mortality, describes the impact of remoteness of residence and Indigenous status on premature death.
Figure 3.2.3: Age-standardised premature mortality rates, by state and territory, 2011–2013
Source: AIHW National Mortality Database; Table S3.2.3.
The leading causes of premature death were similar across all states and territories (Table S3.2.3). Coronary heart disease and lung cancer were the two leading causes of death in all jurisdictions and suicide consistently featured in the top five. The most notable difference was that diabetes was the third leading cause of premature death in the Northern Territory (6.3%, compared with 2.5% and 11th ranking across Australia).
Inequalities in premature mortality
Premature mortality affects certain population groups disproportionately. This section discusses premature mortality in relation to remoteness of residence, socioeconomic groups and Indigenous status. Box 3.2.2 outlines measures of inequality.
Box 3.2.2: Measures of inequality
To calculate measures of inequality, each population group is compared with a relevant reference group. The reference group is the group with the most favourable outcome—that is, the lowest age-standardised premature mortality rate. (For example, Major cities is the reference group for remoteness areas, and the highest socioeconomic group is the reference group for socioeconomic comparisons.)
Relative inequality is represented by rate ratios—that is, the age-standardised premature mortality rate for the group of interest relative to (divided by) the rate for the reference group. A rate ratio of greater than 1 indicates that the rate for the group of interest is higher than the rate for the reference group. A rate ratio of less than 1 indicates that the rate for the group of interest is lower than the rate for the reference group. A rate ratio of 1 indicates that the rate for the group of interest is the same as the rate for the reference group.
Remoteness area
The majority of Australians live in Major cities, with fewer than 3 in 10 people (29% of the population) living in Regional and Remote areas (see 'Chapter 5.11 Rural and remote health'). Despite this, in 2011–2013, deaths in Regional and Remote areas accounted for 38% of premature deaths.
Premature mortality rates increased with remoteness. The premature mortality rate among people living in Remote areas was 1.6 times as high as the rate among people in Major cities, and in Very remote areas it was 2.2 times as high.
Figure 3.2.4 shows the top five causes of premature death for each remoteness area. Coronary heart disease was the leading cause for all areas, and mortality rates were between 1.2 and 3.3 times as high in Regional and Remote areas as in Major cities. Diabetes was the second leading cause of premature death in Very remote areas and the rate of dying from diabetes was 7.8 times as high as in Major cities. For premature deaths due to land transport accidents, rates were more than 5 times as high in Remote and Very remote areas as in Major cities.
Figure 3.2.4: Top five leading causes of premature death, by remoteness area, 2011–2013
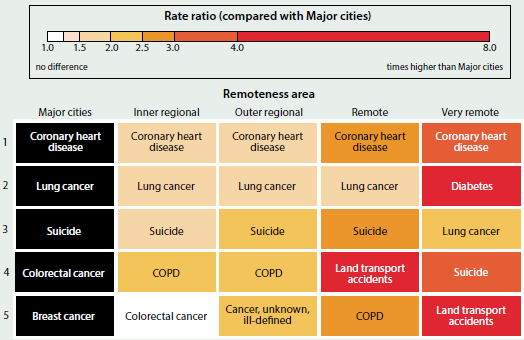
Notes
- 'COPD' refers to chronic obstructive pulmonary disease.
- Colours represent the rate ratio of the age-standardised premature mortality rate for each remoteness area, compared with the age-standardised premature mortality rate for Major cities.
Source: AIHW National Mortality Database; Table S3.2.4.
Socioeconomic groups
Socioeconomic factors, including associated disadvantage, are important determinants of health and wellbeing in Australia (see 'Chapter 5.1 Health across socioeconomic groups'). People living in the lowest socioeconomic areas had a premature mortality rate that was 2 times as high as the rate among people living in the highest socioeconomic areas. The effects of a 'social gradient' are also apparent, where each step up the socioeconomic ladder is generally associated with better health and lower levels of risk factors (for details see Australia's health 2012).
The leading causes of premature death among all five socioeconomic groups were coronary heart disease followed by lung cancer (Figure 3.2.5). For both causes of death, rates increased as disadvantage increased. Of the top five causes of premature death in each socioeconomic group, the largest relative inequality in premature mortality rates was for chronic obstructive pulmonary disease (COPD; 3.8 times as high in the lowest socioeconomic group and 3.0 times as high in the second lowest group as in the highest group).
Figure 3.2.5: Top five leading causes of premature death, by socioeconomic group, 2011–2013
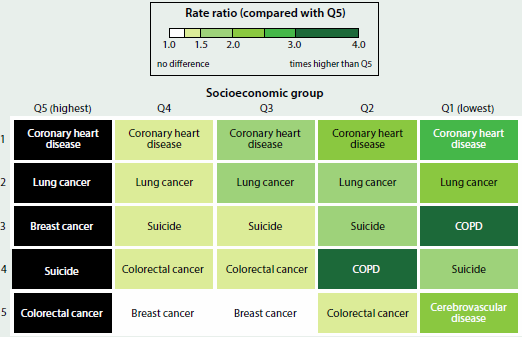
Notes
- Q1–Q5 refer to area-based quintiles classified according to Socio-Economic Indexes for Areas 2011 (ABS 2011), specifically the Index of Relative Socio-Economic Disadvantage (IRSD).
- 'COPD' refers to chronic obstructive pulmonary disease.
- Colours represent the rate ratio of the age-standardised premature mortality rate for each socioeconomic group compared with the age-standardised premature mortality rate for the highest socioeconomic group.
Source: AIHW National Mortality Database; Table S3.2.5.
Indigenous Australians
In 2013, there were about 2,600 deaths registered (1.8% of all deaths) for people of Aboriginal or Torres Strait Islander origin in the five jurisdictions for which the quality of Indigenous identification in the data is considered to be adequate—New South Wales, Queensland, Western Australia, South Australia and the Northern Territory. Because Indigenous Australians have a much younger population and have higher death rates at younger ages, a relatively large proportion of Indigenous deaths occur before the age of 75. Around 81% of deaths among Indigenous people occurred before the age of 75, compared with 34% of deaths for non-Indigenous people during the period 2009–2013 (ABS 2015). For more information, see 'Chapter 5.8 Main contributors to the Indigenous life expectancy gap', and the reports Mortality and life expectancy of Indigenous Australians 2008 to 2012 and The health and welfare of Australia's Aboriginal and Torres Strait Islander peoples: 2015.
How have premature death rates changed over time?
Between 1907 and 2013, the premature mortality rate fell by 71% for males and 78% for females (Figure 3.2.6). Deaths of people aged under 75 accounted for 84% of all deaths in 1907 compared with 34% of all deaths in 2013. In 1973, the premature death rate among males was 1.7 times as high as that for females. The gap between males and females fell over the following four decades, and in 2013 the premature death rate for males was 1.6 times as high as that for females.
Figure 3.2.6: Premature mortality rates, by sex, 1907–2013
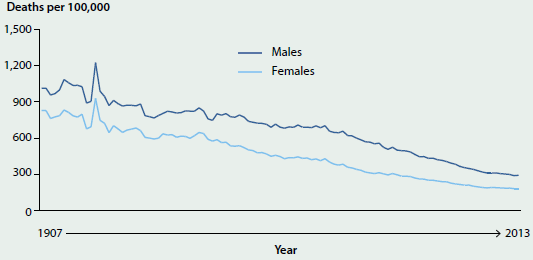
Source: AIHW 2016; Table S3.2.6.
What has influenced trends in premature deaths?
There has been a long and continuing fall in premature mortality in Australia. The decline in premature deaths in the first half of the last century was associated with factors such as control of infectious disease and better hygiene and nutrition. The decline in the later years was associated with improvements in road safety measures and in the prevention, detection and treatment of disease such as cardiovascular disease and other chronic diseases. Substantial improvements have also occurred through behavioural and policy changes to reduce the effect of 'modifiable' risk factors such as smoking, physical inactivity, poor nutrition and excessive consumption of alcohol.
The following are examples of factors that have influenced trends for some of the leading causes of premature deaths in Australia.
 The fall in premature mortality from chronic diseases such as coronary heart disease and cerebrovascular disease has been heavily driven by improvements in reducing risk factors such as high blood pressure (hypertension) and high blood cholesterol (see 'Chapter 4.3 Biomedical risk factors'). There have been marked increases in the use of statins to treat high cholesterol and of anti-hypertensive medication to treat high blood pressure, as well as improvements in rates of smoking and other risk factors.
 Chronic obstructive pulmonary disease (COPD) and lung cancer mortality trends in Australia are greatly affected by smoking trends. In 1973, health warnings on cigarette packets were introduced in Australia. In 1976, tobacco smoking advertising on radio and television was banned and, in 1985, anti-smoking commercials began to air on television. Smoking was banned in all pubs and clubs across Australia by 2010—the same year excise and customs duty on cigarettes rose by 25%. Mandatory graphic warnings on packaging of tobacco products about the health effects of smoking were introduced in 2004, followed by mandatory plain packaging of tobacco products in 2012. This range of interventions has influenced smoking rates in Australia and thereby premature death due to diseases related to smoking (see 'Chapter 4.7 Tobacco smoking').
 Australia has achieved significant and lasting reductions in land transport deaths as a result of road improvements, safer vehicles, lower speed limits, graduated licensing and a range of programs that target the behaviour of individuals—such as seatbelt laws (applicable across Australia by 1972), random breath testing (first introduced in 1976 in Victoria), and slower default speed limits in urban areas and school zones (progressively implemented across Australia from 1997).
 The 'mechanism' or 'means' for suicide deaths differ greatly between subgroups and have changed considerably over time. Some trends can be explained by the availability of certain mechanisms. For example, peaks in premature deaths from poisoning by drugs may be attributable to the availability of certain drugs. Likewise, restrictions to firearm access, introduced in 1996, have been linked to reduced suicides. Organisations that provide information and crisis support, safety measures such as the removal of access to weapons, and the construction of physical barriers (at known 'jump-points'), are likely to have also influenced premature mortality trends.
Services available for people at risk of suicide
Lifeline 13 11 14
Kids Help Line 1800 55 1800
Suicide Call Back Service 1300 659 467
What is missing from the picture?
Premature mortality data presented here do not account for quality of life or increasing life expectancy. Burden of disease analyses, however, quantify the effects of disease and injury in terms of 'healthy life' lost due to premature death or disability (see 'Chapter 3.1 Burden of disease and injury in Australia').
Geographic information is reported at aggregated levels in this article (for example, by state and territory, remoteness area and socioeconomic group). Although this is indicative of inequalities, it does not present the full spectrum of mortality inequalities across Australia (for example, between neighbouring suburbs/towns).
Socioeconomic factors such as the highest level of education a person achieves and main occupation are known to be associated with mortality and particular causes of death (AIHW 2014). This information is not collected in Australian deaths data.
There is a lag between some population-level approaches that target key risk factors (for example, tobacco control measures) and the reductions in premature deaths due to related causes (for example, lung cancer and COPD). As such, it is not always possible to directly correlate changes in mortality rates with specific interventions.
Further analysis could be undertaken, such as using linked data, to determine if improvements in premature mortality rates are shared equally across different populations or if particular groups are faring better than others.
Where do I go for more information?
More information on premature mortality, including 15 fact sheets on leading causes of premature mortality and the General Record of Incidence of Mortality (GRIM) books are available on the AIHW website.
References
ABS (Australian Bureau of Statistics) 2011. SEIFA 2011. Canberra: ABS. Viewed 24 March 2016.
ABS 2015. Causes of death, Australia, 2013. ABS cat. no. 3303.0. Canberra: ABS.
AIHW 2014. Mortality inequalities in Australia 2009–2011. AIHW bulletin no. 124. Cat. no. AUS 184. Canberra: AIHW.
AIHW 2016. General Record of Incidence of Mortality (GRIM) books. Canberra: AIHW. Viewed 27 January 2016.
Taylor A & Bell L 2013. The Northern Territory's declining share of Australia's Indigenous population: a call for a research agenda. Darwin: The Northern Institute, Charles Darwin University.
3.3 Chronic disease and comorbidities
Chronic diseases are the leading cause of ill health, disability and death, and have a significant impact on the health sector. The term 'chronic disease' refers to a wide group of conditions, illnesses and diseases. Chronic diseases are generally characterised by their long-lasting and persistent effects, which distinguish them from 'acute' conditions—that is, conditions that first manifest over a short period, and often with potentially intense and severe effects.
Chronic diseases can range from mild conditions such as short- and long-sightedness, mild dental decay and minor hearing loss, to debilitating arthritis and low back pain, to life-threatening heart disease and cancers. They can result from the complex interaction of external factors and biological causes, usually over a long period, and can lead to functional limitations and disability. If the biological and metabolic changes that occur during these long latency periods were identified, early intervention strategies, including prevention, treatment and management plans, may be implemented. Once present, chronic diseases often persist throughout a person's life, so there is generally a need for long-term management by individuals and health professionals.
Data on some of the most common and important chronic diseases are featured in individual snapshots in this chapter. This article focuses on a specific group of chronic diseases, using a single data source to enable comorbidity analyses (see Box 3.3.1 for more detail). The prevalence estimates presented here may differ from elsewhere in this report because estimates for each chronic disease can vary between data sources. For example, self-reported data for chronic kidney disease substantially underestimate its prevalence compared with biomedical testing: 1% versus 10% respectively (AIHW 2014).
Who suffers from chronic disease?
In 2014–15, more than 11 million Australians (50%) reported having at least one of the eight selected chronic diseases. This rate was higher for:
 People aged 65 and over (87%) compared with people aged 0–44 (35%).
 Females (52%) compared with males (48%).
 People in the lowest socioeconomic areas (55%) compared with those in the highest socioeconomic areas (47%).
 People living in Regional and Remote areas (54% compared with those in Major cities (48%).
Box 3.3.1: Classifying chronic diseases
Although chronic diseases cover a diverse group of conditions, the analyses presented in this feature article focuses on self-reported data from the Australian Bureau of Statistics (ABS) 2014–15 National Health Survey (NHS) (ABS 2015), unless otherwise specified, for the following eight chronic diseases:
- arthritis
- asthma
- back pain and problems
- cancer (such as lung and colorectal cancer)
- cardiovascular disease (such as coronary heart disease and stroke)
- chronic obstructive pulmonary disease (COPD)
- diabetes
- mental health conditions (such as depression).
These diseases were selected because they are common, pose significant health problems, have been the focus of ongoing national surveillance efforts, and action can be taken to prevent them. Chronic kidney disease is not included because of the low numbers identified using self-reported data.
Using the self-reported data from the 2014–15 NHS enables us to look at the co-occurrence of chronic diseases across the Australian population (comorbidity), which is not possible using separate data sources.
What are the most common chronic diseases?
Based on self-reported data, cardiovascular disease (18%) and mental health conditions (18%) were the most commonly reported of the selected chronic diseases in Australia, followed by back pain and problems (16%) (Figure 3.3.1). Among males, cardiovascular disease (18%) was followed by back pain and problems (16%) and among females, mental health conditions (19%) and cardiovascular disease (19%) were most common.
The most common chronic diseases reported varied by age group. Of the eight selected chronic diseases, mental health conditions (16%) and asthma (11%) were the most common among people aged under 45. Cardiovascular disease (27%) and arthritis (26%) were the most common among people aged 45–64 and also for people aged 65 and over (59% and 51%, respectively).
Measuring disease prevalence alone does not provide a complete picture of the impact of chronic disease. For example, based on self-reported survey data, just 2.6% of the population said that they had COPD but it was the fifth leading cause of death in 2013 (4.4% of all deaths). (For more information, see chapters '1.3 How healthy are Australians?' and '3.10 Chronic respiratory conditions'.) This under-reporting may be because some chronic diseases have fewer treatment options, higher mortality rates, or remain undiagnosed until the disease has progressed to a life-threatening stage.
Figure 3.3.1: Most common selected chronic diseases, by age and sex, 2014–15
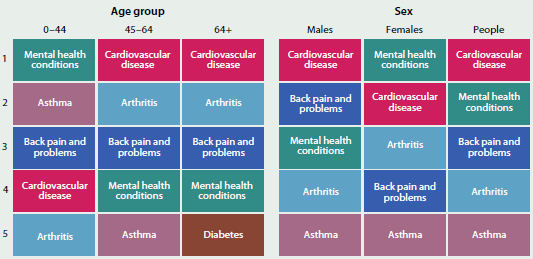
Note: The selected chronic diseases are: arthritis, asthma, back pain and problems, cancer, cardiovascular disease, chronic obstructive pulmonary disease, diabetes, and mental health conditions.
Sources: ABS 2015 (Table 19.1); Table S3.3.1.
Of the eight selected chronic diseases, cancer (1.6%) was the least prevalent, based on self-reported data. Some people diagnosed with cancer may consider it to be a one-off event rather than a 'long-term' condition. However, cancers can recur multiple times in a person and over an extended time. As treatments and survival rates improve, cancer is increasingly viewed as a chronic disease that may not be cured, but can often be managed for months or even years (American Cancer Society 2015).
What are the impacts?
Changes to our lifestyles and reduction in other diseases in the last hundred years have meant that chronic diseases are increasingly common and now cause most of the burden of ill health. They can have large impacts on quality of life and have social and economic effects.
The eight selected chronic diseases were associated with:
 Around 1 in 3 (30%) problems managed in general practice in 2014–15 (Britt et al. 2015).
 More than 1 in 3 (39%) potentially preventable hospitalisations in 2013–14 (AIHW 2015).
 More than three-fifths (61%) of the total burden of disease in 2011 (AIHW 2016a).
 Over 7 in 10 (73%) deaths in 2013 (AIHW 2016b).
Many chronic diseases are amenable to preventive measures such as changes in behaviour. These changes, together with timely and effective medical treatments, are important in improving chronic disease health outcomes.
What are the risk factors?
Many factors influence how healthy we are. Some of these have an impact at an individual level (for example, health behaviours or genetic make-up), while others have an impact at a broader societal level, such as the availability of health services, vaccination programs or a clean and healthy environment. As already noted, the occurrence of chronic diseases increases with age. Many chronic diseases share common risk factors which are largely preventable. Modifying these risk factors can reduce the risk of developing a chronic disease and result in large population health gains by reducing illness and rates of death.
The onset of chronic disease is linked to a number of different behavioural and biomedical risk factors that can affect disease management and progression. Behavioural risk factors include physical inactivity and poor nutrition, smoking, risky alcohol consumption and illicit drug use. Biomedical characteristics that contribute to the development of chronic disease include overweight and obesity, high blood pressure, dyslipidaemia (for example, high blood cholesterol) and impaired fasting glucose. Biomedical risk factors are often influenced by behavioural risk factors. For more information, see 'Chapter 4 Determinants of health'.
About comorbidity
Comorbidity refers to the occurrence of two or more diseases in a person at one time. While the existence of these multiple health conditions may be unrelated, in many instances—and particularly in relation to chronic diseases—there is some association between them. Further, a range of chronic diseases share common risk factors. Understanding more about comorbidities can provide vital information for prevention, management and treatment of chronic diseases.
Who experiences comorbidity?
Overall, 1 in 4 (23%) Australians – 5.3 million people – had two or more of the eight selected chronic diseases in 2014–15. The rate was higher for:
 People aged 65 and over (60%) compared with people aged 0–44 (9.7%).
 Females (25%) compared with males (21%).
 People living in the lowest socioeconomic areas (30%) compared with the highest socioeconomic areas (19%).
 People living in Regional and Remote areas (28%) compared with Major cities (21%).
The rate of comorbidity and the number of chronic diseases experienced (based on self-reported data) increases with age. Almost 1 in 3 (29%) people aged 65 and over reported having three or more chronic diseases, compared with just 2.4% of those under 45 (Figure 3.3.2).
Figure 3.3.2: Comorbidity of selected chronic diseases, by age, 2014–15
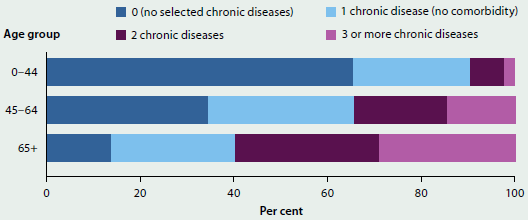
Note: The selected chronic diseases are: arthritis, asthma, back pain and problems, cancer, cardiovascular disease, chronic obstructive pulmonary disease, diabetes, and mental health conditions.
Sources: ABS 2015 (Table 18.3); Table S3.3.2.
What are the most common chronic disease comorbidities?
The most common comorbidity combination was arthritis with cardiovascular disease (7.4%), followed by arthritis with back pain and problems (5.1%), and back pain and problems with cardiovascular disease (5.0%). Arthritis with cardiovascular disease was the most frequently occurring comorbidity combination in both males (6.3%) and females (8.5%), and reflected the pattern in the overall population. Back pain featured in the second and third most common comorbidities among both males and females; among males it most frequently occurred with cardiovascular disease (5.1%) and mental health conditions (4.5%), and among females it featured with arthritis (5.8%) and mental health conditions (5.2%).
The top three chronic disease combinations for people aged 45–64, and for those aged 65 and over, reflected the pattern in the overall population but with higher rates, particularly for the 65-and-over age group: arthritis occurring with cardiovascular disease (32%), followed by arthritis with back pain and problems (17%), and back pain and problems with cardiovascular disease (16%). Among the 0–44 age group, combinations with mental health conditions were more common, co-occurring with back pain and problems for 3.3% and asthma for 2.7% (Figure 3.3.3).
Figure 3.3.3: Most common comorbidities of selected chronic diseases, by age, 2014–15
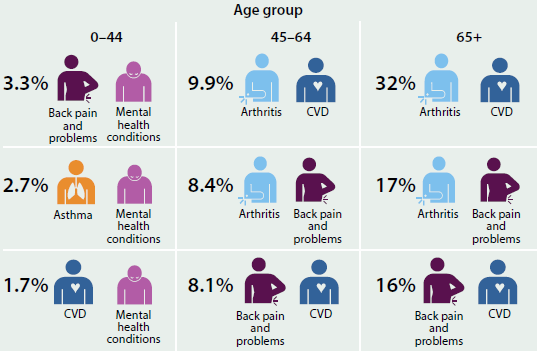
Source: ABS 2015 (Table 19.1).
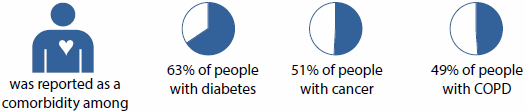
Comorbidity among selected chronic diseases
Although cancer (1.6%), COPD (2.6%) and diabetes (5.1%) were the least reported of the eight selected chronic diseases in the 2014–15 NHS, people with these conditions were more likely than people with other conditions to have a comorbidity (90% of people with COPD, 85% of people with diabetes, and 82% of people with cancer had two or more chronic diseases; Figure 3.3.4). This is because people with COPD, diabetes or cancer tend to be older, and the likelihood of having multiple chronic diseases increases with age.
Figure 3.3.4: Comorbidity of selected chronic diseases, by chronic disease, 2014–15
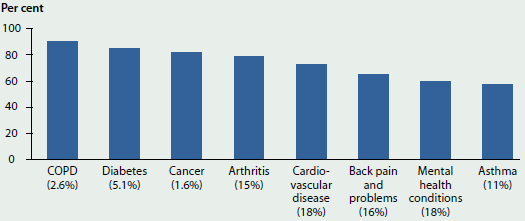
COPD = chronic obstructive pulmonary disease.
Notes
- Y-axis % refers to the percentage of people with each chronic disease who had at least one other chronic disease (comorbidity).
- X-axis label % refers to the percentage of the population with each chronic disease (prevalence).
Sources: ABS 2015 (tables 3.3 and 19.3); Table S3.3.4.
Some chronic diseases may act as a precursor or as a risk factor for other chronic diseases. For example, having diabetes is known to be a risk factor for developing cardiovascular disease (AIHW 2014), and people with asthma are at greater risk of developing COPD later in life (ACAM 2011).
Other chronic diseases affect similar parts of the body and may manifest as comorbidity. For example, both arthritis and back pain and problems cause pain in muscles, bones and joints.
Common comorbidities of the eight selected chronic diseases by broader body system groupings include:
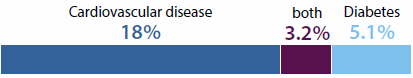
Vascular diseases
742,000 people (3.2%) reported having both cardiovascular disease and diabetes.
Musculoskeletal conditions
1.2 million people (5.1%) reported having both arthritis and back pain and problems.

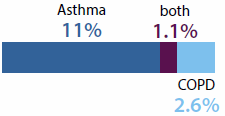
Chronic respiratory conditions
250,000 people (1.1%) reported having both asthma and COPD.
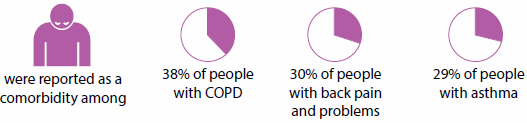
Among people with any of the eight selected chronic diseases, the most commonly reported comorbid chronic diseases were cardiovascular disease, arthritis, back pain and problems, and mental health conditions. These four conditions featured prominently as comorbidities because they are strongly age related and the most commonly reported chronic diseases. For example:
Cardiovascular disease
Arthritis
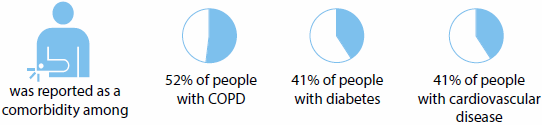
Back pain and problems
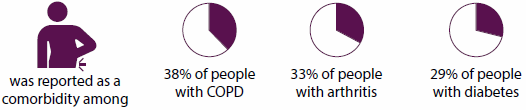
Mental health conditions
What is the future of chronic disease and its comorbidities?
If left unchecked, trends in chronic disease risk factors (especially physical inactivity and poor nutrition leading to overweight and obesity), combined with a growing and ageing population and better treatment and management, will lead to increasing numbers of people living with chronic diseases. Helping people to make good lifestyle choices and having an accessible and integrated health care system can help to keep people in good health and prevent illness.
The growing burden of chronic disease will place more importance on the effective treatment of multiple chronic conditions and complex health care needs. Developing and implementing new and innovative methods for early detection of disease and treatment—including coordinated care, self-management and chronic disease management plans—holds promise for future disease management.
What is the AIHW doing?
The AIHW develops and maintains national data to support monitoring and reporting on specific chronic diseases, such as cardiovascular disease, diabetes, kidney disease, cancer, musculoskeletal conditions and respiratory conditions. This includes reports on individual chronic diseases, comorbidities and common risk factors.
The Australian Burden of Disease Study complements the work of the chronic disease monitoring centres and combines multiple data sources to count and compare the total fatal and non-fatal health loss due to a range of diseases and injuries. For more information, see 'Chapter 3.1 Burden of disease and injury in Australia'.
The AIHW also reports on the use of health services among people with chronic disease (for example, hospital admissions and mental health services); disparities in specific population groups (for example, prisoners and Indigenous Australians); and disease expenditure.
In addition, the Department of Health is developing the National Strategic Framework for Chronic Conditions. This will be the foundation chronic conditions policy document that sets the direction and outcomes required to achieve the vision that all Australians live healthier lives: with reduced risk, or delayed onset, of developing a chronic condition; and/or with their chronic condition/s well managed.
What is missing from the picture?
Better statistical information on the incidence and prevalence of chronic diseases could benefit future health services planning. Some chronic diseases such as dementia are not readily identifiable in health surveys.
Additional data on comorbidity and treatment—including on primary care; health service use; medications and whether these are being taken correctly; quality of life; and people's ability to carry out their daily lives—will also help to develop a picture of how chronic diseases affect people in Australia and the effectiveness of current strategies.
Data and information on chronic disease would greatly benefit from data linkage to monitor disease progression; comorbidities; service use and costs; patient journeys and care pathways; outcomes; and interactions between disease and risk factors.
Where do I go for more information?
More information on chronic disease and its comorbidities is available on the AIHW website. For specific chronic diseases, refer elsewhere in this chapter.
References
ABS (Australian Bureau of Statistics) 2015. National Health Survey: first results 2014–15. ABS cat. no. 4364.0.55.001. Canberra: ABS.
ACAM (Australian Centre for Asthma Monitoring) 2011. Asthma in Australia 2011: with a focus chapter on chronic obstructive pulmonary disease. Asthma series no. 4. Cat. no. ACM 22. Canberra: AIHW.
AIHW (Australian Institute of Health and Welfare) 2014. Cardiovascular disease, diabetes and chronic kidney disease: Australian facts: prevalence and incidence. Cardiovascular, diabetes and chronic kidney disease series no. 2. Cat. no. CDK 2. Canberra: AIHW.
AIHW 2015. Admitted patient care 2013–14: Australian hospital statistics. Health services series no. 60. Cat. no. HSE 156. Canberra: AIHW.
AIHW 2016a. Australian Burden of Disease Study: impact and cause of illness and death in Australia 2011. Australian Burden of Disease Study series no. 3. Cat. no. BOD 4. Canberra: AIHW.
AIHW 2016b. General Record of Incidence of Mortality (GRIM) books. Canberra: AIHW. Viewed 27 January 2016.
American Cancer Society 2015. When cancer comes back: cancer recurrence. Atlanta: American Cancer Society. Viewed 18 November 2015.
Britt H, Miller GC, Henderson J, Bayram C, Harrison C, Valenti L et al. 2015. General practice activity in Australia 2014–15. General practice series no. 38. Sydney: Sydney University Press.
3.4 Cancer
Cancer is a diverse group of several hundred diseases in which some of the body's cells become abnormal and begin to multiply out of control. Cancer has a significant social and economic impact on individuals, families and the community in terms of premature mortality, absence from work, and the provision of health care infrastructure.
Cancer is a major cause of morbidity internationally, with an estimated 14.1 million new cancer cases diagnosed and 8.2 million cancer-related deaths in 2012 (GLOBOCAN 2012). Collectively, cancer and other neoplasms were responsible for almost one-fifth (19%) of the total burden of disease and injury in Australia in 2011, making it the most burdensome group of diseases. Despite the high survival and prevalence rates of cancer in Australia (AIHW 2014), this burden was almost entirely due to premature death, with only 6.1% of this burden due to living with cancer.
Common non-melanoma skin cancers, including basal cell carcinoma (BCC) and squamous cell carcinoma (SCC) are not reportable to cancer registries. As a result, incidence, survival and prevalence data for all cancers combined do not include BCC and SCC.
In this section, estimates for 2016 are presented for cancer incidence and mortality in Australia to provide the most up-to-date information possible. The estimates presented here are a mathematical extrapolation of past trends.
Incidence
In 2016, it is estimated that:
- about 130,000 new cases of cancer will be diagnosed in Australia (excluding basal and squamous cell carcinoma of the skin—which are the most common types of non-melanoma skin cancer). More than half (55%) of these cases will be diagnosed in males
- the risk of being diagnosed with any cancer before the age of 85 will be 1 in 2 for males and 1 in 3 for females
- the most commonly diagnosed cancers in males will be prostate cancer (18,100 cases), colorectal cancer (9,810), melanoma of the skin (7,850), lung cancer (7,130) and head and neck cancers (3,430)
- the most commonly diagnosed cancers in females will be breast cancer (15,900 cases), colorectal cancer (7,700), melanoma of the skin (5,440), lung cancer (5,070) and uterine cancer (2,650).
From 1982 to 2016, it is estimated that the age-standardised incidence rate for all cancers combined will increase by 22%, from 383 new cases per 100,000 population to 467 per 100,000 (Figure 3.4.1). This increasing trend can be largely attributed to the rise in the number of prostate cancers, breast cancers in females and colorectal cancers that are diagnosed, as well as improved diagnoses through population health screening programs and improvements in the technologies and techniques used to identify and diagnose cancer.
Figure 3.4.1: Estimated incidence of all cancers combined(a), Australia, 2016(b)
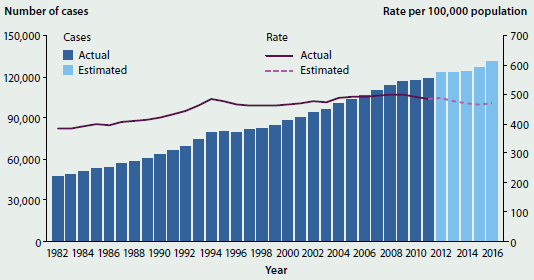
- Cancers coded in the ICD-10 as C00-C97, D45, D46, D47.1 and D47.3, except those C44 codes that indicate a basal or squamous cell carcinoma of the skin.
- The 2016 estimates are based on 2002–2011 incidence data. The projected numbers of cancer cases diagnosed are rounded to the nearest 10. The estimates for males and females may not add up to the estimates for the population due to rounding.
Note: The rates were standardised to the Australian population as at 30 June 2001 and are expressed per 100,000 population.
Source: AIHW ACD 2011.
Hospitalisations
In 2013–14 in Australia, there were around 936,000 cancer-related hospitalisations (see Glossary). This was an increase of 44% from 2001–02, when there were around 649,000 cancer-related hospitalisations. Over the same period, the age-standardised cancer-related hospitalisation rate increased by 8.9% from 337 per 10,000 population to 367 per 10,000.
In 2013–14, there were around 520,000 hospitalisations where the principal diagnosis was a cancer-related treatment or service. The top five most common reasons for cancer-related hospitalisations accounted for 96% of all hospitalisations where the principal diagnosis was a cancer-related treatment or service (Table 3.4.1).
| Principal diagnosis | Number | % |
|---|---|---|
| Pharmacotherapy session for neoplasm (chemotherapy) | 392,385 | 75.4 |
| Special screening examination for neoplasm of intestinal tract | 56,644 | 10.9 |
| Follow-up after surgery for cancer(b) | 41,971 | 8.1 |
| Adjustment and management of vascular access device | 5,636 | 1.1 |
| Follow-up examination after combined treatment for malignant neoplasm | 5,132 | 1.0 |
| Total five most common reasons for hospitalisation when the principal diagnosis was a cancer-related treatment or service | 501,759 | 96.5 |
| Total hospitalisations with a principal diagnosis of a cancer-related treatment or service(c) | 520,224 | 100.0 |
Hospitalisation for which the care type was reported as 'Newborn' with no qualified days, and records for 'Hospital boarders' and 'Posthumous organ procurement' have been excluded from the analysis.
Follow-up after surgery for cancer may include further surgery.
Hospitalisations in which the principal diagnosis is a health service or treatment that may be related to treatment of cancer.
Source: AIHW NHMD.
Survival
Information on survival from cancer provides an indication of cancer prognosis and the effectiveness of treatment available. Survival of less than 100% suggests that those with cancer had a lower chance of surviving for at least 5 years after diagnosis than the general population.
In 2007–2011 in Australia:
- people diagnosed with cancer had a lower (67%) chance of surviving for at least 5 years after diagnosis compared with their counterparts in the general population (referred to as '5-year relative survival, see Glossary). Among people who had already survived 5 years past their cancer diagnosis, the chance of surviving for at least another 5 years was 91%
- females diagnosed with cancer had slightly higher survival rates than males (5-year relative survival of 68% and 66% respectively). For males diagnosed with cancer, the 5-year relative survival was highest for testicular cancer (98%), lip cancer (93%) and prostate cancer (93%)
- for females diagnosed with cancer, the 5-year relative survival was highest for thyroid cancer (97%), lip cancer (94%) and melanoma of the skin (94%).
From 1982–1986 to 2007–2011:
- five-year relative survival for all cancers combined increased from 40% to 66% for males and from 52% to 68% for females
- the cancers that had the largest absolute increase in survival were prostate cancer, kidney cancer, non-Hodgkin lymphoma, colorectal cancer, myeloma, Hodgkin lymphoma and anal cancer, for which 5-year survival increased by 18 percentage points or more
- many cancers that had low survival in 1982–1986 showed improvements, such as pancreatic cancer (from 3.5% to 6.1%) and lung cancer (from 8.5% to 14.3%).
Prevalence
At the end of 2010 in Australia:
- around 385,000 people were alive who had been diagnosed with cancer within the previous 5 years; this represented 1.7% of the Australian population
- 5-year prevalence was higher for males than females (representing 56% and 44% of all prevalence cases, respectively)
- among males, 5-year prevalence was highest for prostate cancer (42% of total male 5-year prevalence), followed by melanoma of the skin (13%) and colorectal cancer (12%)
- among females, 5-year prevalence was highest for breast cancer (36% of total female 5-year prevalence), followed by colorectal cancer (13%) and melanoma of the skin (12%).
Deaths
In 2016 in Australia, it is estimated that:
- around 46,900 people will die from cancer, an average of 128 deaths every day. Males will account for more than half of all deaths from cancer (57%)
- lung cancer will be the leading cause of cancer death among males (5,120 deaths), followed by prostate cancer (3,400), colorectal cancer (2,140), pancreatic cancer (1,470), liver cancer (1,260) and melanoma of the skin (1,230)
- the most common cancers causing death in females will be lung cancer (3,720 deaths), breast cancer (3,050), colorectal cancer (1,950), cancer of unknown primary site (1,440) and pancreatic cancer (1,360).
From 1982 to 2016, it is estimated that the age-standardised mortality rate for all cancers combined will be 162 deaths per 100,000, a fall of 22% from 1982 (209 per 100,000).
What is missing from the picture?
There are no national registry data on the stage (severity) of cancer at diagnosis, treatments applied to individual cases of cancer, the frequency of recurrence of cancer after treatment, or the incidence of common non-melanoma skin cancers (BCC and SCC). The AIHW, Cancer Australia, and state and territory cancer registries are working together to assess the feasibility of collecting, collating and reporting national data on the stage of the disease when cancer is diagnosed, the treatments applied at each stage, and how frequently cancer recurs after treatment.
Where do I go for more information?
The reports, Cancer in Australia: an overview, 2014, Cancer incidence projections: Australia, 2011 to 2020, Cancer survival and prevalence in Australia: period estimates from 1982 to 2010, and Cancer mortality trends and projections: 2013 to 2025, are available for free download.
Reference
GLOBOCAN 2012. Estimated cancer Incidence, Mortality and Prevalence Worldwide in 2012. International Agency for Research on Cancer. Viewed 16 March 2016.
3.5 Coronary heart disease
Coronary heart disease (CHD) occurs when there is a blockage in the blood vessels that supply blood to the heart muscle. There are two major clinical forms: heart attack—an acute life-threatening event when the blood vessel supplying the heart itself is suddenly completely blocked, threatening to damage the heart muscle and its function, requiring prompt treatment, and angina—a chronic condition in which short episodes of chest pain can occur periodically when the heart has a temporary deficiency in its blood supply.
Older people with CHD are at increased risk of developing heart failure, which occurs when the heart functions less effectively in its role of pumping blood around the body.
CHD is very common, killing more people in Australia than any other disease. However, it is largely preventable, as many of its risk factors are modifiable, including tobacco smoking, high blood cholesterol, physical inactivity, poor nutrition and obesity (see 'Chapter 4 Determinants of health').
How common is coronary heart disease?
- In 2014–15, an estimated 643,000 Australian adults (3.6%) had been told by a doctor or nurse that they had CHD. Of these, 281,000 had experienced angina, 428,000 had previously had a heart attack, and 55,000 had other forms of CHD (a person may report more than one disease) (ABS 2015a, 2015b).
- Further, an estimated 108,000 adults had heart failure, which is a common outcome of diseases such as CHD that damage the heart.
- Rates of CHD were 1.7 times as high in men as women.
- CHD occurred more commonly in older age groups—it was 10 times as high in people aged 75 and over as in people aged 45–54 (17% and 1.7%, respectively) (ABS 2015a) (Figure 3.5.1).
- An estimated 65,300 people aged 25 and over experienced an acute coronary event in 2013 in the form of a heart attack or unstable angina—around 200 events every day, based on hospitalisations and mortality data. The age-standardised rate declined by 29% between 2007 and 2013, from 534 to 379 events per 100,000 population (see 'Chapter 7.1 Indicators of Australia's health').
Figure 3.5.1: Self-reported coronary heart disease, people aged 18 and over, by age and by sex, 2014–15
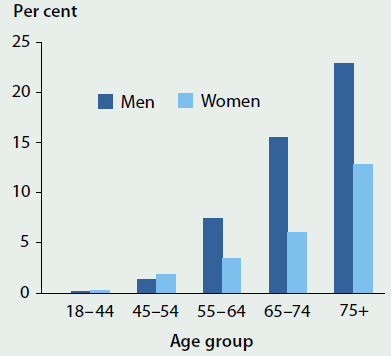
Note: Coronary heart disease is based on self-reported results only.
Source: ABS 2015a.
Hospitalisations
- In 2013–14, there were around 149,000 hospitalisations where CHD was the principal diagnosis (see Glossary) – of these, 36% were for acute myocardial infarction (54,100) and 34% for angina (50,700). CHD accounted for around 1.5% of all hospitalisations.
- Most admissions for acute myocardial infarction (80%) and angina (64%) were on an emergency basis.
- Of all CHD hospitalisations, 44% had a coronary angiography (a diagnostic procedure) and 22% underwent revascularisation (surgical procedures to restore blood supply).
- CHD was the leading cause of hospitalisations for cardiovascular disease (31% of all cardiovascular hospitalisations) across most age groups, except for those aged 85 and over. In this age group, hospitalisation rates for heart failure and cardiomyopathy were 30% higher than for CHD (4,400 and 3,400 per 100,000), reflecting the increasing burden and need for acute care for these diseases.
- CHD hospitalisation rates have declined by 30% over the last decade (from an age-standardised rate of 804 to 564 per 100,000 population between 2003–04 and 2013–14). The downward trend was similar for men (28%) and women (33%), although men were hospitalised at much higher rates than women (807 compared with 340 per 100,000 population in 2013–14).
Deaths
- In 2013, CHD was the leading single cause of death in Australia, accounting for 19,800 deaths as the underlying cause of death. This represents 13% of all deaths, and almost 1 in 2 cardiovascular deaths.
- Overall, the CHD death rate has fallen by 75% over the last three decades for both males and females, largely due to reductions in key risk factors—such as smoking, high cholesterol and high blood pressure—and to improvements in medical and surgical treatment. However, for some age groups (such as the age group 55–69), there has been a levelling-off of this mortality decline in the most recent decade (Figure 3.5.2).
- Where CHD is the underlying cause of death, common associated causes of death in 2011 include heart failure and cardiomyopathy (27%), hypertensive disease (21%) and diabetes (12%), highlighting the interrelated nature of these conditions with CHD.
Figure 3.5.2: Coronary heart disease death rates, people aged 55 and over, by selected age groups and by sex, 1983–2013
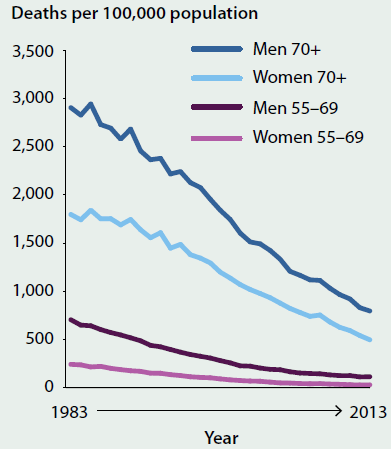
Source: AIHW National Mortality Database.
Variations among population groups
Compared with non-Indigenous Australians, Indigenous Australians were:

- 2 times as likely to have CHD
- 2.4 times as likely to be hospitalised for CHD
- 1.6 times as likely to die from CHD
- experiencing CHD at younger ages: in the 35–44 age group, 4.7 times as likely to report having CHD, and 7 times as likely to be hospitalised for CHD.
Compared with those living in Major cities, people in combined Remote and Very remote areas were:

- 1.6 times as likely to be hospitalised for CHD
- 1.3 times as times as likely to die from CHD.
Compared with those living in the highest socioeconomic areas, people living in the lowest socioeconomic areas were:

- 2.2 times as likely to have CHD
- 1.5 times as likely to be hospitalised for CHD
- 1.4 times as likely to die from CHD.
What is missing from the picture?
There are no reliable national and jurisdictional data on the number of new cases of CHD or heart failure each year. Proxy measures that combine hospital and mortality data are used to estimate new cases of acute coronary events in the form of a heart attack or unstable angina; however, these methods do not count the less-severe cases of CHD that do not result in hospitalisation.
Further information is required on primary health care and on the long-term outcomes of people treated for CHD. Currently there are limited national data on rates of readmissions, survival and case-fatality for people with CHD.
Where do I go for more information?
More information on coronary heart disease is available at AIHW website.
The following reports are available for free download on the AIHW website: The Cardiovascular disease, diabetes and chronic kidney disease—Australian facts series (Mortality; Prevalence and incidence; Morbidity—hospital care; Risk factors; Aboriginal and Torres Strait Islander people) and Trends in coronary heart disease mortality: age groups and populations.
References
ABS (Australian Bureau of Statistics) 2015a. National Health Survey: Australia, 2014–15, customised report. Canberra: ABS.
ABS 2015b. National Health Survey: first results, Australia, 2014–15. ABS cat. no. 4364.0.55.001. Canberra: ABS.
3.6 Stroke
Stroke occurs when an artery supplying blood to the brain either suddenly becomes blocked (known as ischaemic stroke) or ruptures and begins to bleed (known as haemorrhagic stroke). Either may result in part of the brain dying, leading to sudden impairment of a range of functions. Stroke often causes paralysis of parts of the body normally controlled by the area of the brain affected by the stroke, or speech problems and other symptoms, such as difficulties with swallowing, vision and thinking.
Stroke is largely preventable because many of its risk factors are modifiable, such as high blood pressure, physical inactivity, abdominal overweight and obesity and tobacco smoking (see 'Chapter 4 Determinants of health').
How common is stroke?
- In 2012, an estimated 377,000 people (2% of Australians—206,000 males and 171,000 females)—had had a stroke at some time in their lives, based on self-reported data. Most (71%) were aged 65 and over. While the overall prevalence of stroke has remained similar over the last 15 years at 1.5–2%, the proportion of people who had a disability resulting from stroke fell from 45% to 39% between 1998 and 2012.
- The rate of stroke events, based on hospital and mortality data, fell by 27% between 2000 and 2013 (from an age-standardised rate of 176 to 128 per 100,000 population). In 2013, there were an estimated 34,300 stroke events—almost 100 every day.
Health care
- In 2013–14, there were 37,000 hospitalisations for acute care of stroke and 28,000 hospitalisations for rehabilitation care for stroke. The average length of stay in acute hospital care was 8 days, and in rehabilitation care, 14 days.
- Stroke hospitalisation rates were more common among males than females (1.3 times as high) and most occurred among those aged 75 and over (Figure 3.6.1).
- Between 2003–04 and 2013–14, stroke hospitalisation rates fell by 15% (from an age-standardised rate of 163 to 138 per 100,000 population).
- Dedicated stroke units in hospitals significantly improve the health outcomes of patients. Two-thirds (67%) of patients accessed stroke units in 2015. The number of beds for patients with acute stroke increased from 429 to 648 between 2007 and 2015 (National Stroke Foundation 2015).
- Informal carers, such as family members, play an important role in the care of stroke survivors. In 2012, there were around 70,400 stroke-affected recipients of care whose primary carer lived in the same household.
Deaths
- In 2013, there were 8,100 deaths with stroke recorded as the underlying cause, accounting for 5% of all deaths in Australia.
- Stroke death rates were similar among males and females (with age-standardised rates of 27 and 29 deaths per 100,000 population, respectively); however, more females (4,900) than males (3,200) died, largely reflecting the higher proportion of older women.
- Over the last three decades, stroke death rates have fallen by 70% for males (from 90 to 27 per 100,000 population) and 65% for females (from 84 to 29 per 100,000 population) (Figure 3.6.2). These declines have been driven by improvements in key risk factors for stroke (in particular, high blood pressure and smoking); progress in medical treatment and other advances in medical care; and increasing access to dedicated stroke units in hospitals and the high level of care received there.
- Stroke is commonly associated with other diseases, in particular other cardiovascular diseases. In 2013, where cerebrovascular disease (predominantly stroke) was listed as the underlying cause of death, common associated causes of death included hypertensive diseases (29%), dementia and Alzheimer disease (19%) and coronary heart disease (11%).
Figure 3.6.1: Hospitalisations with a principal diagnosis of stroke, by age and sex, 2013–14
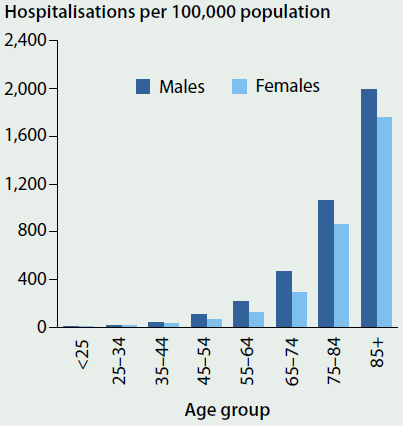
Source: AIHW National Hospital Morbidity Database.
Figure 3.6.2: Stroke death rates, by sex, 1983 to 2013
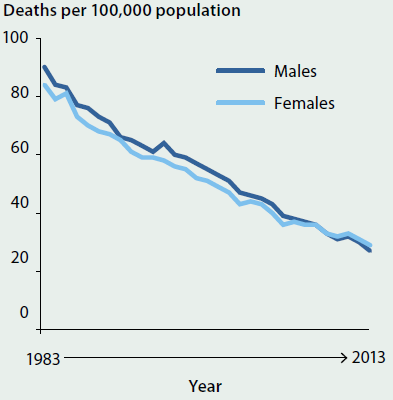
Note: Rates have been age-standardised to the 2001 Australian population.
Source: AIHW National Mortality Database.
Variations among population groups
- The burden of stroke is greater among Aboriginal and Torres Strait Islander people— hospitalisation and mortality rates for stroke for Indigenous Australians were 2 and 1.4 times as high as for non-Indigenous Australians, respectively.
- People living in the lowest socioeconomic areas also had higher rates of stroke—the prevalence of self-reported stroke was over twice as high and death rates were 1.4 times as high as for people living in the highest socioeconomic areas.
What is missing from the picture?
Currently, there is no comprehensive national monitoring of new cases of stroke. Increased collection and more frequent reporting of data would help inform planning and policy and provide an improved picture of the quality of stroke care in Australian hospitals.
Where do I go for more information?
The following reports can be downloaded for free: the Cardiovascular disease, diabetes and chronic kidney disease—Australian facts series (Mortality; Prevalence and incidence; Morbidity—hospital care; Risk factors; Aboriginal and Torres Strait Islander people) and Stroke and its management in Australia: an update.
Reference
National Stroke Foundation 2015. National Stroke Audit—Acute Services Report 2015. Melbourne: National Stroke Foundation.
3.7 Diabetes
Diabetes is a chronic condition marked by high levels of glucose in the blood. It is caused either by the inability to produce insulin (a hormone made by the pancreas to control blood glucose levels), or by the body not being able to use insulin effectively, or both.
The main types of diabetes are type 1 diabetes, type 2 diabetes and gestational diabetes. Type 1 diabetes is a lifelong autoimmune disease that usually has onset in childhood and is believed to be caused by an interaction of genetic and environmental factors (see 'Chapter 5.3 How healthy are Australia's children?'). Type 2 diabetes, while involving a genetic component, is largely preventable by maintaining a healthy lifestyle. Modifiable risk factors that can lead to type 2 diabetes include insufficient physical activity, saturated fat intake, obesity, and tobacco smoking (see 'Chapter 4 Determinants of health'). Gestational diabetes occurs when higher than normal blood glucose is diagnosed in pregnancy.
Diabetes may result in a range of health complications, including heart disease, kidney disease, blindness and lower limb amputation. It is frequently associated with other chronic health conditions (comorbidities, see Glossary) such as cardiovascular disease and chronic kidney disease.
How common is diabetes?
- According to the ABS 2014–15 National Health Survey, an estimated 1.2 million (5.1%) people had diabetes, based on self-reported data (ABS 2015). The majority of these (85%) had type 2 diabetes and 15% had type 1 diabetes. However, information based on self-reported data only is likely to underestimate the prevalence of diabetes as it cannot include people with undiagnosed diabetes. The 2011–12 Australian Health Survey, which included both measured and self-report data, showed that for every 4 adults with diagnosed diabetes, there was 1 who was undiagnosed (ABS 2013).
- In 2014–15, diabetes was more common in males (6%) than females (4%). It increased rapidly with age, to about 16% for those aged 65–74, based on self-reported data.
- In 2011–12, around 68% of people who had diabetes (based on measured and self-reported data) also had cardiovascular disease and/or chronic kidney disease.
Insulin-treated diabetes
Insulin replacement therapy is essential for all people with type 1 diabetes, as this condition is characterised by the destruction of insulin-producing cells. However, for people with type 2 diabetes and gestational diabetes, not enough insulin is produced or it is not used effectively. Around 20% of people with type 2 diabetes and 25–40% of people with gestational diabetes use insulin. In other cases, these conditions can be managed through lifestyle modifications and/or other medications.
According to the National (insulin-treated) Diabetes Register, in 2014:
- around 29,400, or 1 in 800 people, began using insulin. The majority of these (19,400 people) began to use insulin for the treatment of type 2 diabetes
- almost all (93%) new cases of insulin use for type 2 diabetes occurred in those aged 40 and over, reflecting the higher prevalence of type 2 diabetes with advancing age (Figure 3.7.1)
- there were more than 2,500 new cases of type 1 diabetes, with almost two-thirds (63%) of these diagnosed in people under the age of 25 (Figure 3.7.1)
- about 6,600 women started using insulin to treat gestational diabetes, which occurs in around 6% of pregnancies.
Figure 3.7.1: New cases of type 1 diabetes and insulin-use among people with type 2 diabetes, by age, 2014
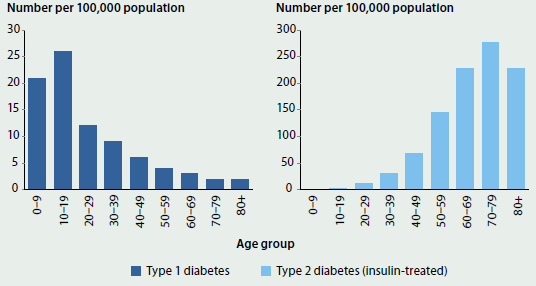
Source: AIHW National (insulin-treated) Diabetes Register.
Hospitalisations
- Diabetes contributed to around 929,000 hospitalisations in 2013–14 (9% of all hospitalisations), with the majority (95%) of the hospitalisations listing diabetes as an additional diagnosis.
- In 2013–14, 32% of hospitalisations for diabetes also had a diagnosis of cardiovascular disease, 19% had a diagnosis of chronic kidney disease, and 14% had both.
Deaths
- In 2013, diabetes contributed to 10% of all deaths in Australia (15,100), with the majority of these (71%) recording diabetes as an associated cause of death.
- Diabetes death rates have remained relatively stable between 1997 and 2013, with age-standardised rates of 53 to 62 deaths per 100,000 population each year.
- In 2013, diabetes death rates were higher for males than females (1.6 times as high for males) and most (88%) deaths occurred among those aged 65 and over.
- In 2013, where diabetes was an associated cause of death, coronary heart disease was listed as the underlying cause of death in 23% of deaths, and stroke in 6%.
Variations among population groups
Compared with non-Indigenous Australians, Indigenous Australians were:

- 3.5 times as likely as non-Indigenous Australians to have diabetes
- 4.0 times as likely as Other Australians to be hospitalised for diabetes
- 4.0 times as likely as non-Indigenous Australians to die from diabetes.
Compared with those living in Major cities, people in combined Remote and Very remote areas were:

- 1.8 times as likely to be hospitalised for diabetes
- 1.9 times as likely to die from diabetes.
Compared with those living in the highest socioeconomic areas, people living in the lowest socioeconomic areas were:

- 3.6 times as likely to have diabetes
- 1.8 times as likely to be hospitalised for diabetes
- 2.0 times as likely to die from diabetes.
What is missing from the picture?
Further monitoring and surveillance of diabetes is crucial for guiding preventive measures, determining clinical care and informing health policy and service planning.
Currently, there are no national data on new cases of diagnosed type 2 diabetes, especially for young people. Symptoms of type 2 diabetes are often absent in the early stages and so people may go undiagnosed for a long time. Also, there can be problems with misdiagnosis, particularly among young people with type 2 diabetes, and misreporting of diabetes type.
Where do I go for more information?
The following reports are available for free download: Incidence of insulin-treated diabetes in Australia 2014 and the Cardiovascular disease, diabetes and chronic kidney disease—Australian facts series (Mortality; Prevalence and incidence; Morbidity—hospital care; Risk factors; Aboriginal and Torres Strait Islander people).
References
ABS (Australian Bureau of Statistics) 2013. Australian Health Survey: biomedical results for chronic diseases, 2011–12. ABS cat. no. 4364.0.55.005. Canberra: ABS.
ABS 2015. National Health Survey: first results, Australia, 2014–15. ABS cat. no. 4364.0.55.001. Canberra: ABS.
3.8 Kidney disease
The kidneys filter and remove waste from the blood. Kidney disease occurs when the nephrons (functional units inside the kidney that filter the blood) are damaged. Kidney disease is often called a 'silent disease, as up to 90% of kidney function can be lost before symptoms appear. As a result, many people are unaware that they have the condition.
When a person has evidence of kidney damage and/or reduced kidney function lasting at least 3 months, this is referred to as chronic kidney disease, or CKD. The most severe form of CKD is end-stage kidney disease (ESKD), where people usually require kidney replacement therapy—a kidney transplant or dialysis—to survive. Kidney disease may also present as an acute condition, such as acute kidney injury (AKI), where an abrupt loss of kidney function causes the body to accumulate waste products and become unable to maintain electrolyte, acid-base and water balance.
CKD is largely preventable, as many of its risk factors—such as smoking, high blood pressure, overweight and obesity, and impaired glucose regulation—are modifiable. Further, simple tests of a person's blood and urine can identify most cases of CKD when the disease is in its early stages, enabling treatment to prevent, or slow down, its progression. In contrast, AKI is often the consequence of injury or trauma restricting blood supply to the tissues or as a result of severe inflammation.
CKD and AKI are risk factors for each other and they are both risk factors for cardiovascular disease.
How common is chronic kidney disease?
- In 2011–12, an estimated 1 in 10 people (1.7 million Australians) aged 18 and over had biomedical signs of CKD (ABS 2013). Of these, only 10% were aware they had the condition based on self-reported data, reflecting that this is a highly under-diagnosed condition.
- In 2014, there were around 22,100 people with treated ESKD—55% of patients were on dialysis while 45% were living with a functioning transplant.
- There were around 2,600 new cases of treated ESKD in 2014—7 new treated cases per day.
- Diabetic nephropathy—damage to the blood-filtering capillaries in the kidneys caused by high blood sugar levels—was the leading cause of treated ESKD, accounting for 37% of new cases in 2014 (ANZDATA 2015).
Hospitalisations
- Of the 1.6 million hospitalisations for CKD in 2013–14, 81% were for regular dialysis treatment. Dialysis is the most common reason for hospitalisation in Australia, and age-standardised rates have increased by 37% over the last decade, from 3,800 to 5,200 per 100,000 population, between 2003–04 and 2013–14.
- In 2013–14, there were more than 300,000 hospitalisations for CKD (excluding dialysis). The vast majority of these (87%) were for CKD as an additional diagnosis. Age-standardised rates have increased substantially between 2003–04 and 2013–14, from 128 to 164 per 100,000 population.
- CKD often occurs with other conditions such as cardiovascular disease and diabetes, as they share common risk factors. Of hospitalisations with CKD in 2012–13, 66% also had a diagnosis of cardiovascular disease, 57% a diagnosis of diabetes, and 41% had both.
- The proportion of CKD hospitalisations with either cardiovascular disease or diabetes or both increased with age—from 40% of people aged 25–34 to 88% of people aged 75–84 (Figure 3.8.1).
- In 2013–14, there were around 146,600 hospitalisations where AKI was the principal and/or additional diagnosis. The number and rates of hospitalisations for AKI almost doubled between 2003–04 and 2013–14.
Figure 3.8.1: CKD hospitalisations with one or more diagnoses of cardiovascular disease, diabetes and CKD, by age, 2012–13
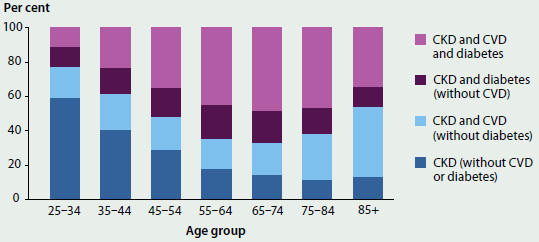
Note: Hospitalisations were for adults aged 25 and over only.
Source: AIHW National Hospital Morbidity Database.
Deaths
- In 2013, CKD contributed to 15,900 (11%) of all deaths in Australia, with 76% of these recorded as an associated cause of death. CKD was commonly listed as an associated cause of death where the underlying cause was coronary heart disease (23%), heart failure and cardiomyopathy (7%), and dementia and Alzheimer disease (6%).
- There were around 5,300 deaths where AKI was recorded as the underlying or associated cause of death in 2013. As for CKD, there is also a strong association between AKI and cardiovascular disease—cardiovascular disease was the leading cause of death in 28% of deaths where AKI was an associated cause of death.
Variations among population groups
Compared with non-Indigenous Australians, Indigenous Australians were:

- 2.1 times as likely to have biomedical signs of CKD
- 4.8 times as likely to hospitalised for CKD (excluding dialysis)
- 3.2 times as likely to die from CKD
- 5.0 times as likely to have ESKD, but less likely to be treated with a functioning kidney transplant for their ESKD (12% compared with 48% for non-Indigenous people).
Compared with those living in Major cities, people in combined Remote and Very remote areas were:

- 2.2 times as likely to be hospitalised for CKD
- 1.7 times as times as likely to die from CKD.
Compared with those living in the highest socioeconomic areas, people living in the lowest socioeconomic areas were:

- 1.6 times as likely to have biomedical signs of CKD
- 1.9 times as likely to be hospitalised for CKD
- 1.6 times as likely to die from CKD.
What is missing from the picture?
Although nearly all people with ESKD in Australia who receive kidney replacement therapy are recorded in the Australian and New Zealand Dialysis and Transplant Registry (ANZDATA), there is a lack of information on people with ESKD who are not receiving kidney replacement therapy. Data linkage of ANZDATA and mortality data has provided some information on people not receiving kidney replacement therapy (AIHW 2011). Further linkage with hospitalisation data would allow a greater capture of untreated ESKD and provide improved estimates on the incidence of ESKD in Australia: however, national linkage is currently not possible.
There is also a lack of reliable national data on the prevalence and incidence of AKI in Australia. Hospital and deaths data may underestimate the burden of AKI given that standardised definitions of AKI have only appeared in the last decade, that it is clinically under-recognised and that its definition is still evolving.
Where do I go for more information?
The following reports can be downloaded for free: the Cardiovascular disease, diabetes and chronic kidney disease—Australian facts series (Mortality; Prevalence and incidence; Morbidity—hospital care; Risk factors; Indigenous Australians), Acute kidney injury in Australia: a first national snapshot and Chronic kidney disease: regional variation in Australia.
References
ABS (Australian Bureau of Statistics) 2013. Australian Health Survey: biomedical results for chronic diseases, 2011–12. ABS cat. no. 4364.0.55.005. Canberra: ABS.
AIHW 2011. End-stage kidney disease in Australia: total incidence, 2003–2007. Cat. no. PHE 143. Canberra: AIHW.
ANZDATA (Australian and New Zealand Dialysis and Transplant) 2015. ANZDATA 38th Annual report 2015. Adelaide: Australia and New Zealand Dialysis and Transplant Registry.
3.9 Arthritis and other musculoskeletal conditions
Arthritis and other musculoskeletal conditions are a group of conditions affecting the bones, muscles and joints. These conditions include osteoarthritis, rheumatoid arthritis, juvenile arthritis, back pain and problems and osteoporosis or osteopenia (low bone density) (see Glossary).
How common are arthritis and other musculoskeletal conditions?
Arthritis and other musculoskeletal conditions affect many Australians. Based on the self-reported data from the Australian Bureau of Statistics (ABS) 2014–15 National Health Survey (NHS) (ABS 2015):
- 30% of Australians had arthritis and other musculoskeletal conditions—around 6.9 million people
- 16% of Australians (3.7 million) had back pain and problems, 9.0% had osteoarthritis (2 million), 3.5% osteoporosis (801,000) and 1.8% rheumatoid arthritis (406,000)
- 6,500 (1 in 800) children aged 0–17 had juvenile arthritis—it was as common as type 1 diabetes for the same age group
- twice as many women as men had osteoarthritis or rheumatoid arthritis
- for people aged 55 and over, 5 times as many women as men had osteoporosis or osteopenia.
Comorbidity
People with arthritis and other musculoskeletal conditions often have other chronic diseases and long-term conditions. This is referred to as 'comorbidity, where two or more health problems occur at the same time. Almost 1 in 4 Australians (23%) have comorbid chronic conditions. For more information, see 'Chapter 3.3 Chronic disease and comorbidities'.
For people with arthritis, based on self-reported data in the ABS 2014–15 NHS (ABS 2015):
- more than 3 out of 4 (79%) had at least one other chronic condition
- cardiovascular disease was the most common comorbidity (48%), followed by back pain and problems (33%) and mental health problems (27%).
For people with back pain and problems (also based on self-report NHS data):
- almost 2 out of 3 (65%) had at least one other chronic condition
- arthritis and cardiovascular disease were the most common comorbidities (31%), followed by mental health problems (30%).
Impact
Arthritis and other musculoskeletal conditions are large contributors to illness, pain and disability. For more information on the burden of disease associated with these conditions, see 'Chapter 3.1 Burden of disease and injury in Australia'.
In 2014–15, compared with the general population, people with musculoskeletal conditions had higher rates of poor health, very high psychological distress and very severe pain. For example, people with back pains and problems were 3.2 times as likely as the general population to experience poor health. Other examples of higher rates were:
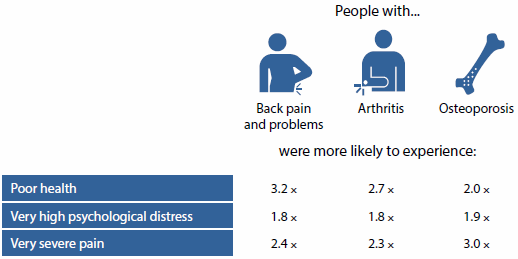
Health care
These conditions are predominantly managed in primary health care settings by a range of health professionals. Treatment involves a combination of medication (for pain and inflammation): physiotherapy: self-management (such as diet and exercise): education on self-management and living with the condition: and referral to specialist care.
- Based on survey data, at least one musculoskeletal condition was managed at an estimated 24 million general practice visits (representing 18% of visits and 12% of problems managed) in 2014–15 (Britt et al. 2015).
- Between 2004–05 and 2013–14, age-standardised rates of musculoskeletal hospitalisations increased, by 131% for juvenile arthritis, 54% for rheumatoid arthritis, 20% for osteoporosis-related minimal trauma fractures in people aged 50 and over, and 15% for osteoarthritis.
- Biologic disease-modifying anti-rheumatic drugs (bDMARDs) are specialised medications commonly used to treat rheumatoid arthritis and juvenile arthritis. These drugs are unique to the type of arthritis being treated and can only be obtained from a rheumatologist and administered in hospital. In 2013–14, the Pharmaceutical Benefits Scheme paid $7.5 million in benefits for bDMARDs for juvenile arthritis and $281 million for rheumatoid arthritis. BDMARDs have been shown to result in improved quality of life and reduced use of other health care services (Nam et al. 2014).
What is missing from the picture?
The prevention, management and treatment of these conditions beyond hospital settings cannot be examined in detail because of a lack of information about primary health care.
There is limited information on the use of vitamins, nutritional supplements and over-the-counter pharmaceuticals such as paracetamol, which are commonly used to manage musculoskeletal conditions. Prescription pharmaceutical data are limited because these data lack information about the diagnoses for which the medications were prescribed.
Information is also lacking on the overall costs of these conditions to individuals (for example out-of-pocket expenditure and lost earning potential).
Where do I go for more information?
More information on arthritis and other musculoskeletal conditions is available at AIHW website.
References
ABS (Australian Bureau of Statistics) 2015. National Health Survey: first results, 2014–15. ABS cat. no. 4364.0.55.001. Canberra: ABS.
Britt H, Miller GC, Henderson J, Bayram C, Harrison C, Valenti L et al. 2015. General practice activity in Australia 2014–15. General practice series no. 38. Sydney: Sydney University Press.
Nam JL, Ramiro S, Gaujoux-Viala C, Takase K, Leon-Garcia M, Emery P et al. 2014. Efficacy of biological disease-modifying antirheumatic drugs: a systematic literature review informing the 2013 update of the EULAR recommendations for the management of rheumatoid arthritis. Annals of the Rheumatic Diseases 73(3):516-28.
3.10 Chronic respiratory conditions
Chronic respiratory conditions affect people's airways and are characterised by symptoms such as wheezing, shortness of breath, chest tightness and cough. Conditions include asthma, chronic obstructive pulmonary disease (COPD) – which includes emphysema and chronic bronchitis – and a range of other conditions, such as allergic rhinitis ('hay fever'), chronic sinusitis, cystic fibrosis, bronchiectasis, occupational lung diseases and sleep apnoea (see Glossary).
There are a range of behavioural, environmental and genetic risk factors that are associated with chronic respiratory conditions, including smoking, exposure to viral infections and air pollutants, and inheritance of genes associated with respiratory illnesses, such as cystic fibrosis.
How common are chronic respiratory conditions?
Based on the self-reported data from the Australian Bureau of Statistics (ABS) 2014–15 National Health Survey (NHS) (ABS 2015):
- more than 3 in 10 Australians (31% or 7 million people) had one or more chronic respiratory conditions
- hay fever and asthma were the two most common conditions, affecting 4.5 million Australians (19% of the population) and 2.5 million Australians (11% of the population), respectively. COPD was comparatively rarer, affecting an estimated 600,000 Australians (2.6%)
- asthma was one of the most common chronic health conditions among children, affecting 479,000 children aged 0–14 (11%)
- almost two-thirds (65% or 388,000) of the 600,000 Australians with COPD were aged 55 and over
- both asthma and COPD were more common in people living in low socioeconomic areas than in people living in high socioeconomic areas (13% compared with 10% for asthma, and 4.1% compared with 1.5% for COPD).
Between 2001 and 2014–15 there was a fall in the age-standardised prevalence of self-reported asthma (from 12% to 11%) and of COPD (from 3.6% to 2.4%).
Deaths
COPD was the fifth leading underlying cause of death in Australia in 2013 (4.4% of all deaths).
In 2013:
- there were around 6,500 deaths due to COPD, about 400 deaths due to asthma and nearly 300 deaths due to bronchiectasis
- 95% (6,200) of deaths due to COPD were among people aged 55 and over.
Between 2001 and 2013, among those aged 55 and over, the age-standardised death rate for COPD fluctuated, ranging from 97 to 127 deaths per 100,000 population (Figure 3.10.1). The rate for males fell from 183 to 137 deaths per 100,000 males, while the rate for females had no clear trend, ranging from 74 to 89 deaths per 100,000 females.
Between 2001 and 2013, among those of all ages, the age-standardised death rates for asthma and bronchiectasis remained relatively steady at fewer than 2.2 deaths per 100,000 population.
Figure 3.10.1: Age-standardised death rates (2001 to 2013) and hospitalisations (2001–02 to 2013–14) for asthma (all ages), bronchiectasis (all ages) and COPD (ages 55 and over)
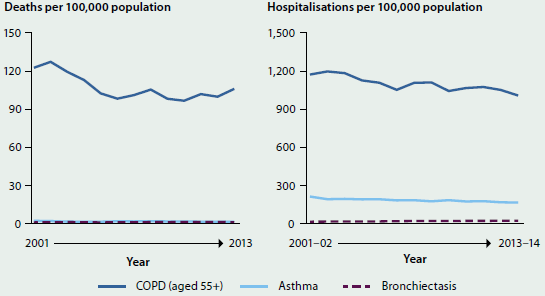
Notes
- Rates have been age-standardised to the 2001 Australian population.
- Deaths registered in 2011 and earlier are based on the final version of cause of death data; deaths registered in 2012 and 2013 are based on revised and preliminary versions, respectively and are subject to further revision by the ABS.
- Data for COPD are for those aged 55 and over.
Sources: AIHW National Mortality Database and AIHW National Hospitals Morbidity Database.
Health care
- Chronic respiratory conditions are predominantly managed in primary health care. In 2011–12, more than half (57%) of people with asthma visited a general practitioner (GP) for asthma at least once in the previous year (ABS 2013). People aged 0–14 were most likely to have visited a GP at least once for their asthma (73%).
- Asthma guidelines recommend that all people with asthma should have a written asthma action plan. However, in 2011–12, based on self-reported survey data, only 24% of people with asthma as a long-term condition had a written asthma action plan (ABS 2013). See also 'Chapter 7.1 Indicators of Australia's health'.
- Between 2001–02 and 2013–14 there was a fall in the age-standardised hospitalisation rates for asthma (down 22% from 212 to 165 hospitalisations per 100,000 population of all ages) and for COPD (down 14% from 1,172 to 1,007 hospitalisations per 100,000 population aged 55 and over) (Figure 3.10.1).
What is missing from the picture?
The prevention, management and treatment of chronic respiratory conditions beyond hospital settings, including the appropriateness of care relating to clinical guidelines, cannot be examined in detail because of a lack of data on primary health care. Future linkage work may provide insight into these issues.
Where do I go for more information?
More information on chronic respiratory conditions in Australia. The reports Asthma in Australia 2011; Mortality from asthma and COPD in Australia; Respiratory medication use in Australia 2003–2013: treatment of asthma and COPD and other recent publications can be downloaded for free.
References
ABS (Australian Bureau of Statistics) 2013. Australian Health Survey: health service usage and health related actions, 2011–12. ABS cat. no. 4364.0.55.002. Canberra: ABS.
ABS 2015. National Health Survey: first results 2014–15, ABS cat. no. 4364.0.55.001.
3.11 Mental health
Mental health is a state of wellbeing in which an individual realises his or her own potential, can cope with the normal stresses of life, can work productively and fruitfully, and is able to make a contribution to her or his community (WHO 2014). While most Australians enjoy good mental health, a significant proportion of the population will experience mental illness at some time throughout their lives. This will affect how they think, behave and interact with those around them.
Australia's National Survey of Mental Health and Wellbeing is a program of three targeted mental health epidemiological surveys. Together, these surveys provide a detailed view of the prevalence of mental health issues in Australia:
- National Survey of Mental Health and Wellbeing (conducted most recently in 2007). Around 7.3 million (45%) of Australians aged 16–85 will experience a high prevalence mental disorder, such as depression, anxiety or a substance use disorder in their lifetime (ABS 2008). The age distribution of high prevalence mental disorders in 2007 was similar to that found 10 years earlier from the same survey conducted over 1997 or 1998 (depending on age group) (see Figure 3.11.1.)
- National Survey of People with Psychotic Illness (conducted most recently in 2010). Almost 64,000 people with a psychotic illness are in contact with public specialised mental health services each year (Morgan et al. 2011). The survey did not cover private service providers such as private psychiatrists, psychologists and private hospitals.
- Australian Child and Adolescent Survey of Mental Health and Wellbeing, also known as Young Minds Matter (conducted most recently in 2012–13). Analysis from the survey estimates that 560,000 children and adolescents aged 4–17 (almost 14%) experienced mental health disorders in 2012–13 (Lawrence et al. 2015) (see 'Chapter 5.5 Mental health of Australia's young people and adolescents').
While the National Survey of Mental Health and Wellbeing provides valuable insights, the severity of a mental illness is a critical factor in understanding the impact of mental illness, both on an individual and on society as a whole. While severe and persistent mental illness, such as psychosis, has a relatively low prevalence, it contributes substantially to the impact of mental illness on society, due to the ongoing and sometimes extensive care needs required to support the individual.
A person experiencing poor mental health may not meet the diagnostic criteria for a mental disorder (Slade et al. 2009), but may still experience a negative impact on their life. Poor mental health may also be associated with suicidality—the collective term for suicidal ideation, suicide plans and suicide attempts. While suicidality is more common in people with mental disorders, it is not confined solely to this group (Slade et al. 2009).
People who experience suicidal ideation and make suicide plans are at increased risk of attempting suicide (see Glossary). At some point in their lives, 13% of Australians aged 16–85 have experienced suicidal ideation, 4.0% have made suicide plans and 3.3% have attempted suicide (Slade et al. 2009). From 2004 to 2013, an average of 2,300 Australians died by suicide each year (ABS 2015).
Figure 3.11.1: Proportion of Australians with high prevalence mental disorders, by age, 1997 and 2007
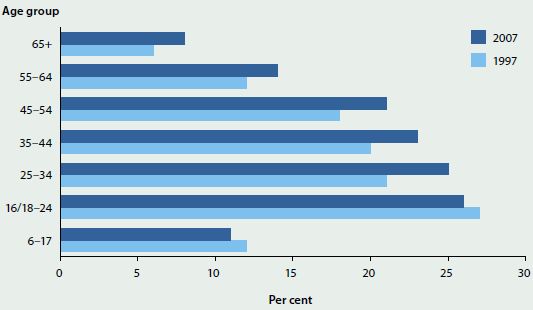
Notes
- For the 6–17 age group, the data are for 1998 and 2013–14.
- For the 16/18–24 age group, the 1997 data relate to people aged 18–24 and the 2007 data to people aged 16–24.
- Prevalence data from the National Survey of People with Psychotic Illness are not included in this figure.
- Some caution should be exercised in comparing findings from the two adult surveys because they sampled from slightly different age ranges and used somewhat different approaches to gauge the presence of mental illness in the past 12 months. It may be the case that these methodological differences account for the small increase in overall prevalence over time.
Sources: DoHA 2013; Lawrence et al. 2015.
What is missing from the picture?
The Australian Child and Adolescent Survey of Mental Health and Wellbeing, conducted in 2013–14, filled the gap in contemporary information about the extent and impact of mental illness on children and adolescents.
Given the passage of time since the last adult survey of mental health was conducted, consideration of cost-effective methods to update prevalence information about Australian adults is indicated.
Where do I go for more information?
More information on mental health in Australia is available on the Mental Health Services in Australia website and in the Suicide and hospitalised self-harm in Australia: trend and analysis report.
Services available for people at risk of suicide
Lifeline 13 11 14
Kids Help Line 1800 55 1800
Suicide Call Back Service 1300 659 467
References
ABS (Australian Bureau of Statistics) 2008. National Survey of Mental Health and Wellbeing 2007: summary of results. ABS cat. no. 4326.0. Canberra: ABS.
ABS 2015. Causes of death, Australia, 2013. ABS cat. no. 3303.0. Canberra: ABS.
AIHW (Australian Institute of Health and Welfare) 2014. Suicide and hospitalised self-harm in Australia: trends and analysis. Injury research and statistics series no. 93. Cat. no. INJCAT 169. Canberra: AIHW.
DoHA (Department of Health and Ageing) 2013. National Mental Health Report 2013: tracking progress of mental health reform in Australia 1993–2011. Canberra: DoHA.
Lawrence D, Johnson S, Hafekost J, Boterhoven de Haan K, Sawyer M, Ainley J et al. 2015. The mental health of children and adolescents: report on the second Australian Child and Adolescent Survey of Mental Health and Wellbeing. Canberra: Department of Health.
Morgan VA, Waterreus A, Jablensky A, Mackinnon A, McGrath JJ, Carr, V et al. 2011. People living with psychotic illness 2010: report of the second Australian national survey. Canberra: Department of Health and Ageing.
Slade T, Johnston A, Teesson M, Whiteford H, Burgess P Pirkis J et al. 2009. The mental health of Australians 2: report on the 2007 National Survey of Mental Health and Wellbeing. Canberra: Department of Health and Ageing.
WHO (World Health Organization) 2014. Mental health: a state of well-being. Geneva: WHO. Viewed August 2014.
3.12 Dementia
Dementia is not the name of a specific disease; rather, it describes a syndrome characterised by the gradual impairment of brain function. Skills commonly affected include memory, cognition and personality. While dementia is irreversible and progressive, it is not an inevitable part of ageing. There is no simple test to diagnose it, and more than 100 diseases are associated with the condition—the most common types are Alzheimer disease and vascular dementia. Alzheimer disease accounts for up to 80% of cases, although only half of these are estimated to be 'pure' Alzheimer disease (AA 2015).
How many people have dementia?
Dementia presents a significant challenge to health and aged care in Australia, and affects almost 1 in 10 (8.8%) people aged 65 and over. Based on rates derived from published international and local studies and on Australian population projections, there are an estimated 354,000 people with dementia in Australia in 2016. The prevalence of dementia has increased—it affected approximately 252,000 people in 2006, which represents an increase of 40% to 2016. Just over 1% of people with dementia are estimated to be under 60, while people aged 85 and over account for 43% of cases. While dementia is not caused by age, it does primarily affect older people (Figure 3.12.1).
Figure 3.12.1: Estimated proportion of people with dementia, by age group and sex, 2016
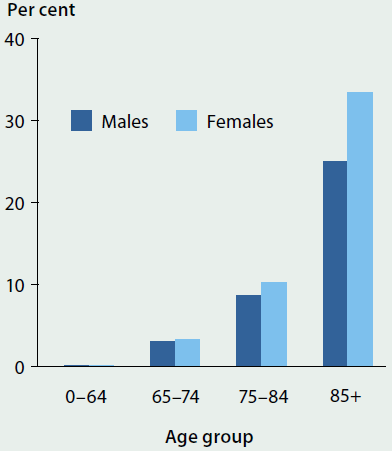
Some studies have indicated that age-specific risk rates for dementia may be decreasing, and the age of onset increasing, in line with changes to particular risk factors such as improved cardiovascular health (AA 2015, ADI 2014). A number of factors are associated with the development of dementia—for instance, a robust evidence base suggests that higher levels of education in early life reduce the risk of dementia, while higher levels of high blood pressure in mid-life and diabetes in late life increase it (ADI 2014).
However, dementia's impact on society continues to increase as the absolute number of cases increases because the number of older people as a proportion of the population is increasing. Dementia was the second leading cause of death in Australia in 2013, accounting for almost 11,000 deaths (7.4% of all deaths). For deaths associated with dementia, the median age at death was 88.
People with dementia rely heavily on health and aged care services
Dementia is one of the leading contributors to burden of disease and disability, and people with dementia are frequent users of health and aged care services. Because of the degenerative nature of the condition, an individual's need for assistance generally increases as the disease progresses. (For more information on the burden of disease, see 'Chapter 3.1 Burden of disease and injury in Australia'.)
People with dementia experience more hospitalisations than people without dementia, although dementia is generally not the primary reason for admission. For instance, people with dementia account for 29% of people admitted to hospital with hip fractures (Scandol et al. 2013); are hospitalised for unintentional poisoning at twice the rate of people without dementia (Mitchell et al. 2015); and, once hospitalised, are more than twice as likely to develop complications such as pneumonia than people without dementia (Bail et al. 2015).
In June 2015, more than half of all people in permanent residential aged care (52%, or almost 90,000 people) had a diagnosis of dementia and were more likely to require a high level of care than people without dementia (95% compared with 83%).
People with dementia living in the community also depend on informal care provided by family and friends.
Informal carers of people with dementia:
- are often female—74%
- are more likely to be 65 or older—65%
- are commonly the person's spouse or partner—65%
- usually provide 40 or more hours of care per week—65%
- have often been a carer for less than 5 years—60%
- often have a disability themselves—46%.
Some treatments are available for people with dementia, particularly Alzheimer disease. In 2012–13, more than 48,000 people were prescribed an anti-dementia medication subsidised under the Pharmaceutical Benefits Scheme. These drug treatments provide symptomatic relief and can help to delay the progress of the disease for a time. In addition, some behavioural and psychological symptoms associated with dementia, such as agitation and depression, can be treated with drugs or by using non-pharmacological therapies.
What is missing from the picture?
Australia lacks national data that can provide reliable prevalence estimates of dementia. As a result, very little comprehensive information is also available on the prevalence of dementia among specific populations, such as Aboriginal and Torres Strait Islander Australians. A number of studies have indicated that Indigenous people across urban, regional, and remote Australia have higher rates of dementia, and earlier age of onset, than comparable populations of non-Indigenous people (Li et al. 2014; Radford et al. 2015).
The underlying mechanisms relating to the progress of dementia—and the various factors that influence it—are not yet fully understood. Further research is needed, using a range of appropriate methodologies.
Where do I go for more information?
For more information and a list of AIHW publications on dementia in Australia, see Dementia. The Alzheimer's Australia website offer information, services and support for people with dementia and their carers.
References
AA (Alzheimer's Association) 2015. Alzheimer's disease facts and figures. Alzheimer's & Dementia 11(3):332–84.
ADI (Alzheimer's Disease International) 2014. World Alzheimer report 2014. Dementia and risk reduction: an analysis of protective and modifiable factors. London: ADI.
Bail K, Goss J, Draper B, Berry H, Karmel R & Gibson D 2015. The cost of hospital-acquired complications for older people with and without dementia; a retrospective cohort study. BMC Health Services Research 15:91.
Li SQ, Guthridge SL, Eswara Aratchige P, Lowe MP, Wang Z, Zhao Y et al. V 2014. Dementia prevalence and incidence amongst the Indigenous and non-Indigenous populations of the Northern Territory. Medical Journal of Australia 200(8):465–9.
Mitchell RJ, Harvey LA, Brodaty H, Draper B & Close JC 2015. Dementia and intentional and unintentional poisoning in older people: A 10 year review of hospitalization records in New South Wales, Australia. International Psychogeriatrics 27(11):1757–68.
Radford K, Mack HA, Draper B, Chalkley S, Daylight G, Cumming RG et al. 2015. Prevalence of dementia in urban and regional Aboriginal Australians. Alzheimer's & Dementia 11:271–9.
Scandol JP, Toson B & Close JC 2013. Fall-related hip fracture hospitalisations and the prevalence of dementia within older people in New South Wales, Australia: An analysis of linked data. Injury 44(6):776–83.
3.13 Injury
Injury is a major contributor to mortality, morbidity and permanent disability in Australia. Based on the self-reported data in the Australian Bureau of Statistics 2012 Survey of Disability, Ageing and Carers (ABS 2013), 7% of the main long-term health conditions experienced by the estimated 4.2 million Australians living with a disability occurred as a result of injury or poisoning.
This snapshot illustrates the impact of injury by providing an overview of injury deaths and injury cases that were severe enough to require admission to hospital. Given that some injuries result in more than one stay in hospital, only the first hospitalisation was counted for each case where possible. Hospitalised injuries can range from single fractures to catastrophic injuries such as spinal cord injury or traumatic brain injury, which may result in life-long disability at a substantial cost to the health system.
Injury deaths
- Injury was recorded as a cause of more than 11,000 deaths in 2011–12 in Australia, or 7.6% of all deaths.
- Almost 40% of male injury deaths and almost 66% of female deaths occurred at ages 65 and older; 1.9% of deaths were at ages younger than 15.
- The most common causes of injury deaths in 2011–12 were falls (35%), intentional self-harm (22%) and transport accidents (14%).
- Adjusting for age, injury deaths decreased from 55 per 100,000 population in 1999–00 to 47 in 2004–05, with little change in more recent years. The injury death rate was 46 per 100,000 population in 2011–12.
- Rates of injury deaths for Indigenous Australians were consistently twice the rate for non-Indigenous Australians over the period from 2001–02 to 2011–12 (89 compared with 45 deaths per 100,000 population in 2011–12, respectively).
Injury hospitalisations
- In 2013–14, there were nearly 500,000 hospitalisations due to injury (5.3% of all hospitalisations). These represented an estimated 461,000 cases of hospitalised injury.
- The number of hospitalised injury cases per 100,000 population was higher for Indigenous people (3,521) than for other Australians (1,863). Indigenous females aged 30–34 had a rate of injury 5 times that of other Australian females in the same age group (4,812 compared with 918, respectively).
- The age group with the highest rate of hospitalised injury cases was people aged 85 and older, at 11,375 cases per 100,000 population.
- Two of the main causes of hospitalised injury cases in 2013–14 were falls (41%) and transport crashes (13%).
- In the past 10 years, statistically significant increases in age-standardised rates of hospitalised injury have occurred for injuries due to falls (a 2.4% increase per year) and intentional self-harm (a 0.4% increase per year). Significant decreases have occurred in the rate of hospitalised cases due to poisoning by pharmaceuticals (which fell by 4.1% per year), poisoning by other substances (3.6% per year), and drowning and near-drowning (1.2% per year).
Intentional self-harm and assault in young people
Rates of hospitalised cases of self-harm and assault injury were highest for males and females aged 15–19 (Figure 3.13.1).
Figure 3.13.1: Rates of hospitalised cases of intentional self-harm and assault in people aged 15–19, by sex, 2013–14
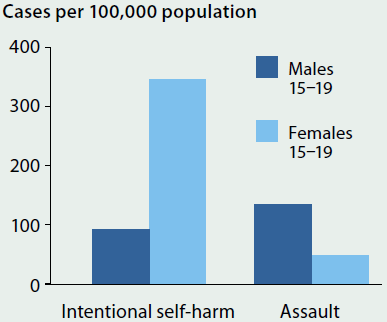
- Rates of hospitalised cases of intentional self-harm among young women (15–19) were 4 times higher than for young males in 2013–14.
- Among young women hospitalised due to self-harm, the most common cause was poisoning due to non-opioid analgesics, antipyretics and antirheumatics (for example, paracetamol and ibuprofen) (43%). For young men hospitalised due to self-harm, the most common cause was poisoning due to antiepileptic, sedative-hypnotic and antiparkinson drugs (for example, benzodiazepines, and barbiturates) (35%).
- Rates of hospitalisation for assault among young males were 3 times that of young females in 2013–14. The most common cause for both (69% and 62% respectively) was assault by bodily force (such as assault with a fist, foot or hand).
- Where a perpetrator of the assault was identified in the hospital record, the perpetrator was reported as being a spouse or domestic partner for 34% of cases in young women aged 15–19, compared with 0.5% of cases in young men.
What is missing from the picture?
Most injury cases do not require hospital admission or result in death, and they are not included here. Many of the most serious of these other injury cases attend hospital emergency departments (ED). National data on ED cases exist, but lack information on causes of injury and have other limitations for use in injury surveillance. Other injury cases are treated by general practitioners, at sports medicine clinics, by physiotherapists and elsewhere. Limited data are available on these cases.
Many injury cases, especially (but not only) those that require hospital admission, leave the person with long-lasting disability. The hospital data reported here describe the initial injury and do not provide information on the extent or timing of recovery.
Where do I go for more information?
More information on hospitalisations and deaths due to injury in Australia is available on AIHW website at Hospitalised injury in Australia. The reports Trends in hospitalised injury, Australia: 1999–00 to 2009–10 and Trends in injury deaths, Australia: 1999–00 to 2011–12 and other recent publications are available for free download.
Reference
ABS (Australian Bureau of Statistics) 2013. Disability, ageing and carers, Australia: summary of findings 2012. ABS cat. no. 4430.0. Canberra: ABS.
3.14 Oral health
Good oral health is an integral part of good general health and enables people to 'eat, speak and socialise without pain, discomfort or embarrassment' (Oral Health Monitoring Group 2015). Oral health can also affect general health through impacts on diet and nutrition, and there is evidence that chronic oral infections are associated with a range of other diseases and conditions, such as heart and lung diseases, stroke, low birthweight and premature births (NACDH 2012).
Since the late 1970s, oral health of children has improved in Australia (AIHW: Chrisopoulos et al. 2015), likely reflecting increased access to fluoridated drinking water and toothpaste, and improvements to preventive oral health services and dental hygiene practices. However, more recent trends suggest that children's oral health may be deteriorating. Poor adult oral health is strongly predicted by poor childhood oral health.
Children
Dental examinations of children in public dental clinics across six states and territories in 2010 (excluding New South Wales and Victoria) revealed that:
- more than half (55%) of 6-year-old children had experienced decay (decayed, missing or filled teeth) in their baby teeth (see Figure 3.14.1)
- almost half (48%) of 12-year-old children had experienced decay in their permanent teeth
- children aged 5 and 6 had the highest rates of untreated tooth decay, compared with older children
- children aged 8 and 9 had higher numbers of filled teeth than other children
- after decreasing steadily from the late 1970s, the average number of teeth affected by decay for children aged 6 and 12 plateaued in the late 1990s and early 2000s, and then increased. The average number of affected baby teeth of children aged 6 increased from 1.5 in 1996 to 2.6 in 2010. The average number of affected permanent teeth of children aged 12 increased from 0.8 in 2000 to 1.3 in 2010.
Figure 3.14.1: Proportion of children attending a school dental service with decayed, missing or filled teeth, by age, 2010
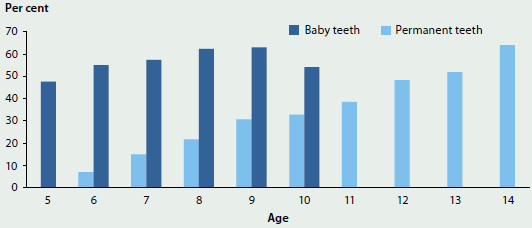
Note: Does not include New South Wales and Victoria.
Source: Child Dental Health Survey 2010.
Young people and adults
The National Dental Telephone Interview Survey of people aged 15 and over found that, in 2013:
- just over 1 in 25 people had no natural teeth. Among people aged 65 and over, 19% had lost all natural teeth
- on average, people were missing 5 teeth. The number of teeth missing increased with age, with an average of 2 teeth missing for those aged 15–24, and an average of 11 teeth missing for those aged 65 and over (Figure 3.14.2). People with dental insurance were missing an average of one tooth fewer than uninsured people
- about 12% of people with natural teeth wore dentures. Among this group, the prevalence of dentures increased with age and was highest (42%) for those aged 65 and over.
Figure 3.14.2: Average number of missing teeth, by age group (15 and over), 2013
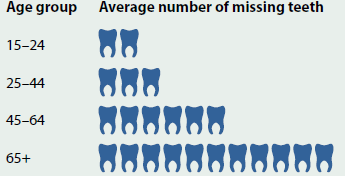
Note: Derived from self-reported data on the number of natural teeth at the time of interview and includes all missing teeth, regardless of the reason they were missing.
Source: National Dental Telephone Interview Survey 2013.
Among those aged 15 and over who had at least one natural tooth:
- about 16% of people experienced toothache in the previous 12 months (an increase from 11% in 1994). Toothache was most prevalent in adults aged 25–44
- about 1 in 5 (21%) people avoided eating certain foods due to problems with their oral health
- the proportion of people who were uncomfortable with their dental appearance has increased over time, from 20% in 1994 to 27% in 2013
- females were more likely to be uncomfortable with their appearance than males, with 31% of females reporting some level of discomfort compared with 23% of males.
In the previous 12 months people experiencing a toothache were:
more likely to be
 Female 17%
 Without dental insurance 20%
 From the lowest income group 24%
and less likely to be
 Male 15%
 With dental insurance 12%
 From the highest income group 9%
Dental visits
- In 2013, about two-thirds (64%) of people aged 5 and over had made a dental visit in the previous year. Children aged 5–14 were the most likely to have made a visit, with 79% visiting in the previous year, and 91% in the previous 2 years. The age group with the lowest proportion of dental visits was adults aged 25–44, with 55% visiting in the previous year, and 75% visiting in the previous 2 years.
- Almost half (44%) of adults aged 18 and over had a favourable (proactive) visiting pattern, where they visited a usual dentist for a check-up (rather than a problem) at least once a year.
- Most dental visits were made to a private dental practice (84%).
- Almost one-third (32%) of people delayed or avoided a visit to the dentist due to cost. People without private health insurance were twice as likely (44%) as those with insurance (20%) to avoid visiting a dentist due to cost.
- Of people who did visit a dentist in the previous 12 months, 20% did not receive the recommended dental treatment due to cost.
- In 2013–14, there were about 63,000 dental-related hospitalisations (2.7 per 1,000 population) that were considered potentially preventable if timely and adequate non-hospital care had been provided.
- Children aged 5–9 had the highest rate of potentially preventable hospitalisations due to dental conditions, with a rate of 9.3 hospitalisations per 1,000 children in that age group.
How much is spent?
- Spending on dental services (except those in hospitals) in Australia has increased by 46% over the last decade, from $5.9 billion in 2002–03 to $8.7 billion in 2012–13, adjusted for inflation. Per capita expenditure also increased over the same period, from $303 to $380, adjusted for inflation.
- Individuals were the largest source of funds for dental spending in 2012–13, paying directly out-of-pocket for 58% of dental costs. Total government contributions, including premium rebates from the Australian Government, and state and territory governments, amounted to 25%. Private health insurance funds paid 16%, while other non-government funding sources accounted for 0.4%.
What is missing from the picture?
There is a lack of recent clinical data about the oral health status of Australians. The National Dental Telephone Interview Survey is conducted every 2 to 3 years, and collects self-reported data only. The National Survey of Adult Oral Health, which supplements telephone interview survey data with clinical data from standardised dental examinations, was last conducted in 2004–06; the next survey is planned for 2016–18. The data on children's oral health status collected from state and territory public child dental health providers is incomplete and not very timely.
There is also a lack of routinely collected data about dental services provided in Australia. Some data are collected from public dental services, in relation to child dental services and to waiting times information for adult services, but the data are not necessarily comparable, due to variation between jurisdictions in the scope and coverage of public dental programs and data collection practices. Data on privately provided dental services are not collected nationally.
Where do I go for more information?
More information on oral health in Australia is available on the AIHW website at Dental and oral health. The AIHW report Oral health and dental care in Australia: key facts and figures 2015 is available for free download.
References
AIHW (Australian Institute of Health and Welfare): Chrisopoulos S, Harford JE, Ellershaw A 2016. Oral health and dental care in Australia: key facts and figures 2015. Cat. no. DEN 229. Canberra: AIHW.
Oral Health Monitoring Group 2015. Healthy mouths healthy lives: Australia's national oral health plan 2015–2024. Adelaide: COAG Health Council.
National Advisory Council on Dental Health (NACDH) 2012. Final report of the National Advisory Council on Dental Health. Canberra: Department of Health. Viewed 11 January 2016.
3.15 Vision and hearing disorders
Vision and hearing are important senses for communication, mobility and learning. Impaired vision or hearing can have implications for education, employment, social participation and independent living.
Vision disorders can be present from birth, result from an acute illness or injury, or develop over time because of chronic eye diseases and ageing (WHO 2015a). Hearing disorders can also be present from birth or develop because of an inherited condition, problems during pregnancy and delivery, infectious diseases, neurological disorders, injury or excessive noise, or develop over time with age (WHO 2015b). There is considerable variety in the types, causes and level of impairment of vision and hearing disorders.
How common are vision disorders?
Vision disorders are very common. Based on self-reported data from the Australian Bureau of Statistics (ABS) 2014–15 National Health Survey (NHS) (ABS 2015):
- over 12 million Australians (55%) had at least one long-term vision disorder
- the proportion of people with long-term vision disorders increased with age, from 10% of children aged 0–14, to 93% of people aged 55 and over (Figure 3.15.1)
- after adjusting for differences in the age structure of the population, vision disorders were more common among females (59%) than males (51%)
- the most common long-term vision disorders were long-sightedness and short-sightedness, with 1 in 4 Australians reporting each condition
- about 421,000 Australians (1.8% of the population) had a cataract, 236,000 (1.0%) had macular degeneration, and 129,000 (0.6%) had complete or partial blindness.
Figure 3.15.1: Vision and hearing disorders, by age, 2014–15
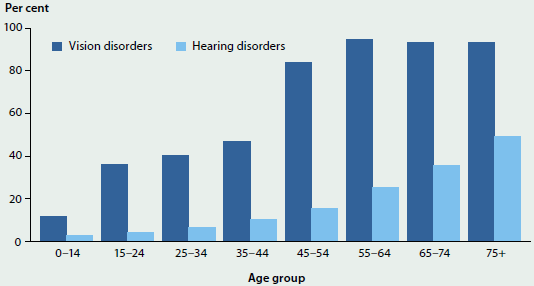
Source: ABS 2015 (Table 3.3).
How common are hearing disorders?
Hearing disorders are less common than vision disorders but still affect many Australians. Based on self-reported data from the ABS 2014–15 NHS (ABS 2015):
- over 3 million Australians (14%) had at least one long-term hearing disorder
- the proportion of people with long-term hearing disorders increased with age, from 3% of children aged 0–14, to 49% of people aged 75 and over (Figure 3.15.1)
- after adjusting for differences in the age structure of the population, hearing disorders were more common among males (18%) than females (11%)
- the most common long-term hearing disorder in Australia was complete or partial deafness, which affected 1 in 10 Australians
- more than 1.1 million people (4.9%) had other diseases of the ear and mastoid, and 79,000 (0.3%) had otitis media (middle ear infection).
Each year in Australia, more than 500 children are born with moderate to profound permanent childhood hearing impairment (MSAC 2007).
Health service use for vision and hearing disorders
- In 2012, 1 in 2 Australians (50%) wore glasses or contact lenses and 1 in 7 (15%) wore a hearing aid (ABS 2013b).
- In 2014–15, more than 364,000 hearing devices were issued under the Hearing Services Program (Office of Hearing Services 2015).
- In 2013–14, there were 8.9 hospitalisations for cataract extraction per 1,000 Australians, and 97% were performed on a same-day basis.
- In 2014–15, there were almost 564,000 Medicare claims for diagnostic audiology services (DHS 2015).
- In 2011, there were nearly 11,000 people employed in the eye health workforce, including over 6,000 allied ophthalmic personnel (such as optical dispensers, orthoptists and occupational therapists specialising in eye health), around 4,000 optometrists and over 800 ophthalmologists (specialist eye doctors).
Vision and hearing disorders among Aboriginal and Torres Strait Islander Australians
Aboriginal and Torres Strait Islander Australians experience higher rates of certain vision and hearing disorders than non-Indigenous Australians. In 2012–13, Indigenous Australians were more than twice as likely as non-Indigenous Australians to have partial or complete blindness, and more than twice as likely to have otitis media (ABS 2013a). Cataract and deafness were also more common among Indigenous Australians.
While Australia remains the only developed country with endemic trachoma (a bacterial eye infection that can lead to blindness), the rate of trachoma among 5–9 year olds in remote Indigenous communities dropped from an estimated 14% in 2009 to 4.7% in 2014 (Kirby Institute 2015).
What is missing from the picture?
Australia is a signatory to the global initiative Vision 2020—the right to sight, which aims to eliminate preventable and avoidable blindness by 2020. Due to limitations in the availability and completeness of eye health data, it is not currently possible to measure Australia's progress towards eliminating preventable and avoidable blindness. The National Eye Health Survey, led by Vision 2020 Australia and the Centre for Eye Research Australia, is under way to provide Australia's first national population-based data on the prevalence and causes of vision impairment.
Australian data on hearing disorders are similarly limited. In recognition of the importance of early diagnosis and appropriate intervention for childhood hearing loss, all states and territories have, or are implementing, infant hearing screening, with varying levels of coverage.
Where do I go for more information?
More information on eye health in Australia is available at Eye health.
References
ABS (Australian Bureau of Statistics) 2013a. Australian Aboriginal and Torres Strait Islander Health Survey: first results, Australia, 2012–13. ABS cat. no. 4727.0.55.001. Canberra: ABS.
ABS 2013b. Disability, Ageing and Carers, Australia: summary of findings, 2012. ABS cat. no. 4430.0. Canberra: ABS.
ABS 2015. National Health Survey: first results 2014–15. ABS cat. no. 4364.0.55.001. Canberra: ABS.
DHS (Department of Human Services) 2015. Medicare Australia Statistics—Medicare Benefits Schedule (MBS) Item Statistics Reports (MBS item numbers 11300-11339, 82300-82332). Canberra: Department of Human Services. Viewed 22 December 2015.
Kirby Institute 2015. Australian trachoma surveillance report 2014. Sydney: Kirby Institute.
MSAC (Medical Services Advisory Committee) 2007. Universal neonatal hearing screening: assessment report. MSAC reference 17. Canberra: Department of Health and Ageing.
Office of Hearing Services 2015. Annual Program Statistics 2014–2015. Canberra: Department of Health. Viewed 22 December 2015.
WHO (World Health Organization) 2015a. Deafness and hearing loss: fact sheet no. 300. Geneva: WHO. Viewed 22 December 2015.
WHO 2015b. Visual impairment and blindness: fact sheet no. 282. Geneva: WHO. Viewed 22 December 2015.
3.16 Incontinence
Incontinence, or any involuntary leakage of urine or faecal matter, is a widespread condition that can affect people at any age. However, it is particularly common among older people, and both its prevalence and severity increase with age. The condition varies by type, cause, and associated risk factors (ICI 2013)—ranging, for example, from idiopathic childhood bedwetting, to having trouble with toileting due to dementia. In many cases it can be treated effectively through non-drug measures such as exercise, weight loss or lifestyle changes, or through medical treatments such as medications and surgery. However, for some people, incontinence is a severe chronic condition that requires personal assistance and/or continence aids to manage. As a result, incontinence can have a major effect on a person's physical and emotional health, and it places demands on both the health care system and on informal carers.
Prevalence and management
Based on the 2012 Australian Bureau of Statistics Survey of Disability, Ageing and Carers, 1.8% of Australians (or 391,000 people with disability) experienced severe incontinence—determined by the need for assistance with bladder or bowel control, and/or the use of continence aids (ABS 2013). This increased by 24% (or 75,000 people) between 2009 and 2012. Severe incontinence was more common in women (2.2%) than in men (1.3%) in 2012 and, overall, prevalence increased with age (Figure 3.16.1). People aged 85 and over were more than 5 times as likely to experience severe incontinence as people aged 65–84 (28% compared with 5.0%).
Around 81% of people with severe incontinence 'always' or 'sometimes' needed assistance with their bladder or bowel control. People also commonly use aids and equipment to manage their condition: 45% of people with severe incontinence used aids to go to the toilet (such as toilet frames or chairs), and 64% used continence aids (such as absorbent pads, briefs and pants). The Australian Government subsidises this through the Continence Aids Payment Scheme, which cost $83.5 million in 2014–15.
Figure 3.16.1: Prevalence of severe incontinence, by age and sex, 2012
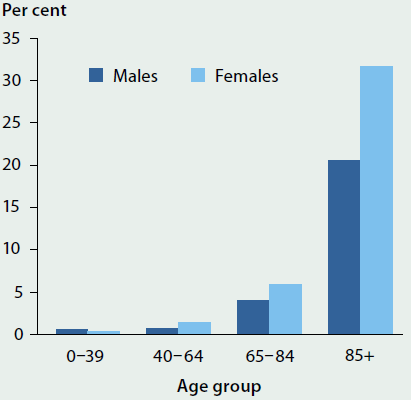
Source: AIHW analysis of the 2012 Survey of Disability, Ageing and Carers (ABS 2013).
Risk factors
Urinary incontinence is commonly linked to pregnancy, childbirth and menopause. Other risk factors include constipation, prostate problems, impaired mobility and underlying neurological or musculoskeletal conditions (such as stroke, dementia, or arthritis), and other health and lifestyle issues (such as diabetes or cardiovascular disease; obesity or physical inactivity; developmental disorders; and food/water intake). Risk factors for fecal incontinence are similar, and the presence of urinary incontinence is associated with an increased risk of fecal incontinence (ICI 2013).
Some commonly used medications—such as anticholinergic agents, many psychopharmaceuticals and sedatives, and diuretics—also contribute to triggering or worsening incontinence.
Frail older people experience incontinence more than other population groups (ICI 2013), and incontinence is a risk factor for admission into residential aged care (ICI 2013; Pearson 2003). At 30 June 2014, 81% of women and 75% of men in permanent residential aged care had some degree of incontinence that was not self-managed. The majority of people (71% of women and 65% of men) were in the most dependent category, experiencing three or more episodes of incontinence a week that required assistance.
What else do we know?
People commonly perceive incontinence as a normal or untreatable consequence of life events and age, and can experience shame, depression and reduced quality of life because of it (Coyne et al. 2013; Siddiqui et al. 2014). Fewer than one-third of people with incontinence seek medical attention for the condition (Avery et al. 2014). However, active diagnosis and management of incontinence may lead to the identification of a reversible or treatable cause (ICI 2013).
What is missing from the picture?
The estimated severity and prevalence of incontinence vary across studies. This is partly due to differences in how incontinence—and its severity—are defined, identified and measured, and partly due to differences between the studied populations. To improve the accuracy and comparability of data, the AIHW has suggested a set of standard questions for collecting information on incontinence, which may be accessed at Incontinence in Australia.
No comprehensive estimates of incontinence expenditure are available, and because incontinence is typically not the main condition for which people seek treatment, estimates of expenditure require more complex attribution of costs from different parts of the health system, including out-of-pocket costs.
Where do I go for more information?
More information is available in the AIHW report Incontinence in Australia. Information about support for people with incontinence and their carers can be found on the bladderbowel.gov.au and the Continence Foundation of Australia websites.
References
ABS (Australian Bureau of Statistics) 2013. Disability, Ageing and Carers, Australia: summary of findings, 2012. ABS cat. no. 4430.0. Canberra: ABS.
Avery JC, Gill TK, Taylor AW & Stocks NP 2014. Urinary incontinence: severity, perceptions and population prevalence in Australian women. The Australian and New Zealand Continence Journal 20(1):7–13.
Coyne KS, Wein A, Nicholson S, Kvasz M, Chen CI & Milsom I 2013. Comorbidities and personal burden of urgency urinary incontinence: a systematic review. International Journal of Clinical Practice 67(10):1015–33.
ICI (International Consultation on Incontinence) 2013. Incontinence: 5th edition 2013. Paris: ICI.
Pearson J 2003. Incidence of incontinence as a factor in admission to aged care homes. Canberra: Department of Health and Ageing.
Siddiqui NY, Levin PJ, Phadtare A, Pietrobon R & Ammarell N 2014. Perceptions about female urinary incontinence: a systematic review. International Urogynecological Journal 25(7):863–71.
3.17 Vaccine preventable disease
Vaccination is one of the most successful and cost-effective population health interventions. It can protect individuals from life-threatening diseases, and also reduces transmission in the community.
This snapshot looks at the most common notifiable vaccine preventable diseases (VPDs) in Australia. Notifiable diseases are medical conditions that are required to be reported by health practitioners or pathology laboratories to state or territory health authorities. Notifications data are presented for 2013 and 2014, and underlying causes of death data for 2013. Information on childhood vaccination is in 'Chapter 6.1 Prevention and health promotion'.
In 2014, about 275,600 notifications of more than 60 communicable conditions and diseases were made to the National Notifiable Diseases Surveillance System (NNDSS)—23% more than in 2013 (about 224,400) (NNDSS Annual Report Writing Group 2015b, forthcoming 2016) (Table 3.17.1).
More than one-third (about 101,400, or 37%) of the notifications in 2014 were for VPDs—a 70% increase on the 59,600 VPD cases notified in 2013 (27% of total notifications) (NNDSS Annual Report Writing Group 2015b, forthcoming 2016). Much of this was due to a rise in influenza notifications (see Figure 3.17.1).
It should be noted that influenza notifications can vary substantially from year to year due to the variation in true disease incidence as well as the propensity to notify. Factors that influence variation in true disease incidence include the similarity of circulating strains to vaccine strains, and a person's age, level of immunity and any other chronic medical conditions they may have.
Figure 3.17.1: Influenza notifications, Australia, 2001–2014
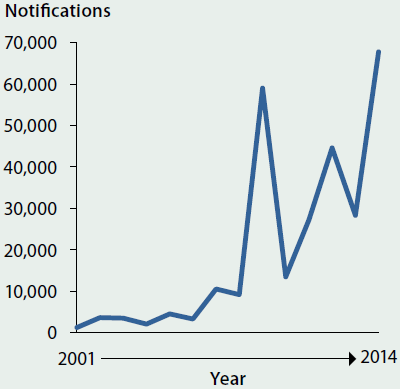
Source: National Notifiable Diseases Surveillance System.
Note: Influenza was first added to the list of notifiable diseases in 2001 and data for that year is incomplete.
Notifications represent cases where a person has sought medical care, had a test performed, been given a diagnosis, and a notification has been made to health authorities. For all notifiable diseases, the number of notifications is influenced by a range of factors, including public awareness, individual behaviours of patients, and the testing and notification practices of medical practitioners. Changes to testing policies; preferential testing of high-risk populations; the use of less invasive and more sensitive diagnostic tests; periodic awareness campaigns and media coverage may all influence the number of notifications received. These factors are likely to vary by region and over time, and are difficult to quantify.
For most diseases, the cases notified to the NNDSS represent only a proportion of total cases that occur in the community.
Impact of vaccine preventable diseases
- Several previously common VPDs have been eliminated or are now rare, including diphtheria (2 cases in 2014) and poliomyelitis (0 cases) (Table 3.17.1).
- Influenza was the most commonly notified VPD in 2014 (about 67,700 cases).
- In 2014, the varicella zoster virus, which causes chickenpox and shingles, was the next most commonly notified VPD (about 19,600 cases) after influenza.
- In 2013, there were 80 deaths recorded due to influenza, 32 due to the varicella zoster virus (29 of which were associated with cases of shingles), and 12 due to pneumococcal disease. This compares with 152 influenza deaths in 2012 (about 44,600 notifications), 26 shingles deaths (about 4,500 notifications) and 24 pneumococcal deaths (about 1,800 notifications) (ABS 2015; NNDSS Annual Report Writing Group 2015a). However, deaths and hospitalisations recorded as due to influenza are widely acknowledged to substantially underestimate the true number attributable to influenza, because the illness can exacerbate a range of other medical conditions, leading to hospitalisation or death (NCIRS 2010).
| Disease | Notifications 2014 | Notifications 2013 | Deaths 2013 |
|---|---|---|---|
| Influenza | 67,742 | 28,329 | 80 |
| Varicella zoster (total) | 19,658 | 16,986 | 32 |
| Pertussis | 11,863 | 12,341 | 2 |
| Pneumococcal (invasive) | 1,564 | 1,546 | 12(a) |
| Measles | 340 | 158 | 1 |
| Mumps | 190 | 217 | 0 |
| Haemophilus influenzae type b (invasive) | 21 | 20 | n.p. |
| Rubella | 17 | 25 | 0 |
| Tetanus | 3 | 4 | 1 |
| Diphtheria | 2 | 2 | 0 |
| Congenital rubella | 0 | 2 | 0 |
| Poliomyelitis infection | 0 | 0 | 0 |
| Total | 101,400 | 59,630 | 128 |
n.p. not published.
- Deaths data is only for pneumonia due to Streptococcus pneumoniae.
Sources: ABS 2015; NNDSS Annual Report Writing Group 2015b, forthcoming 2016.
Hospitalisations for vaccine preventable diseases
In 2013–14, there were nearly 12,000 hospitalisations due to vaccine preventable pneumonia (pneumonia due to Streptococcus pneumoniae and Haemophilus influenzae) and to influenza, and another 19,400 due to other VPDs. Hospitalisations are included in this analysis regardless of whether these diseases are the principal diagnosis or an additional diagnosis.
Some population groups had higher rates of hospitalisation per 1,000 population for vaccine preventable diseases than other Australians (AIHW 2015). For example rates were:
 6.3 per 1,000 for Indigenous Australians compared with 0.9 per 1,000 for non-Indigenous Australians.
 7.2 per 1,000 in Very remote areas compared with 1.3 per 1,000 in Major cities.
 2.0 per 1,000 in lowest socioeconomic areas compared with 0.8 per 1,000 in highest socioeconomic areas.
What is missing from the picture?
Notifications of VPDs to the NNDSS represent only a portion of all the cases occurring in the community, as not all individuals with VPDs present for medical care, and of those who do, not all are tested and/or notified. The proportion of under-reporting may vary between diseases, over time, and across jurisdictions. The number of notifications may be influenced over time by changes in testing practices, for example, by an increased propensity to test and/or to use more sensitive diagnostic tests, and these changes may be influenced by both clinician practice and patient expectations.
Where do I go for more information?
More information on VPDs is available at the Department of Health website. Information on immunisation is available from the National Centre for Immunisation Research and Surveillance website and the Immunise Australia Program. Information on national notification data is available from the NNDSS pages of the Department of Health website. Information on deaths in Australia is available at the AIHW and Australian Bureau of Statistics websites.
To overcome the limitations of the notification data in describing the epidemiology of influenza, notification data are complemented by a number of systems within the National Influenza Surveillance Scheme. More information is available at Australian Influenza Surveillance Report and Activity Updates.
References
ABS (Australian Bureau of Statistics) 2015. Causes of death, Australia, 2013 (Table 1.1). ABS cat. no. 3303.0. Canberra: ABS.
AIHW (Australian Institute of Health and Welfare) 2015. Admitted patient care 2013–14: Australian hospital statistics. Health services series no. 60. Cat. no. HSE 156. Canberra: AIHW.
NCIRS (National Centre for Immunisation Research & Surveillance) 2010. Vaccine preventable diseases in Australia, 2005 to 2007. Communicable Diseases Intelligence 34 (Supplement 37).
NNDSS (National Notifiable Diseases Surveillance System) Annual Report Writing Group 2015a. Australia's notifiable disease status, 2012: annual report of the National Notifiable Disease Surveillance System. Communicable Diseases Intelligence 39(1): E46–136.
NNDSS Annual Report Writing Group 2015b. Australia's notifiable disease status, 2013: annual report of the National Notifiable Disease Surveillance System. Communicable Diseases Intelligence 39(3):387–477.
NNDSS Annual Report Writing Group, forthcoming 2016. Australia's notifiable disease status, 2014. Annual report of the National Notifiable Disease Surveillance System.