
Chapter 7 Indicators of Australia's health
7.0 Introduction
The health of the population and the success of the health system can be evaluated and monitored using health indicators – statistics that report on a particular aspect of health or on the performance of the health system.
One such collection of indicators is set out in the National Health Performance Framework (NHPF) and, since 2008, at the request of Australia's health ministers, the AIHW has used its biennial Australia's health publication to report on the framework.
The NHPF covers three domains: health status; determinants of health; and health system performance.
This year, there is both good news and bad news in the 'health status' domain. The incidence of heart attacks continues to fall. Notification rates for hepatitis C have fallen, but the rates for a number of sexually transmissible diseases (syphilis, HIV, chlamydia and gonorrhoea) have increased. For the five cancers covered by the indicators, no changes in the incidence rates were seen in the most recent 10 years for which data are available.
Where sufficient data were available to assess a trend, most indicators of the 'determinants of health' generally showed either no change or favourable change. The one indicator in which an unfavourable trend was seen is the proportion of people who were obese or overweight. Overall, there were favourable changes in the proportions of: households with dependent children in which adults smoked inside the home; people with low income; people of working age who held a non-school qualification; adults who smoked daily; adults at risk of long-term harm from alcohol; and adults who were not sufficiently physically active to gain a health benefit.
The 'health system performance' domain includes indicators such as immunisation rates, potentially avoidable deaths and waiting times for emergency department care. Where trends could be assessed, most measures of health system performance showed either no change or favourable changes overall.
7.1 Indicators of Australia's health
Australians are generally considered to enjoy good health and to have an effective health system – but how can we be sure? Performance measurement is an important way in which we assess the health of our population and the success of health services and of the health system.
Performance measures, or health indicators, are summary measures designed to describe particular elements of our health or aspects of health system performance. Indicators have a range of purposes, and can:
- provide us with an understanding of the health of Australians and the quality of our health system (and allow us to compare different population groups, different geographic regions, and internationally)
- improve accountability and transparency of service provision and support consumer choices relating to health care
- provide us with information on the effectiveness of changes to policies or new practices and programs (when measured consistently over time)
- encourage ongoing performance improvements in service delivery by highlighting quality improvements and innovation and areas where improvements are needed.
The indicators that are selected for reporting generally reflect what is important to governments, to services providers, to the funders of the services (including taxpayers), as well as to patients and the broader Australian community.
Key national health indicator frameworks
Nationally agreed indicators are usually constructed as a 'set' of measures which are organised into frameworks. Health indicator frameworks provide the conceptual basis for the indicator sets and describe the broad aspects of health, its determinants and health care that are to be measured (for example, equity, quality and efficiency). They also depict the relationships between the indicators within the framework, and provide transparency in describing which aspects of the system are being assessed (or are not able to be assessed).
In Australia, a number of performance frameworks are used to assess aspects of our health and our health system. Some are related, and individual indicators may appear in more than one of the frameworks, but they have different purposes. In this article, the major national indicator frameworks are outlined and the latest data that enable us to measure performance against the indicators in the National Health Performance Framework (NHPF) are reported.
In addition to the national performance frameworks, there are a number of other (related) performance frameworks. These allow more in-depth monitoring of the health status of, and services delivered to, specific populations – for example, the Aboriginal and Torres Strait Islander Health Performance Framework (AHMAC 2015) – or focus on specific types of health services, such as the National Core Maternity Indicators (AIHW 2015e). Performance monitoring and reporting at other 'levels' of the health system is also undertaken, for example, by states and territories, and by some service provider organisations.
The national indicator framework and performance reporting arrangements are also accompanied by activities undertaken by health service providers to measure and monitor performance within their organisations, and to improve clinical outcomes and the appropriateness of services. These activities are related to (but not considered to be the same as) 'performance reporting. In recent years these activities have been supported by the Australian Commission on Safety and Quality in Health Care (ACSQHC). As part of its work to lead coordinated improvement in safety and quality in health care across Australia, the Commission undertakes and facilitates the development of safety and quality related indicators for use in such local monitoring (see 'Chapter 6.14 Safety and quality in Australian hospitals' for more information).
Other national health performance frameworks
National Healthcare Agreement
The National Healthcare Agreement (NHA) is an agreement between the Australian and state and territory governments that outlines the role and aims of Australia's health system; the roles and responsibilities of the parties; policy and reform directions proposed to achieve desired outcomes; and accountability requirements (COAG 2012). These requirements include reporting against specific performance indicators and performance benchmarks that are outlined within the specified outcome areas (better health; better health services; social inclusion and Indigenous health; and sustainability of the health system). Where possible, indicator data are disaggregated for specific population groups to ensure that the aims of focusing on social inclusion and addressing Indigenous disadvantage are being met.
The NHA indicator set outlines 33 performance indicator topics and 7 performance benchmarks. The NHA indicators are reported annually in the Report on government services (RoGS) series.
In addition to the NHA, a range of other national agreements (for example, the National Health Reform Agreement, and the National Indigenous Reform Agreement) include performance indicators related to health and health service delivery. Some of these indicators are also included in the NHA.
Review of Government Service Provision
The Review of Government Service Provision was established in 1993 by heads of government (now the Council of Australian Governments, or COAG) to provide information on the equity, efficiency and effectiveness of Australian government services and to promote ongoing performance improvement. National health performance information is released with information on other government services in the annual RoGS publications. The 2016 edition of RoGS included chapters on public hospitals, primary and community health, and mental health management (SCRGSP 2016).
The RoGS publications are based on performance indicators set against a framework that reflects the review's focus on outcomes, consistent with demand of governments for outcome-oriented performance information. This information is supplemented by information on outputs, grouped under equity, effectiveness and efficiency headings (SCRGSP 2016).
The Performance and Accountability Framework
The Performance and Accountability Framework (PAF) was agreed under the National Health Reform Agreement (COAG 2011) to provide Australians with information about the performance of hospital and health services in ways that are nationally consistent and locally relevant. In providing this information, it was intended to enable Australians to make more informed choices in relation to their health care services, and also to support governing bodies to perform their role more effectively.
The framework adopted for the PAF is based on the RoGS framework and adopts the definitions used in RoGS for the key concepts of equity, effectiveness and efficiency. The 48 indicators are intended for reporting in 2 streams: for Primary Health Networks (PHNs), and for hospitals/Local Hospital Networks. Not all are currently reported, as suitable data sources are still being identified and/or the performance indicator specifications have not been developed (NHPA 2016). Reporting against this framework is currently undertaken by the National Health Performance Authority through the MyHospitals and MyHealthyCommunities websites. Responsibility for this reporting will transfer to the AIHW in July 2016.
The National Health Performance Framework
The purpose of this article is to report on the latest data that are available for the indicators included in the NHPF. The NHPF was developed in 2001 by the National Health Performance Committee under the auspices of the Australian Health Ministers' Advisory Council (AHMAC) (AIHW 2012a; NHPC 2002). It provides a conceptual framework to understand and evaluate the health of Australians and the health system, and as such it was designed as an enduring framework – it is not linked to any particular agreement nor was it designed to support performance reporting relating to a specific policy agenda. Instead, it serves as a general support for performance assessment, planning and benchmarking in the health sector. It is consistent with health performance frameworks used internationally (ISO 2010; OECD 2013) so can support comparisons of Australia's performance internationally.
The NHPF has 14 health dimensions grouped under 3 domains: health status, determinants of health, and health system performance (Table 7.1.1).
A set of indicators was developed to populate the dimensions of the NHPF and, since 2008, at the request of health ministers, the AIHW has reported on these national health performance indicators biennially in the Australia's health report. The indicator set was most recently revised and agreed by health ministers in 2009. The indicators were developed so that they would meaningfully reflect the dimensions of the framework and be practical to implement in terms of cost effectiveness, timeliness and availability of quality data. There are 40 indicators across the 14 dimensions (tables 7.1.2, 7.1.3 and 7.1.4).
Table 7.1.1: The National Health Performance Framework (2nd edition)
| Health conditions | Human function | Wellbeing | Deaths |
|---|---|---|---|
| Prevalence of disease, disorder, injury or trauma, or other health-related states. | Alterations to body structure or function (impairment), activity limitations and restrictions in participation. | Measures of physical, mental and social wellbeing of individuals. | Mortality rates and measures of life expectancy. |
| Environmental factors | Community and socioeconomic | Health behaviours | Biomedical factors |
|---|---|---|---|
| Physical, chemical and biological factors such as air, water and soil quality. | Community factors such as social capital, support services, and socioeconomic factors such as housing, education, employment and income. | Attitudes, beliefs, knowledge and behaviours such as patterns of eating, physical activity, smoking, and alcohol consumption. | Genetic-related susceptibility to disease, and other factors such as blood pressure, cholesterol levels and body weight. |
| Effectiveness | Continuity of care | Safety |
|---|---|---|
| Care, intervention, or action provided is relevant to the client's needs and based on established standards. Care, intervention or action achieves desired outcome. | Ability to provide uninterrupted, coordinated care or service across programs, practitioners, organisations and levels over time. | The avoidance – or reduction to acceptable limits – of actual or potential harm from health care management or the environment in which health care is delivered. |
| Accessibility | Responsiveness | Efficiency and sustainability |
|---|---|---|
| People can obtain health care at the right place and right time irrespective of income, physical location and cultural background. | Service is client oriented. Clients are treated with dignity and confidentiality, and encouraged to participate in choices related to their care. | Achieving desired results with the most cost-effective use of resources. Capacity of the system to sustain workforce and infrastructure, to innovate and respond to emerging needs. |
Source: NHISSC 2009.
The NHPF indicators
The remainder of this article presents the latest data for the indicators that are currently in the NHPF. The indicators are reported in 3 sections that align with the NHPF domains. Each section includes a summary of findings, including a table listing the indicators, and columns indicating whether new data have become available since Australia's health 2014 (AIHW 2014b) and whether the available data show a favourable or unfavourable trend (where this could be assessed). Data for each indicator are disaggregated by other variables (such as age, sex, or Indigenous status) and/or are presented over time. Decisions about which variables to present were based on availability and quality of the data, potential usefulness, and availability of analyses elsewhere in this, and other, reports.
Assessment of trends
The assessment of trends has been made using the most recent 10 years of data that were available, and where comparable data were available for at least 3 time periods. The 10-year period was used for the trend assessment even where time series information is presented for longer periods. The exception is cancer survival rates and rates of overweight and obesity, for which the trend assessment is based on the longer time series information presented for the indicator.
A favourable trend is noted when the indicator has moved in the desired direction. (For example, life expectancy should increase and waiting times for elective surgery should decrease.) A trend is considered unfavourable if it is opposite to the desired direction. For indicators where the measure does not appear to have changed meaningfully over the time period, the trend is described as 'no change. For indicators where there are insufficient data to support trend analysis, the trend is described as 'no data/insufficient data.
Limitations of the NHPF performance indicators
The indicators for the NHPF were last reviewed and endorsed by health ministers in 2009. With the passage of time, some limitations have become evident for a number of the NHPF performance indicators. Data quality may have diminished, for example, where changes in the delivery of services has meant that data would need to be captured from more disparate sources, or changes in policies and priority areas for monitoring have meant that the usefulness of some indicators is now questionable.
A small number of indicators in the NHPF are not reported here:
- Survival following an acute coronary heart disease event (also not reported in 2014). The AIHW has judged that, due to changes in the methodology used to identify acute coronary events, reporting on this indicator is not appropriate.
- Proportion of people with diabetes who complete a GP annual cycle of care (also not reported in 2014). The AIHW has assessed that the available data are likely to result in an underestimate, due to changes in treatment patterns and recognition that people with diabetes may use other avenues for care.
- Selected potentially avoidable GP-type presentations to emergency departments. Recent work has demonstrated limitations in the methodology used (AIHW 2015d) and the AIHW is working with relevant stakeholders to revise the specification for this indicator. Indicator data are presented in RoGS (SCRGSP 2016).
- Cost per casemix-adjusted separation for acute and non-acute episodes. The previous calculation method is considered by a range of stakeholders to be no longer appropriate, and a revised methodology has not yet been agreed.
For indicators where no new data are available or where new data could not be readily obtained, data that have been previously reported are re-presented, though new disaggregations are presented where appropriate.
Indicators: health status
In the NHPF, health status is assessed by considering aspects of morbidity, mortality, functioning and wellbeing.
In relation to the aspects of morbidity, for the health conditions that are included in the NHPF (which are to some extent amenable to prevention or early intervention), findings were mixed. The incidence of heart attacks continued to fall, but hospitalisation rates for injury and poisoning increased in this period. For the five cancers examined, no changes in the incidence rate were seen in the most recent 10 years for which data are available.
For a number of sexually transmissible diseases (syphilis, HIV, chlamydia and gonorrhoea), available data show that the incidence is increasing – in particular, notification rates for chlamydia have increased by over 80% over the last 10 years. Notification rates for hepatitis B remained unchanged, and rates for hepatitis C have fallen.
For the measures of human functioning and wellbeing, there have been no meaningful changes in trends based on the available data.
There were favourable trends seen (overall) for all measures of mortality (deaths) for which sufficient data were available.
The indicators that are reported for health status are summarised in Table 7.1.2.
| NHPF dimension/Indicator | New data available | 10-year trend assessment |
|---|---|---|
| Health conditions | - | - |
| Incidence of heart attacks | Yes | Favourable |
| Incidence of selected cancers | - | - |
| bowel | Yes | No change |
| melanoma | Yes | No change |
| lung cancer | Yes | No change |
| breast cancer (females) | Yes | No change |
| cervical | Yes | No change |
| Incidence of sexually transmissible infections and blood-borne viruses | - | - |
| syphilis | Yes | Unfavourable |
| HIV | Yes | Unfavourable |
| hepatitis B | Yes | No change |
| hepatitis C | Yes | Favourable |
| chlamydia | Yes | Unfavourable |
| gonorrhoea | Yes | Unfavourable |
| Incidence of end-stage kidney disease | No | No data/ insufficient data |
| Hospitalisation for injury and poisoning | Yes | Unfavourable |
| Human function | - | - |
| Severe or profound core activity limitation | No | No change |
| Wellbeing | - | - |
| Psychological distress | Yes | No change |
| Self-assessed health status | Yes | No change |
| Deaths | - | - |
| Infant/young children mortality rate | - | - |
| infants (<1 year) | Yes | Favourable |
| Indigenous infants (<1 year) | Yes | Favourable |
| children aged 1-4 years | Yes | Favourable |
| Life expectancy | - | - |
| all males | Yes | Favourable |
| all females | Yes | Favourable |
| Indigenous males | No | No data/ insufficient data |
| Indigenous females | No | No data/ insufficient data |
Incidence of heart attacks
Definition: Number of deaths from coronary heart disease plus the number of non-fatal hospitalisations for heart attacks and unstable angina, per 100,000 population.
More information is available on this topic: 'Chapter 3.5 Coronary heart disease'.
Figure 7.1.1: Rates of heart attacks among people aged 25 years and over, 2013
Sources: AIHW National Hospital Morbidity Database; AIHW National Mortality Database.
- In 2013, the age-standardised heart attack rate was 379 per 100,000 people – a 29% decline from the rate for 2007 (534 per 100,000 people).
- The heart attack rate for males was more than twice that for females – 523 per 100,000 males compared with 246 per 100,000 females in 2013.
- Although the heart attack rate for Indigenous people (based on data from New South Wales, Queensland, Western Australia, South Australia and the Northern Territory) fell from 1,048 to 955 per 100,000 people between 2007 and 2013, it was higher than the rate for other Australians (528 per 100,000 people in 2007 and 382 in 2013).
Incidence of selected cancers
Definition: The number of new cases of breast cancer in females; bowel cancer; melanoma of the skin; lung cancer; and cervical cancer. Presented as age-standardised numbers per 100,000 population (per 100,000 females for breast and cervical cancers).
More information is available on this topic: 'Chapter 3.4 Cancer'.
Figure 7.1.2: Age-standardised incidence rates of selected cancers, 1982-2012
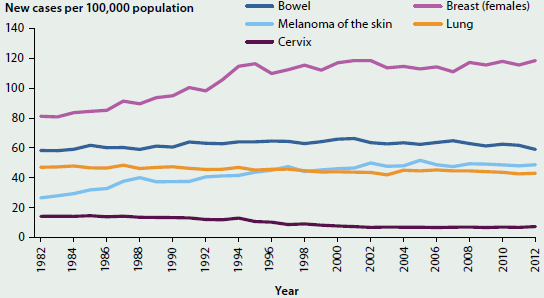
Source: AIHW Australian Cancer Database 2012.
- Between 1982 and 2012, incidence rates for lung cancer and bowel cancer remained relatively steady overall. However, the lung cancer incidence rate for males fell from 85 to 55 new cases per 100,000 males over this period, whereas the rate for females rose from 18 to 33 cases per 100,000 females.
- The incidence rate of melanoma rose between 1982 and 2002, and then remained fairly stable. The age-standardised rate for 2012 was 49 new cases per 100,000 people.
- The incidence rate of breast cancer (females only) rose between 1982 and 1994, and has remained fairly stable since then. The age-standardised rate for 2012 was 118 new cases per 100,000 females.
- For cervical cancer, the incidence rate fell between 1982 and 2001, and remained steady at 7 new cases per 100,000 for each year to 2012.
Incidence of sexually transmissible infections and blood-borne viruses
Definition: The number of notifications of syphilis, human immunodeficiency virus (HIV), hepatitis B, hepatitis C, chlamydia and gonorrhoea.
Figure 7.1.3: Notification rates of sexually transmissible infections and blood-borne viruses, 1996-2014
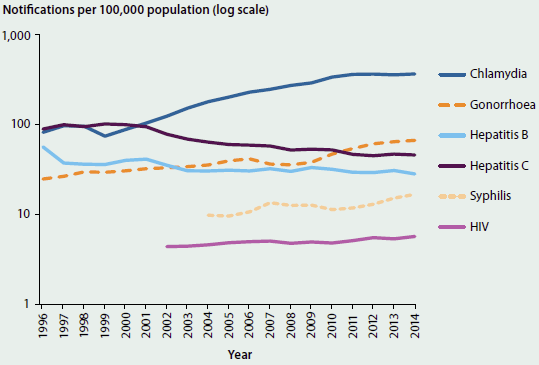
Note: Data are presented using a log scale.
Sources: Kirby Institute 2011, 2012, 2013, 2014, 2015b; National Notifiable Diseases Surveillance System.
- While chlamydia notification rates have increased substantially since 1996 (from 82 to 367 infections per 100,000 people), the rate has remained between 360 and 370 for the last 4 years.
- Gonorrhoea notification rates have increased since 1996 – most noticeably from 2008 to 2013, when the rate almost doubled, from 36 to 67 notifications per 100,000 people.
- Notification rates of hepatitis B and hepatitis C have fallen since 1996; however, the notification rates for hepatitis B have remained stable over the last 10 years whereas the notification rates for hepatitis C have continued to decline.
- The rate of syphilis notifications rose from 10 per 100,000 people in 2004 to 17 in 2014.
- The rate of HIV notifications per 100,000 people has risen by 30%, from 4.4 in 2002 to 5.7 in 2014.
Incidence of end-stage kidney disease
Definition: Number of new cases of treated end-stage kidney disease (ESKD) plus number of individuals who died with an underlying cause of death of 'renal failure' or an associated cause of death of 'chronic renal failure, end-stage, and did not receive dialysis or transplant treatment (untreated cases), per 100,000 population.
More information is available on this topic: 'Chapter 3.8 Kidney disease'.
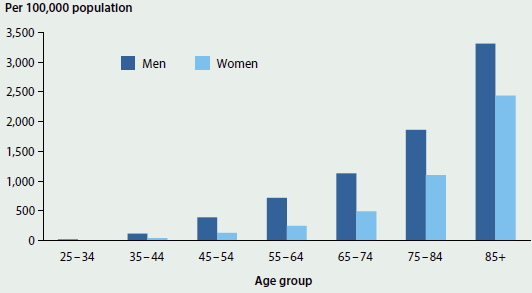
Figure 7.1.4: Incidence rate of ESKD, by age and sex, 2010
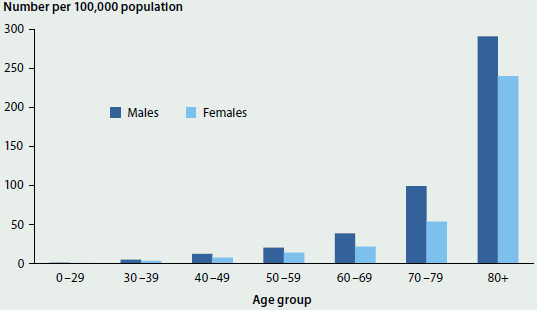
Sources: Combined data from the Australia and New Zealand Dialysis and Transplant Registry, the AIHW National Mortality Database and the National Death Index.
- In 2010, there were 4,800 new cases of ESKD, equating to an age-standardised rate of 20 per 100,000 population, with the rate higher among males than females (24 compared with 16 per 100,000 population).
- Incidence rates increased with age – with rates over 8 times as high among those aged 80 and over, compared with those aged 60-69 (260 and 30 new cases per 100,000 people, respectively).
- In 2004-07, the age-standardised ESKD incidence rate for Aboriginal and Torres Strait Islander people (based on data from New South Wales, Queensland, Western Australia, South Australia and the Northern Territory) was 115 per 100,000 population, which is over 6 times the rate for non-Indigenous people (19 new cases per 100,000 population).
- ESKD incidence rates were substantially higher in Very remote areas of Australia: the age-standardised incidence rate for Very remote areas was twice that of Remote areas, 3.5 times the rate for Outer regional areas and 4 times the rate for Major cities and Inner regional areas in 2005-07.
Hospitalisation for injury and poisoning
Definition: The number of hospitalised injury cases with a principal diagnosis of injury or poisoning. This is presented as a number per 100,000 people (age-standardised).
Note that the calculation method for this indicator has changed since Australia's health 2014 (AIHW 2014b). This means data presented here are not directly comparable with data reported in previous editions of Australia's health. Previously, all hospital episodes of care related to an injury were reported. For this article, estimated hospitalised injury cases (rather than episodes) are reported, which reduces the over-counting that occurs when there are multiple hospital episodes associated with the occurrence of an injury.
More information is available on this topic: 'Chapter 3.13 Injury'.
Figure 7.1.5: Rates of injury hospitalisations, by Indigenous status, age and sex, Australia, 2013-14
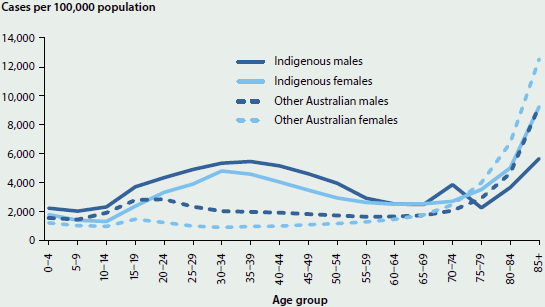
Source: National Hospital Morbidity Database, 2013-14.
- In 2013-14, there were 461,000 hospitalised cases of injury and poisoning. The age-standardised rate of injury and poisoning was 1,914 cases per 100,000 population, an increase from 1,736 cases per 100,000 in 1999-00.
- Overall, males experience a higher (age-standardised) rate of injury hospitalisations (2,221 cases per 100,000 population) than females (1,581 per 100,000). People aged 85 and over had the highest rate of injury compared with other age groups (11,375 cases per 100,000 population).
- Indigenous Australians were hospitalised due to injury and poisoning at almost twice the rate of other Australians, at an age-standardised rate of 3,521 cases per 100,000 population compared with 1,863.
- Fifteen per cent of injury cases were considered to have a high threat to life (based on the likelihood that the person would die in hospital). Injuries of this severity are likely to have a large impact on the patient, often with persisting problems and ongoing need for health care services.
Severe or profound core activity limitation
Definition: The percentage of people who 'sometimes' or 'always' need help with core activities of daily living (mobility, self-care or communication).
More information is available on this topic: 'Chapter 5.9 Health of Australians with disability'.
Figure 7.1.6: People with severe or profound core activity limitation, by age and sex, 2012
Source: ABS 2013f.
- In 2012, 6.1% of the population (1.4 million people) had a severe or profound core activity limitation – that is, a limitation in communication, mobility and/or self-care activities (ABS 2013f).
- Females (6.7%) were more likely than males (5.4%) to have a limitation of this type.
- After adjusting for differences in population structures, the rates remained broadly constant between 2003 (with an age-standardised rate of 6.2%) and 2012 (5.8%).
Psychological distress
Definition: The proportion of adults with very high levels of psychological distress as measured using the Kessler Psychological Distress Scale – 10 items (K10). The K10 is a scale of non-specific psychological distress based on 10 questions about negative emotional states in the 4 weeks before being interviewed.
More information is available on this topic: 'Chapter 3.11 Mental health'.
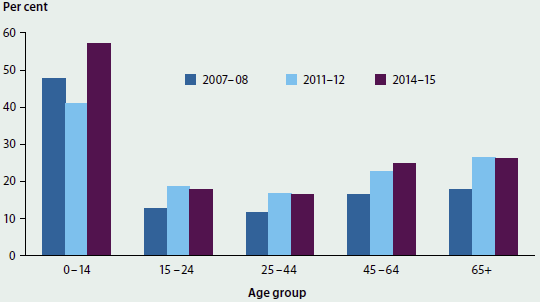
Figure 7.1.7: Adults with very high levels of psychological distress, by age and sex, 2014-15
Source: ABS 2015e.
- In 2014-15, 3.7% of adults had a very high level of psychological distress (ABS 2015e).
- Women were more likely than men to have a very high level of psychological distress – 4.3% for women compared with 3.1% for men.
- Women aged 55-64 had the highest rate of very high psychological distress (5.8%).
- Rates of very high psychological distress have remained similar over time, with 3.5% of people in 2007-08 and 3.4% of people in 2011-12 reporting a very high level of psychological distress (ABS 2009b, 2012a).
Self-assessed health status
Definition: The proportion of people aged 15 and over who self-assess their health as 'excellent' or 'very good'.
More information is available on this topic: 'Chapter 1.3 How healthy are Australians?'.
Figure 7.1.8: Self-assessed health status, by age, 2014-15
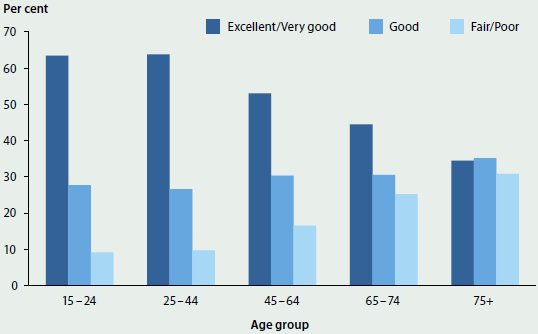
Source: ABS 2015e.
- In 2014-15, 56% of Australians aged 15 and over described their health as 'excellent' or 'very good' (ABS 2015e). This proportion has remained relatively stable over time.
- The percentage of people rating their health as 'excellent' or 'very good' decreases as age increases – 63% of 15-24 year olds rated their health as 'excellent' or 'very good' compared with 34% of people aged 75 and over.
- Slightly more females than males described their health as 'excellent' or 'very good' – 58% of females compared with 55% of males.
Infant/young child mortality rate
Definition: The number of deaths of infants (aged under 1) divided by the number of live births, and the number of deaths of young children (aged 1-4) divided by the population of the same age.
More information is available on this topic: 'Chapter 5.3 How healthy are Australia's children?'.
Figure 7.1.9: Mortality rate, Indigenous infants, all infants and all 1-4 year olds, 2001-2014
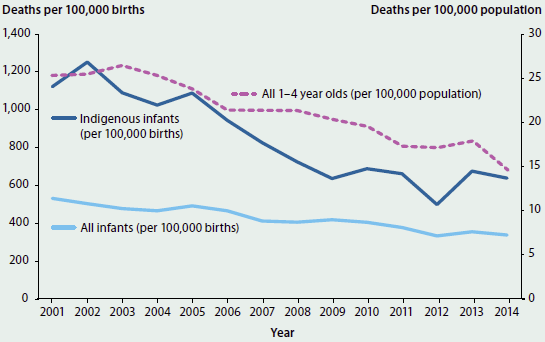
Notes
- Indigenous infant mortality includes data for NSW, Qld, WA, SA and NT only. These five jurisdictions have been included because there are sufficient levels of identification and numbers of deaths to support mortality analysis. They do not represent an Australia figure.
- Data for 2010 have been adjusted for the additional deaths arising from outstanding registrations of deaths in Queensland in 2010.
Sources: ABS 2006, 2007, 2008a, 2009a, 2010, 2012b, 2012c, 2013d, 2013e, 2014a, 2014b, 2015a, 2015b.
The infant mortality rate has decreased by 36% from 531 deaths per 100,000 births in 2001 to 338 deaths per 100,000 births in 2014.
- Over the same the period (2001 to 2014), the mortality rate for Indigenous infants (based on data from New South Wales, Queensland, Western Australia, South Australia and the Northern Territory) has fallen from 1,121 deaths per 100,000 births to 638 deaths per 100,000 births, a decrease of 43%. This rate is almost twice that for all infants.
- The mortality rate for young children has also fallen from 25 deaths per 100,000 population in 2001 to 15 in 2014.
Life expectancy
Definition: The number of years that a baby born in a given year can expect to live, if age-specific death rates do not change.
More information is available on this topic: 'Chapter 1.3 How healthy are Australians?'.
Figure 7.1.10: Life expectancy at birth, by Indigenous status and sex, 2002-2014
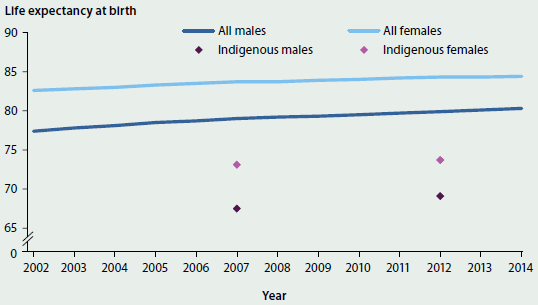
Note: These data refer to the 3-year period ending in the year shown (for example, '2014' data apply to babies born in the period 2012 to 2014).
Sources: ABS 2013e, 2013i, 2014b, 2015b.
- Life expectancy for a boy born in Australia between 2012 and 2014 was 80.3 years, and for a girl, 84.4 years.
- Over the last decade, the overall life expectancy at birth increased by 2.2 years for males and 1.4 years for females.
- The estimated life expectancy for an Indigenous boy born between 2010 and 2012 was 69.1 – 10.6 years lower than for a non-Indigenous boy. For Indigenous girls, the equivalent life expectancy was estimated to be 73.7 – 9.5 years lower than for non-Indigenous girls.
Indicators: determinants of health
In the NHPF, determinants of health are assessed by considering aspects of the environment in which people live, features of community and socioeconomic life, health behaviours that increase the likelihood of developing a range of diseases (and that are modifiable), and biomedical risk factors that are often influenced by health behaviours.
Where sufficient data were available to assess a trend based on the most recent 10 years of data, most indicators of determinants of health showed either no change or favourable changes. The one indicator in which an unfavourable trend was seen is the proportion of people who were obese or overweight.
Favourable changes were seen in relation to: the proportion of households with children in which adults report smoking inside the home, the proportion of people with low income, the proportion of people of working age who hold a non-school qualification, the proportion of adults who smoke daily, the proportion of adults at risk of long-term harm from alcohol, and the proportion of adults who are not sufficiently physically active to gain a health benefit.
No meaningful changes were seen in the proportions of households connected to mains water (as an indicator of water quality), or of babies born with low birthweight.
The indicators that are reported for determinants of health are summarised in Table 7.1.3.
| NHPF dimension/Indicator | New data available | 10-year trend assessment |
|---|---|---|
| Environmental factors | - | - |
| Children exposed to tobacco smoke in the home | Yes | Favourable |
| Water quality | No | No change |
| Community and socioeconomic | - | - |
| Proportion of people with low income | Yes | Favourable |
| Proportion of babies born with low birthweight | Yes | No change |
| Health literacy | No | No data/ insufficient data |
| Educational attainment for selected school years and adults | Yes | Favourable |
| Health behaviours | - | - |
| Proportion of adults who are daily smokers | Yes | Favourable |
| Proportion of adults at risk of long-term harm from alcohol | Yes | Favourable |
| Fruit and vegetable intake | Yes | No data/ insufficient data |
| Physical inactivity | Yes | Favourable |
| Biomedical factors | - | - |
| Proportion of persons obese and overweight | Yes | Unfavourable(a) |
- The trend assessment for this indicator is based on 20 years of data (rather than 10).
Children exposed to tobacco smoke in the home
Definition: The proportion of households with dependent children (aged 0-14) where adults report smoking inside the home.
More information is available on this topic: 'Chapter 4.7 Tobacco smoking'.
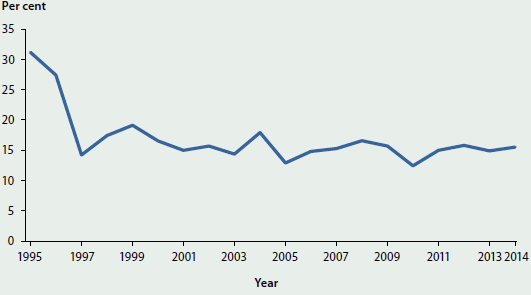
Figure 7.1.11: Households with dependent children aged 14 and under, by whether adults smoke in the home, 1995-2013
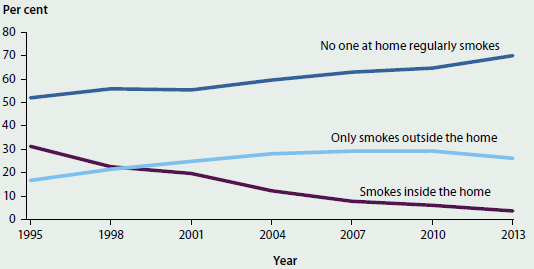
Source: AIHW 2014c.
- In 2013, fewer than 4% of households with children aged 14 and under included a person who smoked inside the home.
- This proportion has fallen by almost 90% since 1995, when 31% of households with dependent children included a person who smoked inside the home.
- For the first time since 1995 there was a drop in the proportion of people smoking outside the home – 26% in 2013 compared with 29% in 2007 and 2010.
- The proportion of households where no one regularly smokes at home has increased over time, from 52% of households in 1995 to 70% in 2013.
Water quality
Definition: The proportion of households connected to mains or town water.
Figure 7.1.12: Sources of water for Australian households, by part of state, 2013
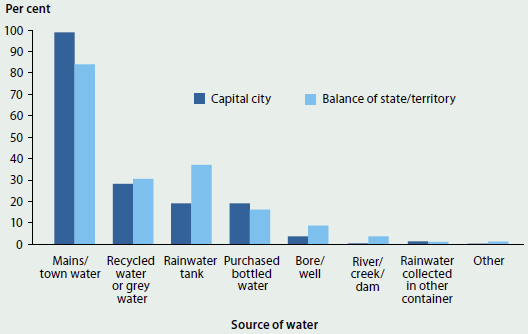
Note: Households may have more than one source of water.
Source: ABS 2013h.
- In March 2013, 8.3 million (93%) of Australian households used mains or town water as a source of water (ABS 2013h).
- Nearly all households in capital cities used mains or town water (99%), compared with 84% of households outside the capital cities. Households outside the capital cities were more likely to use rainwater tanks as a source of water (37%) compared with households in capital cities (19%).
- Household sources of water in March 2013 were consistent with those for 2007 and 2010.
Proportion of people with low income
Definition: There are numerous ways to measure low income. The method chosen for this indicator is to consider people living in households with an equivalised disposable household income (that is, after-tax income, adjusted for the number of people in the household) that is less than 50% of the national median. These data are presented as a proportion of all people.
More information is available on this topic: 'Chapter 4.1 Social determinants of health'.
Figure 7.1.13: People living in households with a low weekly equivalised disposable household income, relative to the national median, 2003-04 to 2013-14
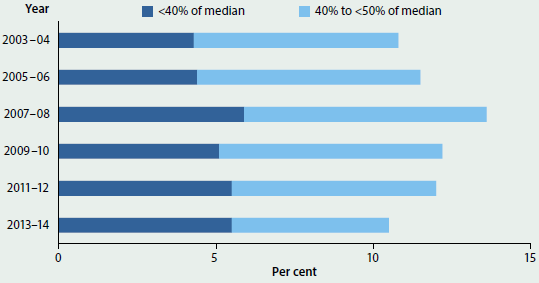
Sources: Unpublished data from the ABS 2003-04, 2005-06, 2007-08, 2009-10, 2011-12 and 2013-14 Surveys of Income and Housing.
- In 2013-14, the median equivalised disposable household income was $844 per week (ABS 2015d).
- In 2013-14, almost 2.4 million people lived on less than half the median equivalised household income (that is, less than $422 per week), including more than 1.2 million people living on less than 40% of the median ($338).
- The proportion of people living in low-income households (10.5% in 2013-14) is the lowest since 2003-04 (when it was a similar proportion, 10.8%), and follows a peak at 13.6% in 2007-08.
Proportion of babies born with low birthweight
Definition: Proportion of liveborn singleton babies born with a birthweight of less than 2,500 grams.
More information is available on this topic: 'Chapter 5.2 Trends and patterns in maternal and perinatal health'.
Figure 7.1.14: Babies born with low birthweight, by remoteness and socioeconomic group, 2013
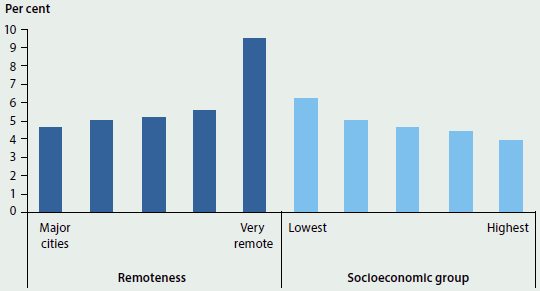
Source: AIHW National Perinatal Data Collection.
- In 2013, 4.8% (14,333) of live singleton babies were of low birthweight. This rate has not changed markedly over the past 10 years.
- The proportion of low birthweight babies increases with increasing levels of remoteness, with the proportion in Very remote areas being twice that in Major cities.
- The proportion of low birthweight babies was higher for mothers living in the lowest socioeconomic areas compared with those living in the highest socioeconomic areas.
- The proportion of low birthweight singleton babies born to Aboriginal and Torres Strait Islander mothers was 11% in 2013, 2.4 times the proportion of babies born to non-Indigenous mothers.
Health literacy
Definition: Proportion of 15-74 year olds with health literacy above the minimum level regarded as necessary for understanding and using information relating to health issues.
More information is available on this topic: 'Chapter 4.1 Social determinants of health'.
Figure 7.1.15: Health literacy, by age, 2006
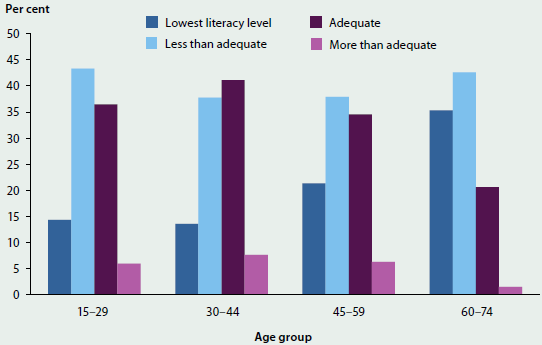
Source: ABS 2008b.
- In 2006, 41% of Australians aged 15-74 were assessed as having adequate or more than adequate health literacy skills (ABS 2008b).
- People aged 30-44 were most likely to have health literacy skills that were adequate or better (49%) and people aged 60-74 were least likely to have health literacy skills that were adequate or better (22%).
- Levels of health literacy skills were similar for males and females.
Educational attainment
Definition: The proportion of people aged 25-64 with a non-school qualification (diploma, certificate or degree).
More information is available on this topic: 'Chapter 4.1 Social determinants of health'.
Figure 7.1.16: People aged 25-64 with a non-school qualification, by age group, 2001-2015
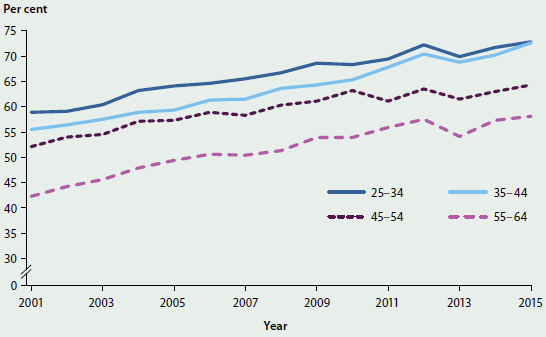
Note: From 2013, persons permanently unable to work were included in the scope of the Survey of Education and Work, and re-based Estimated Resident Population data were used from 2014. These factors may affect the comparison of data over time.
Sources: ABS 2011a, 2012d, 2013g, 2015c.
- More than two-thirds (67%) of people aged 25-64 had a non-school qualification in 2015, an increase from 53% in 2001.
- While more men (69%) than women (66%) had a non-school qualification in 2015, the gender gap has narrowed since 2001, when 58% of men and 49% of women had a non-school qualification.
- The proportion of people with a non-school qualification decreases with remoteness. Of people living in Major cities, 70% had a non-school qualification. This decreased to 63% for people living in Inner regional areas, 60% for people living in Outer regional areas and 55% for people living in Remote and very remote areas.
Proportion of adults who are daily smokers
Definition: Adults (aged 18 and over) who smoke tobacco every day.
More information is available on this topic: 'Chapter 4.7 Tobacco smoking'.
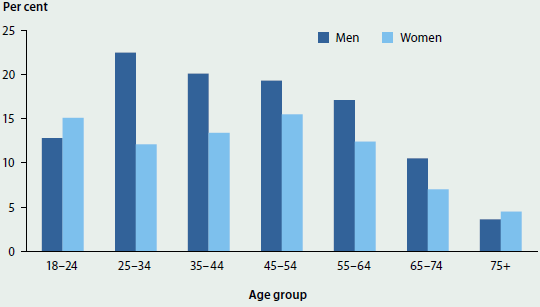
Figure 7.1.17: Proportion of daily smokers, aged 18 and over, by age group and sex, 2014-2015
Source: ABS 2015e.
- In 2014-15, 15% of people aged 18 and over smoked daily (17% of males and 12% of females).
- Age-standardised daily smoking rates have fallen since 2001, when 25% of men and 20% of women smoked daily.
- In 2014-15, for men, the 25-34 age group had the highest daily smoking rate, whereas for women, the 45-54 age group had the highest daily rate.
Proportion of adults at risk of long-term harm from alcohol
Definition: The proportion of people aged 18 and over whose alcohol consumption pattern puts them at risk of lifetime alcohol-related harm (consumed more than 2 standard drinks per day on average), according to 2009 National Health and Medical Research Council (NHMRC) guidelines (NHMRC 2009). Presented as an age-standardised percentage.
More information is available on this topic: 'Chapter 4.6 Alcohol risk and harm'.
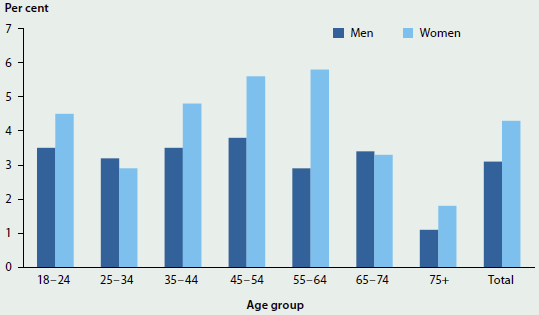
Figure 7.1.18: Age-standardised proportion of people aged 18 and over who exceeded lifetime risk guidelines for alcohol, by sex, 2001 to 2014-2015
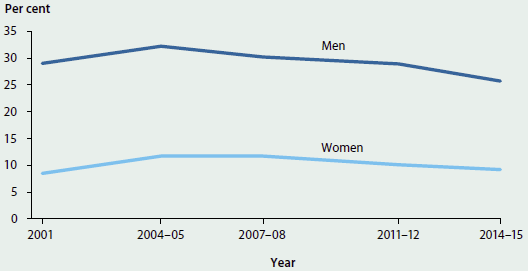
Sources: Unpublished data from the ABS National Health Survey: 2001 to 2011-12 (customised report); AIHW analysis of ABS 2015e.
- In 2014-15, 17% of adults consumed more than 2 standard drinks per day on average, exceeding the lifetime risk guideline.
- Rates of risky alcohol consumption for adults have fluctuated over time, peaking in 2004-05 and declining by 21% since then.
- Men were almost 3 times as likely as women to consume alcohol at risky levels – 26% for men compared with 9% for women – but the proportion of men who consumed alcohol at risky levels in 2014-15 was lower than the proportion in 2001 (29%). The proportion of women was the same at both times.
Fruit and vegetable intake
Definition: The proportion of people eating sufficient serves of fruit and vegetables each day to obtain a health benefit.
Calculation of this indicator is based on relevant dietary guidelines published by the NHMRC. Revised dietary guidelines for Australia were published in 2013 (NHMRC 2013). Calculation of this indicator is now based on these new guidelines and therefore may not be directly comparable with data presented in previous editions of Australia's health.
In the latest NHMRC guidelines (NHMRC 2013), the minimum recommended number of serves of fruit per day is 1 for children aged 2-3 years, 1% for children aged 4-8, and 2 for people aged 9 and over. The minimum recommended number of serves of vegetables per day is 2% for children aged 2-3; 4% for children aged 4-8; 5 for children aged 9-11, females aged 12 and over and males aged 70 and over; 5% for males aged 12-18 and 51-70; and 6 for males aged 19-50.
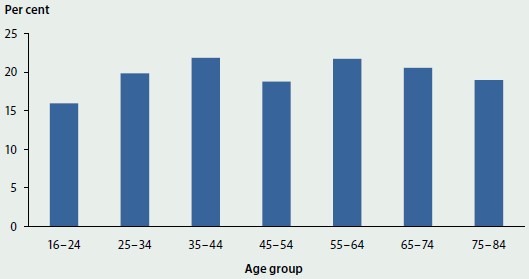
Figure 7.1.19: People aged 2 and over who ate the recommended daily intake of fruit and vegetables, by age, 2014-15
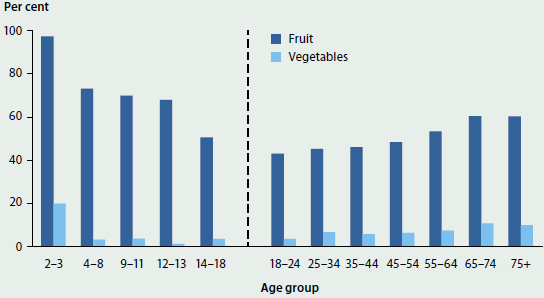
Note: NHMRC guidelines define children as aged 2 to 18 and adults as aged 19 and above. ABS data are presented for children aged 2 to 18 as per NHMRC guidelines and adults aged 18 and over as per the standard definition for adulthood. Hence, 18-year-old people are included in 2 age groups and data should be considered separately for children and adults.
Source: ABS 2015e.
- In 2014-15, 50% of adults and 68% of children ate sufficient serves of fruit, and 7% of adults and 5% of children ate sufficient serves of vegetables, based on the 2013 NHMRC guidelines.
- For adults, sufficient fruit intake and sufficient vegetable intake were highest in the 65-74 age group. For children, sufficient fruit intake and sufficient vegetable intake were highest in the 2-3 year age group.
- Overall, 5% of adults had a sufficient intake of both fruit and vegetables. Females were more likely to eat sufficient fruit and vegetables than males (8% compared with 3%).
Physical inactivity
Definition: The proportion of adults who did not participate in sufficient regular physical activity to gain a health benefit. The recommended minimum level of activity is 150 minutes per week of walking or other moderate or vigorous activity, over at least 5 sessions (DHAC 1999).
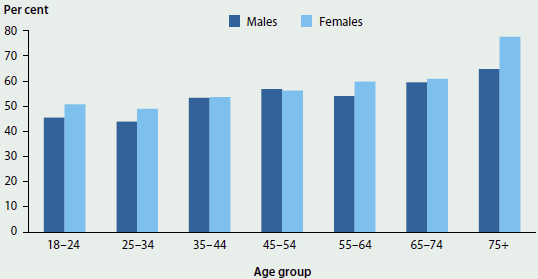
Figure 7.1.20: Adults who did not participate in sufficient physical activity, by age and sex, 2014-15
Source: ABS 2015e.
- In 2014-15, 54% of adults were not sufficiently active to meet the recommended minimum level of activity (ABS 2015e). This is a decrease from 62% of adults in 2007-08 and 56% of adults in 2011-12 (ABS 2011b, 2013b).
- Insufficient activity levels increased with age, with 72% of people aged 75 and over insufficiently active compared with 48% of those aged 18-24.
- Overall, the proportion of females who were insufficiently active was greater than the proportion of males (56% compared with 53%).
Proportion of people obese and overweight
Definition: Proportion of people who are overweight or obese. Body mass index (BMI) is a measure that classifies a person as underweight, normal weight, overweight or obese. It is calculated as the person's weight in kilograms divided by their height in metres squared. 'Overweight' is defined as a BMI of 25 or over and 'obesity' is defined as a BMI of 30 or more.
More information is available on this topic: 'Chapter 4.4 Overweight and obesity'.
Figure 7.1.21: Age-standardised rate of overweight or obesity, people aged 18 and over, by sex, 1995 to 2014-2015
Sources: Unpublished data from the ABS National Health Survey: 2001 and 2007-08 (customised report); ABS 2013c; AIHW analysis of ABS 2015e.
- In 2014-15, the majority of Australian adults (63%) were either overweight or obese.
- Among adults, rates of overweight and obesity were highest in the 55-64 age group (75%) and lowest in the 18-24 age group (39%).
- After adjusting for differences in the age structure, rates of overweight and obesity rose from 57% in 1995 to 61% in 2007-08, and to 63% in 2011-12. Rates were stable between 2011-12 and 2014-15 (also 63%).
- Changes in rates for males showed a similar pattern. The age-standardised rate for males rose from 65% in 1995 to 68% in 2007-08, and to 70% in 2011-12. Rates for males were stable between 2011-12 and 2014-15 (also 70%). Rates for females also rose between 1995 and 2007-08 (from 49% to 54%), but have since remained more stable (55% in 2011-12 and 56% in 2014-15).
- The proportions of children aged 5-17 who were overweight or obese were similar in 2014-15 (27%), 2011-12 (26%) and 2007-08 (25%) and an increase over the 21% in 1995 (ABS 2009b, 2013c, 2015e).
Indicators: health system performance
In the NHPF, health system performance is assessed by considering aspects of the effectiveness of health systems (which incorporates aspects of quality); the safety of hospital care; continuity of care; the accessibility of selected health services; and growth in the numbers of key health and medical workforce personnel.
Most measures of health system performance (where the trend could be assessed) show either that there has been no meaningful change to the indicator in the last 10 years for which data are available or show favourable trends (overall) for this period. None of the indicators in this domain showed an unfavourable trend in this period.
For the 'effectiveness' dimension, favourable trends are seen for: immunisation rates for 5 year olds for vaccines in the national schedule, survival of people diagnosed with cancer (5-year relative rates, trends for which have been assessed over a longer time period due to the nature of this indicator) and potentially avoidable deaths. Within the 'continuity of care' dimension, the proportion of people with asthma with a written asthma action plan and the proportion of people with mental illness with a general practitioner (GP) care plan both have favourable trends. Bulk-billing for non-referred (GP) attendances and waiting time for emergency department care have favourable trends in the 'accessibility' dimension, as does net growth in health workforce (for both medical practitioners and nurses/midwives) in the 'efficiency and sustainability' dimension.
The dimension of 'safety' was the one area where no indicators were assessed as having a favourable trend. Both of the indicators included in this dimension (adverse events treated in hospitals, and falls resulting in patient harm in hospitals) showed increased rates over the relevant period for assessment, but were assessed as showing no meaningful change. This assessment was made based on the need to be cautious in interpreting changes in the data which could also reflect improved reporting of patient safety events within hospitals.
The indicators that are reported for health system performance are presented in this section and are summarised in Table 7.1.4.
| NHPF dimension/Indicator | New data available | 10-year trend assessment |
|---|---|---|
| Effectiveness | - | - |
| Unsafe sharing of needles | Yes | No change |
| Immunisation rates for vaccines in the national schedule | - | - |
| 1 year | Yes | No change |
| 2 years | Yes | No change |
| 5 years | Yes | Favourable |
| adults | No | No data/ insufficient data |
| Selected potentially preventable hospitalisations | Yes | No change |
| Survival following acute coronary heart disease event | No | No data/ insufficient data |
| Survival of people diagnosed with cancer (5-year relative rates) | Yes | Favourable(a) |
| Potentially avoidable deaths | Yes | Favourable |
| Safety | - | - |
| Adverse events treated in hospitals | Yes | No change |
| Falls resulting in patient harm in hospitals | Yes | No change |
| Continuity of care | - | - |
| Proportion of people with diabetes with a GP annual cycle of care | No | No data/ insufficient data |
| Proportion of people with asthma with a written asthma action plan | Yes | Favourable |
| Proportion of people with mental illness with a GP care plan | No | Favourable |
| Accessibility | - | - |
| Bulk-billing for non-referred (GP) attendances | Yes | Favourable |
| Selected potentially avoidable GP-type presentations to emergency departments | No | No data/ insufficient data |
| Waiting time for elective surgery | Yes | No change |
| Waiting time for emergency department care | Yes | Favourable |
| Cancer screening rates | - | - |
| breast | Yes | No change |
| cervical | Yes | No change |
| bowel | Yes | No data/ insufficient data |
| Differential access to hospital procedures | Yes | No data/ insufficient data |
| Proportion of pregnancies with an antenatal visit in the first trimester | Yes | No change |
| Responsiveness | - | - |
| No indicators for this dimension | - | |
| Efficiency & sustainability | - | - |
| Net growth in health workforce | - | - |
| medical practitioners | Yes | Favourable |
| nurses and midwives | Yes | Favourable |
| Cost per case mix-adjusted separation for acute and non-acute care episodes | No | No data/ insufficient data |
- Because relative survival is measured for 5-year periods for people with cancer, the trend assessment for this indicator is based on 30 years of data (rather than 10).
Unsafe sharing of needles
Definition: The percentage of injecting drug users participating in surveys carried out at needle and syringe programs, who report re-using someone else's needles and syringes in the last month.
More information is available on this topic: 'Chapter 6.15 Specialised alcohol and other drug treatment services'.
Figure 7.1.22: Injecting drug users who report using needles and syringes after someone else in the last month, 1995 to 2014
Source: Kirby Institute 2015a.
- In 2014, 16% of injecting drug users participating in the Australian Needle and Syringe Program Survey reported using needles and syringes after someone else in the month before the survey.
- This proportion dropped markedly from 1995 (31%) to 1997 (14%) and has fluctuated since then.
Immunisation rates for vaccines in the national schedule (children)
Definition: The proportion of 1, 2 and 5 year olds who have been assessed as fully immunised according to the Australian Childhood Immunisation Register.
More information is available on this topic: 'Chapter 5.3 How healthy are Australia's children?'.
Figure 7.1.23: Immunisation rates for vaccines in the national schedule, children aged 1, 2 and 5, 1999 to 2015
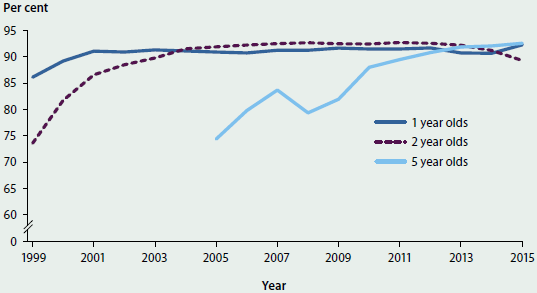
Source: Australian Childhood Immunisation Register.
- The immunisation rate for 1 year olds increased from 1999 to 2001 and remained relatively stable from then to 2012. The slight fall in the rate for 2013 and 2014 may have been due to a change in the definition of 'fully immunised' in 2013. The rate was 92% in 2015.
- For 2 year olds, the immunisation rate increased markedly from 1999 to 2004, and remained relatively stable at 92% to 93% until 2013. The rate has fallen to 89% in 2015. Changes in the definition of 'fully immunised', implemented in 2014, may have contributed to this drop.
- The immunisation rate for 5 year olds has continued to increase, from 74% in 2005 to 93% in 2015. Children who have had catch-up immunisations are included as 'fully immunised' even if they were not fully immunised when they were 1 or 2 years old.
- For Indigenous children in 2015, the immunisation rate for 1 and 2 year olds was lower than the rate for all children (89% compared with 92% for 1 year olds and 86% compared with 89% for 2 year olds); but the immunisation rate for Indigenous 5 year olds was higher than the rate for all children (94% compared with 93%).
Immunisation rates for vaccines in the national schedule (older people)
Definition: Proportion of people aged 65 and over who have been vaccinated for influenza and pneumococcal disease.
More information is available on this topic: 'Chapter 3.17 Vaccine preventable diseases'.
Figure 7.1.24: Adults aged 65 and over vaccinated against influenza and pneumococcal disease, by remoteness area, 2009
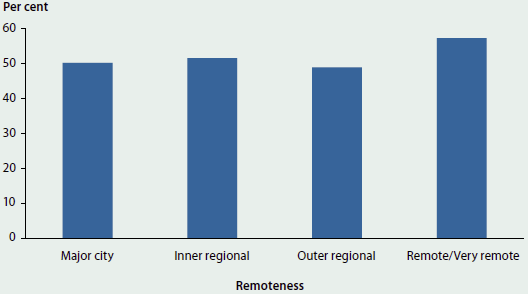
Source: AIHW 2009 Adult Vaccination Survey.
- In 2009, 51% of Australian adults aged 65 and over reported they were immunised against pneumococcal disease and influenza.
- Vaccination rates for influenza and pneumococcal disease were highest in Remote and very remote areas (57%) but generally similar for Major cities (50%), Inner regional (52%) and Outer regional areas (49%).
- Between 2006 and 2009, vaccination rates for influenza and pneumococcal disease fell among those aged 65 and over, from 59% to 51%.
Selected potentially preventable hospitalisations
Definition: Hospitalisations thought to have been avoidable if timely and adequate non-hospital care had been provided, either to prevent the condition occurring, or to prevent the hospitalisation for the condition. They are categorised as Vaccine preventable conditions (for example, measles); Acute conditions (for example, ear, nose and throat infections); and Chronic conditions (such as diabetes complications).
Note that there have been recent changes to this indicator specification, meaning data presented here are not directly comparable with data reported in previous editions of Australia's health.
Figure 7.1.25: Age-standardised rates of selected potentially preventable hospitalisations, by Indigenous status, 2013-14
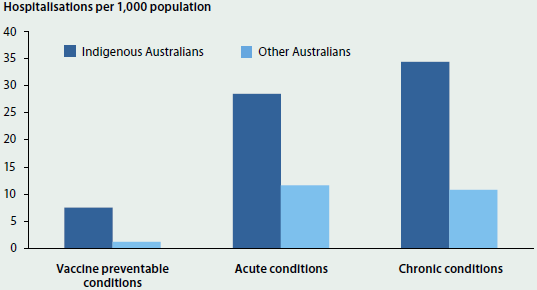
Source: AIHW National Hospital Morbidity Database.
- In 2013-14 there were an estimated 24 potentially preventable hospitalisations per 1,000 population. This rate has decreased slightly since 2007-08 (from 26 hospitalisations per 1,000 population); however, the data may have been affected by changes in classification and reporting over time.
- Potentially preventable hospitalisations accounted for 6.2% of all hospitalisations (8.1% of hospitalisations in public hospitals and 3.4% of hospitalisations in private hospitals).
- The rate of potentially preventable hospitalisations for Indigenous Australians was almost 3 times the rate for other Australians.
- Acute and Chronic conditions were the most common reasons for potentially preventable hospitalisations, at 12 and 11 hospitalisations per 1,000 population respectively. Vaccine preventable conditions occurred at a rate of 1.3 per 1,000 population.
- Urinary tract infections (24%) and Dental conditions (22%) accounted for almost half of the Acute conditions that were considered potentially preventable, while Chronic obstructive pulmonary disease (22%) and Congestive cardiac failure (19%) were the most common Chronic conditions. Pneumonia and vaccine-preventable influenza accounted for 38% of Vaccine preventable conditions.
Survival of people diagnosed with cancer (5-year relative rates)
Definition: The percentage of people diagnosed with cancer who survived for at least 5 years after diagnosis, relative to people of the same age and sex in the general population.
More information is available on this topic: 'Chapter 3.4 Cancer'.
Figure 7.1.26: Five-year relative survival for selected cancers, 1982-1986 and 2007-2011
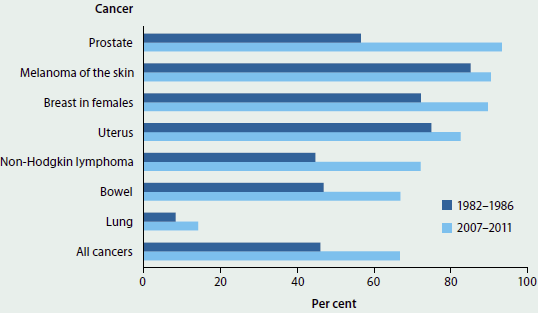
Note: The seven cancers presented are those with the highest incidence rates.
Source: AIHW Australian Cancer Database 2011.
- The 5-year relative survival for all cancers combined for 2007-2011 was 67%. This is an increase from 46% for 1982-1986.
- The 5-year relative survival for females (68%) is higher than that for males (66%) – a difference of 2 percentage points. The difference between relative survival for males and females has become smaller over the last 30 years: in 1982-1986, the 5-year relative survival for females was 52%, while that for males was 40%, a difference of 12 percentage points.
- People aged 15 to 24 have the highest 5-year relative survival (87%), while people aged 75 and over have the lowest (48%).
Potentially avoidable deaths
Definition: The number of deaths each year of people aged under 75 from conditions that are potentially preventable through individualised care and/or treatable through existing primary or hospital care.
Note that there have been recent changes to this indicator specification, meaning data presented here are not directly comparable with data reported in previous editions of Australia's health.
Figure 7.1.27: Age-standardised death rates for potentially avoidable deaths, by sex, 1997 to 2013
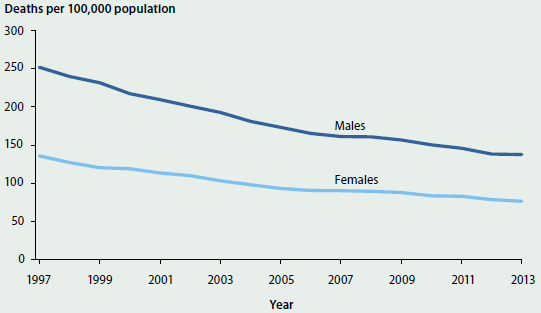
Source: AIHW National Mortality Database.
- In 2013, there were around 25,400 potentially avoidable deaths in Australia – an age-standardised rate of 107 deaths per 100,000 population. This is a decrease of 45% from the rate of 193 deaths per 100,000 population in 1997.
- The age-standardised rate for males in 2013 was almost twice the rate for females – 138 deaths per 100,000 males compared with 76 deaths per females.
- The 5-year aggregate rate for 2009-2013 for Indigenous people (based on data from New South Wales, Queensland, Western Australia, South Australia and the Northern Territory) was 351 potentially avoidable deaths per 100,000 population, which is more than 3 times the rate for non-Indigenous people (110 deaths per 100,000 population).
Adverse events treated in hospitals
Definition: The number of hospitalisations involving an adverse event. This is presented as a number per 100 hospitalisations.
Adverse events are defined as incidents in which harm resulted to a person receiving health care. They include infections, falls resulting in injuries, and problems with medication and medical devices. Some adverse events may be preventable. For further information, see AIHW 2015a.
More information is available on this topic: 'Chapter 6.14 Safety and quality in Australian hospitals'.
Figure 7.1.28: Hospitalisations involving an adverse event per 100 hospitalisations, all hospitals, 2007-08 to 2013-14
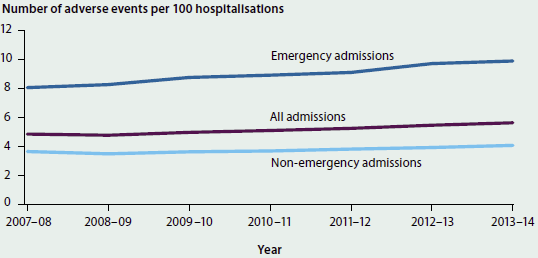
Note: The data in the National Hospital Morbidity Database are collected primarily for the purposes of recording care provided to admitted patients, and their use for purposes such as reporting adverse events has not been validated for accuracy in Australia. The results should therefore be treated with caution.
Sources: AIHW 2009, 2010, 2011, 2012a, 2013, 2014a, 2015a; National Hospital Morbidity Database.
- From 2007-08 to 2013-14, hospitalisations with adverse events increased from 4.8 to 5.6 per 100 hospitalisations. This may reflect an increase in adverse event rates, but may also reflect changing patient profiles and/or an increasing focus on the safety and quality of hospital care and good reporting of relevant data.
- In 2013-14, adverse events were more likely to be reported for overnight hospitalisations than for same-day hospitalisations (11.2 and 1.7 per 100 hospitalisations, respectively); subacute and non-acute care hospitalisations than for acute care hospitalisations (10.5 and 5.4 per 100 hospitalisations, respectively); and emergency admissions than for non-emergency admissions (9.9 and 4.1 per 100 hospitalisations, respectively).
Falls resulting in patient harm in hospitals
Definition: The number of hospitalisations in which a patient was treated for a fall that occurred in hospital. This is presented as a number, and a number per 1,000 hospitalisations.
More information is available on this topic: 'Chapter 6.14 Safety and quality of hospital care'.
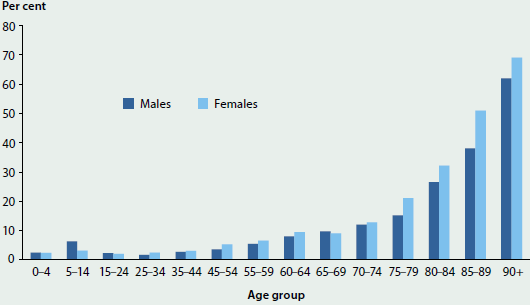
Figure 7.1.29: Falls that occurred in a hospital and that resulted in patient harm, by age, 2013-14
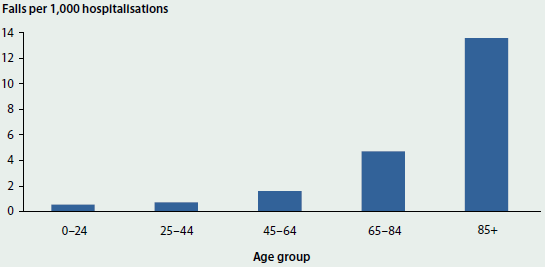
Source: National Hospital Morbidity Database, 2013-14.
- In 2013-14, there were more than 30,000 hospitalisations in which a patient was treated for injuries sustained in a fall in hospital – an overall rate of 3.1 per 1,000 hospitalisations.
- The rate of falls increased with age, with 0.6 falls per 1,000 hospitalisations for children and young people under 24, and 13.6 falls per 1,000 hospitalisations for patients aged 85 and over.
- The rate of falls has increased in recent years, up from 2.4 in 2009-10 and 3.0 in 2012-13. However, the increase in reported rates over recent years may reflect changing patient profiles and/or an increasing focus on the safety and quality of hospital care and improved reporting of relevant data rather than an increase in falls in hospitals among admitted patients. Note also that the place of occurrence was not specified for all fall-related hospitalisations (26% in 2013-14, for example), so the rates may be underestimated. Rates may also be overestimated, as some falls that occurred in health care settings other than a hospital may be included.
Proportion of people with asthma with a written asthma action plan
Definition: The proportion of people who self-report having asthma, who said they had a written asthma action plan. An asthma plan is generally prepared for patients with asthma by a health care professional and provides written instructions on how to recognise and respond to worsening asthma.
More information is available on this topic: 'Chapter 3.10 Chronic respiratory conditions'.
Figure 7.1.30: People with asthma who have a written asthma action plan, by age, 2007-08 to 2014-15
Sources: ABS 2009b, 2013a; ABS National Health Survey 2014-15 (unpublished).
- In 2014-15, an estimated 2,485,300 people (10.8%) reported having asthma as a long-term health condition (ABS 2015e). Of the people who reported asthma as a long-term condition, 28% also reported having a written asthma action plan. This is an increase from 2007-08, when the rate was 21%.
- Among people with asthma, children aged 0-14 were the most likely to have a written asthma action plan (57%) and adults aged 25-44 were the least likely to have a written plan (17%).
Proportion of people with mental illness with a GP care plan
Definition: The number of people aged 16-84 with a GP mental health treatment plan, as a percentage of the estimated number of people aged 16-84 with mental illness.
More information is available on this topic: 'Chapter 6.16 Mental health services'.
Figure 7.1.31: People with mental illness who have a GP treatment plan, 2010-11
Sources: Department of Health (unpublished); Department of Veterans' Affairs (unpublished).
- In 2010-11, 1 in 5 people (20%) with mental illness had a GP mental health treatment plan.
- People with mental illness living in Very remote areas were the least likely to have a GP mental health treatment plan (5%) and people in Inner regional areas were the most likely (21%).
- The proportion of people with mental illness who had a GP mental health treatment plan increased from 17% in 2008-09 to 20% in 2010-11.
Bulk billing for non-referred (GP) attendances
Definition: Proportion of non-referred attendances that were bulk-billed based on Medicare Benefits Scheme services. This includes GP, vocationally registered GP, enhanced primary care and other non-referred services. Presented as a percentage of total annual GP attendances per financial year.
Figure 7.1.32: Bulk-billing rate for non-referred (GP) attendances, 1990-91 to 2014-15
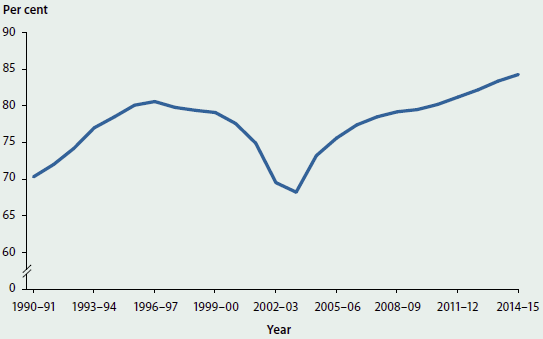
Source: Department of Health 2015.
- More than 139 million non-referred (GP) attendances were claimed through Medicare in 2014-15 and just under 117.5 million (84%) of these services were bulk-billed.
- Bulk-billing rates for non-referred (GP) attendances have changed over time, decreasing from 1996-97 to 2003-04, and increasing each year from 2003-04 to the 2014-15 high of 84%.
- Since 1990-91, the lowest bulk-billing rate was recorded in 2003-04 (68%).
Waiting time for elective surgery
Definition: The median waiting times for elective surgery in public hospitals. Data are presented as number of days.
More information is available on this topic: 'Chapter 6.10 Elective surgery'.
Figure 7.1.33: Median waiting time to admission for selected elective surgery procedures, by procedure and Indigenous status, 2014-15
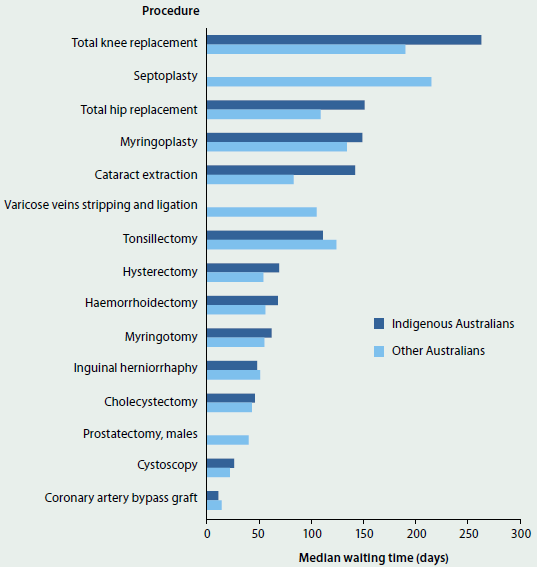
Notes
- Median waiting times for Indigenous Australians have not been published for Septoplasty, Varicose veins stripping and ligation, and Prostatectomy, due to small numbers.
- Based on data from the National Elective Surgery Waiting Times Data Collection, which covered an estimated 91% of public hospital elective surgery in 2014-15.
Source: AIHW 2015c.
- The median waiting time for elective surgery in 2014-15 was 35 days. This was a decrease since 2013-14 (36 days), but an overall increase since 2008-09 (33 days).
- In 2014-15, Coronary artery bypass graft was the procedure with the shortest median waiting time at 14 days, while the longest was for Septoplasty (surgery to straighten the cartilage and bone between the nostrils) at 214 days.
- The median waiting time in 2014-15 for Indigenous Australians (42 days) was higher than for other Australians (35 days).
Waiting time for emergency department care
Definition: Percentage of patients who were treated within national benchmarks for waiting times for each triage category in public hospital emergency departments.
The national benchmarks are:
- Resuscitation: immediate (within seconds)
- Emergency: within 10 minutes
- Urgent: within 30 minutes
- Semi-urgent: within 60 minutes
- Non-urgent: within 120 minutes.
More information is available on this topic: 'Chapter 6.11 Emergency department care'.
Figure 7.1.34: Presentations seen on time, by triage category and Indigenous status, 2014-15
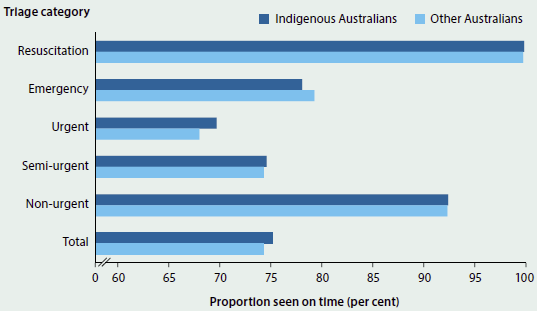
Source: AIHW National Non-admitted Patient Emergency Department Care Database.
- In 2014-15, patients in 74% of presentations were seen within the recommended time for their triage category. Despite falling slightly from the previous year (75% in 2013-14), this proportion has increased over time from 68% in 2003-04.
- The proportion of patients seen on time was similar for Indigenous Australians (75%) and other Australians (74%).
- Almost 100% of Resuscitation patients (those requiring immediate treatment) were seen within the recommended waiting time.
- The proportion of patients seen on time was highest for those living in Outer regional and Remote areas (80%), and lowest for those in Major cities (72%).
Cancer screening rates
Definition: The proportions of the target populations that participated in each of the three national cancer screening programs.
More information is available on this topic: 'Chapter 6.2 Cancer screening'.
Figure 7.1.35: Participation in the National Bowel Cancer Screening Program, by age and sex, 2013-14
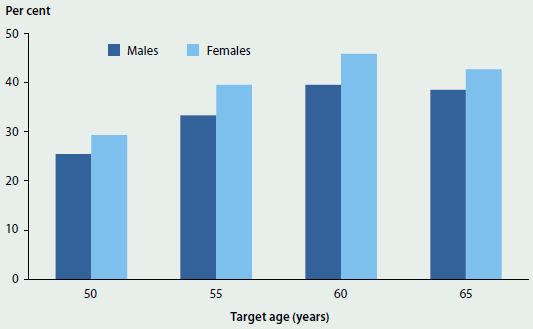
Source: National Bowel Cancer Screening Program Register as at 31 December 2014.
- In 2013-14, 36% of National Bowel Cancer Screening Program invitees aged 50, 55, 60 and 65 participated in the program. The highest rate of participation was for people aged 60 (40% of males and 46% of females), while the lowest was for people aged 50 (25% of males and 29% of females).
- The rate of women aged 50-69 participating in BreastScreen Australia for 2013 and 2014 combined was 54% – a similar rate to previous years.
- In 2013 and 2014 combined, 58% of women aged 20-69 participated in the National Cervical Screening Program. This rate has decreased since the late 1990s, but has remained relatively stable in recent years. Participation was highest for the 45-49 age group (64%) and lowest for the 20-24 age group (42%).
Differential access to hospital procedures
Definition: The number of hospitalisations involving selected procedures per 1,000 population for selected population groups. Data are presented as a number per 1,000 population (age-standardised).
The rates for the selected hospital procedures are presented as an indicator of accessibility, with an emphasis on exploring differential rates of access. In this case, rates for hospital procedures for Indigenous Australians are compared with other Australians. Similar data (for the population overall, and by a range of other variables) are routinely reported in the AIHW's Admitted patient care report series (for example, AIHW 2016). In both cases, the procedures were selected for a variety of reasons including the high frequency with which they are undertaken, because they are often elective and discretionary, and because alternative treatments are sometimes available.
More information is available on this topic: 'Chapter 6.9 Changes in the provision of hospital care'.
Figure 7.1.36: Age-standardised hospitalisation rate for selected procedures, by procedure and Indigenous status, 2013-14
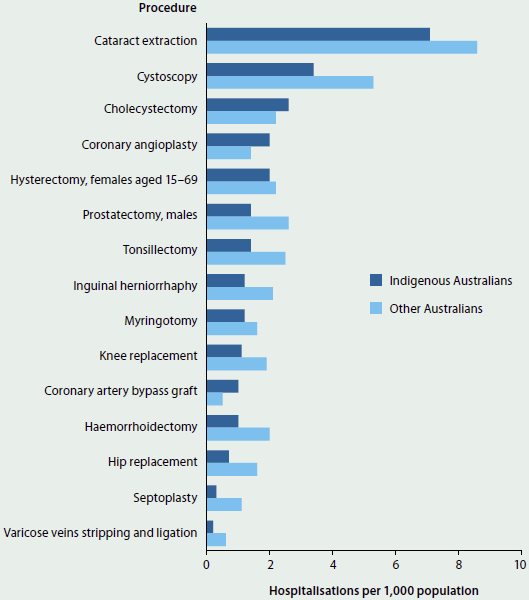
Source: AIHW 2015a.
- Indigenous Australians were more likely than other Australians to undergo Cholecystectomy, Coronary angioplasty, and Coronary artery bypass graft; other Australians were more likely to undergo all of the other selected procedures.
- The largest differences in rates for procedures occurred for Cystoscopy (where the rates for Indigenous and other Australians were 3.4 and 5.3 per 1,000 population respectively) and Cataract extraction (7.1 and 8.6 per 1,000 population respectively). These were also the most common procedures performed for both Indigenous and other Australians.
- These rates do not take account of differences between Indigenous and other Australians in the need for procedures and do not provide information on people who may require a selected procedure, but do not have the procedure.
Proportion of pregnancies with an antenatal visit in the first trimester
Definition: The proportion of pregnant females who have a birth who had at least one antenatal visit in the first 13 weeks of pregnancy. Presented as a percentage of all females who gave birth.
More information is available on this topic: 'Chapter 5.2 Trends and patterns in maternal and perinatal health'.
Figure 7.1.37: Women who gave birth, by duration of pregnancy at first antenatal visit (weeks gestation), 2010 to 2013
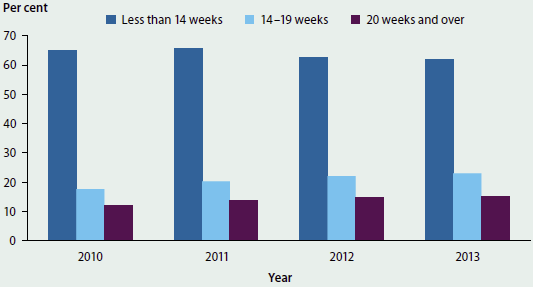
Sources: AIHW 2015b; Hilder et al. 2014; Li et al. 2012, 2013.
- Of women who gave birth in 2013, 62% attended at least one antenatal visit in the first trimester (before 14 weeks gestation). This is slightly lower than the 65% of women who attended at least one antenatal visit in the first trimester in 2010.
- For 2013, the number of women who attended their first antenatal visit at 14-19 weeks gestation and 20-and-over weeks gestation was 23% and 15%, respectively. This is a slight increase over the equivalent figures for 2010 (18% and 12% respectively).
Net growth in health workforce
Definition: The change over time in the full-time equivalent (FTE) number of people employed in selected health workforce professions.
More information is available on this topic: 'Chapter 2.3 Who is in the health workforce?'.
Figure 7.1.38: Full-time equivalent number of selected health practitioners employed, 2011 to 2014
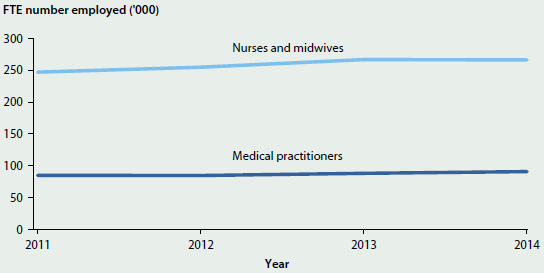
Source: AIHW National Health Workforce Data Set.
- The number of full-time equivalent medical practitioners employed rose by 6.7% from 85,200 in 2011 to 90,900 in 2014. The rate of full-time equivalent medical practitioners per population also increased, by 1.5%, from 382 to 387 per 100,000 population, during the same period.
- Also during this period, the number of full-time equivalent nurses and midwives increased by 7.7% (from 247,300 to 266,400), and the full-time rate per population by 2.4% (from 1,107 to 1,134 per 100,000 population).