
Chapter 4 Determinants of health
4.0 Introduction
Determinants of health are factors that influence how likely we are to stay healthy or to become ill or injured. This chapter examines three key determinants of health: social determinants, biomedical risk factors and behavioural risk factors.
Many of the key drivers of health reside in our everyday living and working conditions—the circumstances in which we grow, live, work and age. These social determinants include factors such as income, education, employment and social support.
Social determinants can strengthen or undermine the health of individuals and communities. For example, in general, people from poorer social or economic circumstances are at greater risk of poor health than people who are more advantaged.
A person's health is also influenced by biomedical factors and health behaviours that are part of their individual lifestyle and genetic make-up. These factors can be positive in their effects (for example, being vaccinated against disease), or negative (for example, consuming alcohol at risky levels).
Biomedical risk factors such as high blood pressure can have a direct impact on illness and chronic disease. For example, in 2014–15, 23% of Australian adults had high blood pressure, which is a risk factor for stroke, coronary heart disease, heart failure and chronic kidney disease.
Behavioural risk factors such as tobacco smoking, risky alcohol consumption, using illicit drugs, not getting enough exercise and poor eating patterns can also have a detrimental effect on health.
Although there is a lot to celebrate about Australia's changing smoking and drinking behaviours, there are still areas of concern.
Some population groups are far more likely to smoke daily than the general population—for example, smoking rates are much higher among single parents with dependent children, and Aboriginal and Torres Strait Islander people are more likely to smoke than non-Indigenous Australians.
Although the overall volume of alcohol being consumed by Australians aged 15 and over has fallen to its lowest level in 50 years, some people still drink to excess, putting them at risk of short- and long-term adverse health effects.
This chapter also looks at illicit drug use, which contributes to substantial illness, disease and many deaths in Australia. It is estimated that about 2.9 million people aged 14 and over—15% of the population—are illicit drug users. The four most commonly used illicit drugs are cannabis, ecstasy, methamphetamine and cocaine.
4.1 Social determinants of health
Our health is influenced by the choices that we make—whether we smoke, drink alcohol, are immunised, have a healthy diet or undertake regular physical activity. Health prevention and promotion, and timely and effective treatment and care, are also important contributors to good health. Less well recognised is the influence of broader social factors on health (see 'Chapter 1.1 What is health?').
Evidence on the close relationship between living and working conditions and health outcomes has led to a renewed appreciation of how human health is sensitive to the social environment. Factors such as income, education, conditions of employment, power and social support act to strengthen or undermine the health of individuals and communities. Because of their potent and underlying effects, these health-determining factors are known as the 'social determinants of health' (Wilkinson & Marmot 2003).
The World Health Organization (WHO) has described social determinants as:
...the circumstances in which people grow, live, work, and age, and the systems put in place to deal with illness. The conditions in which people live and die are, in turn, shaped by political, social, and economic forces (CSDH 2008).
According to WHO, the social conditions in which people are born, live and work is the single most important determinant of good health or ill health. As factors that affect health, social determinants can be seen as 'causes of the causes'—that is, as the foundational determinants which influence other health determinants. In keeping with this model, Figure 4.1.1 illustrates how social determinants extend inward to affect other factors, including health behaviours and biomedical factors that are part of a person's individual lifestyle and genetic make-up.
Figure 4.1.1: A framework for determinants of health
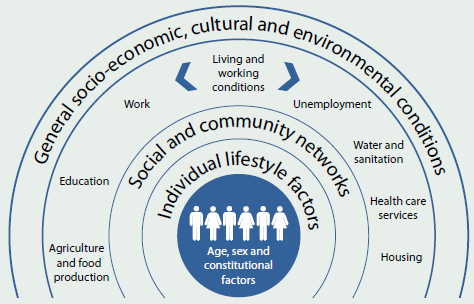
Source: Dahlgren & Whitehead 1991.
The National Health Performance Framework also recognises the importance of social determinants to our health. The framework includes community and socioeconomic factors that relate to income, health literacy and educational attainment (see 'Chapter 7.1 Indicators of Australia's health').
The health advantages and disadvantages experienced by Australians are shaped by their broader social and economic conditions (see Box 4.1.1). Inequalities in health appear in the form of a 'social gradient of health', so that in general, the higher a person's socioeconomic position, the healthier they are.
Some health inequalities are attributable to external factors and to conditions that are outside the control of the individuals concerned. Inequalities that are avoidable and unjust—health inequities—are often linked to forms of disadvantage such as poverty, discrimination and access to goods and services (Whitehead 1992).
Box 4.1.1: Ten facts about social determinants and health inequalities
- The 20% of Australians living in the lowest socioeconomic areas in 2014–15 were 1.6 times as likely as the highest 20% to have at least two chronic health conditions, such as heart disease and diabetes (ABS 2015a).
- Australians living in the lowest socioeconomic areas lived about 3 years less than those living in the highest areas in 2009–2011 (NHPA 2013).
- If all Australians had the same death rates as people living in the highest socioeconomic areas in 2009–2011, overall mortality rates would have reduced by 13%—and there would have been 54,000 fewer deaths (AIHW 2014d).
- People reporting the worst mental and physical health (those in the bottom 20%) in 2006 were twice as likely to live in a poor-quality or overcrowded dwelling (Mallett et al. 2011).
- Mothers in the lowest socioeconomic areas were 30% more likely to have a low birthweight baby than mothers in the highest socioeconomic areas in 2013 (AIHW 2015a).
- A higher proportion of people with an employment restriction due to a disability lived in the lowest socioeconomic areas (26%) than in the highest socioeconomic areas (12%) in 2012 (AIHW analysis of ABS 2012 Survey of Disability, Ageing and Carers).
- Unemployed people were 1.6 times as likely to use cannabis, 2.4 times as likely to use meth/amphetamines and 1.8 times as likely to use ecstasy as employed people in 2013 (AIHW 2014e).
- Dependent children living in the lowest socioeconomic areas in 2013 were 3.6 times as likely to be exposed to tobacco smoke inside the home as those living in the highest socioeconomic areas (7.2% compared with 2.0%) (AIHW analysis of the 2013 National Drug Strategy Household Survey).
- People in low economic resource households spend proportionally less on medical and health care than other households (3.0% and 5.1% of weekly equivalised expenditure, respectively, in 2009–10) (ABS 2012).
- People living in the lowest socioeconomic areas in 2014–15 were more than twice as likely to delay seeing—or not see—a dental professional due to cost compared with those living in the highest socioeconomic areas (28% compared with 12%) (ABS 2015b).
Key social determinants of health
The evidence gathered from the ways in which social, economic, political and cultural conditions create health inequalities has led to the identification of key social determinants of health and wellbeing (CSDH 2008; Wilkinson & Marmot 2003), including socioeconomic position, early life circumstances, social exclusion, social capital, employment and work, housing and the residential environment.
Socioeconomic position
 In general, people from poorer social or economic circumstances are at greater risk of poor health, have higher rates of illness, disability and death, and live shorter lives than those who are more advantaged (Mackenbach 2015). Generally, every step up the socioeconomic ladder is accompanied by an increase in health.
Historically, individual indicators such as education, occupation and income have been used to define socioeconomic position (Galobardes et al. 2006).
- Educational attainment is associated with better health throughout life. Education equips people to achieve stable employment, have a secure income, live in adequate housing, provide for families and cope with ill health by assisting them to make informed health care choices. An individual's education level affects not only their own health, but that of their family, particularly dependent children.
- Occupation has a strong link to position in society, and is often associated with higher education and income levels—a higher educational attainment increases the likelihood of higher-status occupations and these occupations often come with higher incomes.
- Income and wealth play important roles in socioeconomic position, and therefore in health. Besides improving socioeconomic position, a higher income allows for greater access to goods and services that provide health benefits, such as better food and housing, additional health care options, and greater choice in healthy pursuits. Loss of income through illness, disability or injury can adversely affect individual socioeconomic position and health (Galobardes et al. 2006).
Early life
 The foundations of adult health are laid in-utero and during the perinatal and early childhood periods (Lynch & Smith 2005). The different domains of early childhood development—physical, social/emotional and language/cognitive—strongly influence learning, school success, economic participation, social citizenry and health (CSDH 2008). Healthy physical development and emotional support during the first years of life provide building blocks for future social, emotional, cognitive and physical wellbeing. Children from disadvantaged backgrounds are more likely to do poorly at school, affecting adult opportunities for employment, income, health literacy and care, and contributing to intergenerational transmission of disadvantage. Investment in early childhood development has great potential to reduce health inequalities, with the benefits especially pronounced among the most vulnerable children (Heckman & Mosso 2014).
Social exclusion
 Social exclusion is a broad concept used to describe social disadvantage and lack of resources, opportunity, participation and skills (Hayes et al.2008). Social exclusion may result from unemployment, discrimination, stigmatisation and other factors. Poverty; culture and language; and prejudices based on race, religion, gender, sexual orientation, disability, refugee status or other forms of discrimination limit opportunity and participation, cause psychological damage and harm health through long-term stress and anxiety. Social exclusion can damage relationships, and increase the risk of disability, illness and social isolation. Additionally, disease and ill health can be both products of, and contribute to, social exclusion.
Social capital
 Social capital describes the benefits obtained from the links that bind and connect people within and between groups (OECD 2001). The extent of social connectedness and the degree to which individuals form close bonds with relations, friends and acquaintances has been in some cases associated with lower morbidity and increased life expectancy (Kawachi et al. 1997), although not consistently (Pearce & Smith 2003). It can provide sources of resilience against poor health through social support which is critical to physical and mental wellbeing, and through networks that help people find work, or cope with economic and material hardship.
Social infrastructure—in the form of networks, mediating groups and organisations—is also a prerequisite for 'healthy' communities (Baum & Ziersch 2003).
The degree of income inequality within societies (the disparity between high and low incomes) has also been linked to poorer social capital and to health outcomes for some, although there is little evidence of consistent associations (Lynch et al. 2004).
Employment and work
 Unemployed people have a higher risk of death and have more illness and disability than those of similar age who are employed (Mathers & Schofield 1998). The psychosocial stress caused by unemployment has a strong impact on physical and mental health and wellbeing (Dooley et al. 1996). For some, unemployment is caused by illness, but for many it is unemployment itself that causes health problems through its psychological consequences and the financial problems it brings.
Rates of unemployment are generally higher among people with no or few qualifications or skills, those with disabilities or poor mental health, people who have caring responsibilities, those in ethnic minority groups or those who are socially excluded for other reasons (AIHW 2015b).
Once employed, work is a key arena where many of the influences on health are played out. Dimensions of work—working hours, job control, demands and conditions—have an impact on physical and mental health (Barnay 2015). Participation in quality work is health-protective, instilling self-esteem and a positive sense of identity, while also providing the opportunity for social interaction and personal development (CSDH 2008).
Housing
 Safe, affordable and secure housing is associated with better health, which in turn impacts on people's participation in work, education and the community. It also affects parenting and social and familial relationships (Mallet et al. 2011). There is a gradient in the relationship between health and quality of housing: as the likelihood of living in 'precarious' (unaffordable, unsuitable or insecure) housing increases, health worsens. The relationship is also two-way, in that poor health can lead to precarious housing. Single parents and single people generally, young women and their children and older private renters are particularly vulnerable to precarious housing (AIHW 2015b; Mallet et al. 2011).
Residential environment
 The residential environment has an impact on health equity through its influence on local resources, behaviour and safety. Communities and neighbourhoods that ensure access to basic goods and services; are socially cohesive; which promote physical and psychological wellbeing; and protect the natural environment, are essential for health equity (CSDH 2008).
To that end, health-promoting modern urban environments are those with appropriate housing and transport infrastructure and a mix of land use encouraging recreation and social interaction.
Measuring socioeconomic inequalities in health
Since social determinants are often pinpointed as a key cause of health inequalities, measuring the size of the health gap between different social groups is important. This provides essential information for policies, programs and practices which seek to address social determinants in order to reduce health gaps (Harper & Lynch 2006).
A common approach to measurement is to: (i) rank the population by socioeconomic position; (ii) divide the population into groups based on this ranking; and (iii) compare each group on health indicators of interest. To rank the population by socioeconomic position, factors such as education, occupation or income level are commonly used, although many other factors, such as housing, family structure or access to resources, can also be used. These factors closely reflect social conditions, such as wealth, education, and place of residence (WHO 2013a). Similar associations between socioeconomic position and health are generally found regardless of which factor is used.
Although individual measures of socioeconomic position are included in some health data sets, area-based measures can be calculated from most collections. An example is the Australian Bureau of Statistics (ABS) composite Index of Relative Socio-economic Disadvantage (IRSD), which is frequently used to stratify the population—see Box 4.1.2 for further details.
Box 4.1.2: The Index of Relative Socio-economic Disadvantage
The IRSD is one of four indices compiled by the ABS using information collected in the Census of Population and Housing (ABS 2013). This index represents the socioeconomic conditions of Australian geographic areas by measuring aspects of disadvantage. The IRSD scores each area by summarising attributes of their populations, such as low income, low educational attainment, high unemployment, and jobs in relatively unskilled occupations. Areas can then be ranked by their IRSD score and are classified into groups based on their rank. Any number of groups may be used—five is common.
If five categories are used, then the IRSD commonly describes the population living in the 20% of areas with the greatest overall level of disadvantage as 'living in the lowest socioeconomic areas' or the 'lowest socioeconomic group. The 20% at the other end of the scale—the top fifth—is described as the 'living in the highest socioeconomic areas' or the 'highest socioeconomic group.
It is important to understand that the IRSD reflects the overall or average socioeconomic position of the population of an area; it does not show how individuals living in the same area might differ from each other in their socioeconomic position.
Often, the gap between the lowest and highest socioeconomic groups is of greatest interest. Simple differences in epidemiologic measures, such as rates and prevalences, can be used to examine this gap—and this gap can be absolute (for example, a difference in rates) or relative (for example, the ratio between two rates) (Harper et al. 2010).
Both absolute and relative measures help in understanding the differences in health status between the two groups. Absolute measures are important for decision makers, especially where goals in absolute terms have been set, since they allow a better appraisal of the size of a public health problem.
Simple measures generally use information from only two socioeconomic groups—the lowest and highest—and ignore the middle groups. More complex measures use information from all groups to measure the magnitude of socioeconomic inequalities in health (WHO 2013a).
Although complex measures include information on both the magnitude of inequality and the total population distribution of inequality, they are restricted by the types of data that can be used, and by their ease of interpretation.
The social gradient in health
There is clear evidence that health and illness are not distributed equally within the Australian population. Variations in health status generally follow a gradient, with overall health tending to improve with improvements in socioeconomic position (Kawachi et al. 2002).
One example is mortality (Figure 4.1.2). In 2009–2011, the female mortality rate was 518 deaths per 100,000 population in the lowest socioeconomic areas, compared with 503 in the second group, 472 in the third, 453 in the fourth, and 421 in the highest socioeconomic areas—with a 23% difference in mortality rates between the highest and lowest areas. For males, the effect was similar, with an even greater inequality (33%) between the highest and lowest areas (AIHW 2014d).
Figure 4.1.2: The social gradient in Australian mortality, 2009–2011
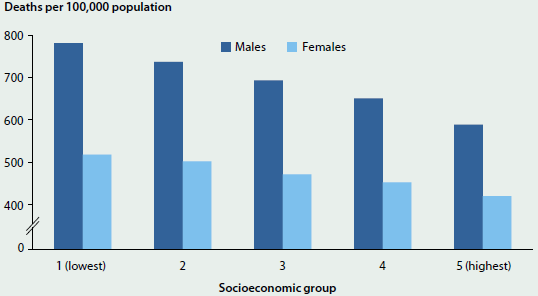
Note: Socioeconomic groups are based on the area of residence using the ABS Index of Relative Socio-economic Disadvantage.
Source: AIHW 2014d.
The gradient in mortality affects life expectancy. People living in the lowest socioeconomic areas generally have lower life expectancies (Figure 4.1.3). In 2009–2011, a baby born in a region where only 10% of the subregions were in the lowest socioeconomic group could, on average, expect to live to 83 years, whereas a baby born in a region where 70% of the subregions were in the lowest socioeconomic group could expect to live to 79 years.
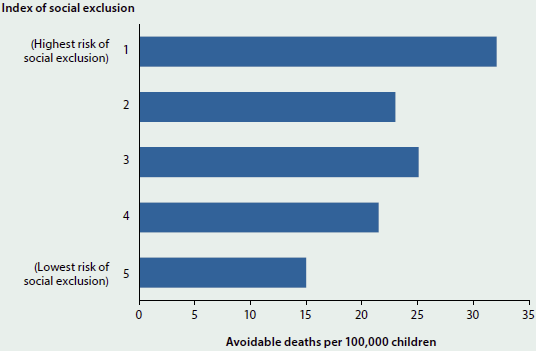
The gradient is apparent even at young ages. Figure 4.1.4 illustrates the relationship between social exclusion and health outcomes among Australian children. Children at higher risk of social exclusion—measured using an index of socioeconomic circumstances, education, connectedness, housing and health service access—had higher rates of avoidable deaths (that is, deaths which were potentially preventable or treatable within the present health system) (AIHW 2014c).
The social gradient also extends to types of health care coverage (Figure 4.1.5). People living in the lowest socioeconomic areas report much lower rates of private health insurance than those living in the highest socioeconomic areas (33% compared with 80% in 2011–12). Related to this, people living in lower socioeconomic areas were more likely to be covered by other schemes such as government health concession cards, reflecting the greater proportion receiving pensions and other income support in these areas. This pattern is not surprising, given government policy and incentives to encourage people with higher incomes to contribute more to the costs of their care, including through the purchase of private health insurance (ABS 2010).
Figure 4.1.3: Proportion of health subregions in the lowest socioeconomic group and life expectancy at birth, 2009–2011
Note: Each point represents a Medicare Local administrative health region. These consist of smaller subregions based on ABS Statistical Areas Level 1 (SA1), which were classified using the ABS Index of Relative Socio-economic Disadvantage. The line through the scatterplot is based on regression analysis which has been used to determine the best fit through the observed data.
Source: NHPA 2013, based on ABS Causes of Death and Life Tables 2009–2011.
Figure 4.1.4: Estimated rate of avoidable deaths of children aged 0–15, by index of social exclusion, 2007
Source: AIHW 2014c.
Figure 4.1.5: Coverage with private health insurance and government health concession cards, by socioeconomic group, 2011–12
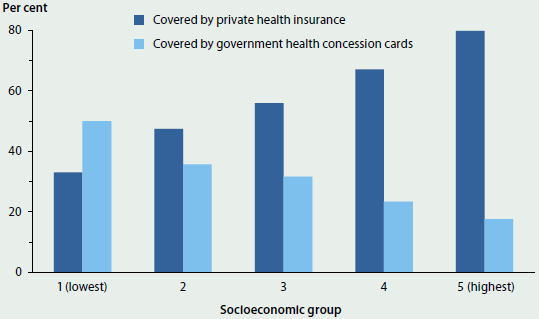
Source: AIHW analysis of ABS 2011–12 Australian Health Survey.
The social gradient in health can also be seen in differing rates for many health risk factors; in the prevalence of many chronic diseases and conditions; in the need for doctor visits; in hospitalisation; and in the use of other health care services (AIHW 2014a, 2014b, 2015c; De Vogli et al. 2007).
The gradient also exists within population groups, including among Aboriginal and Torres Strait Islander Australians (see 'Chapter 4.2 Social determinants of Indigenous health'), and minority groups such as people from non-English speaking backgrounds and refugees (Shepherd et al. 2012; Wilkinson & Marmot 2003). The social gradient effects can start from birth and persist throughout life, through adulthood and into old age, often extending to the next generation. This tends to entrench differences in health and wellbeing across the population. The gradient is a global phenomenon affecting all countries, regardless of whether they are low-, middle- or high-income countries (CSDH 2008).
Better health through action on social determinants
Action on the social determinants of health is often seen as the most appropriate way to address health inequalities, with the prospect of better health for all across the entire social gradient (CSDH 2008). One study has estimated that half a million Australians could be spared chronic illness, $2.3 billion in annual hospital costs saved, and Pharmaceutical Benefits Scheme prescriptions cut by 5.3 million, if the health gaps between the most and least disadvantaged were closed (Brown et al. 2012).
In 2008, the WHO Commission on Social Determinants of Health made recommendations on what is required to close the health gap through action on social determinants (CSDH 2008). WHO suggested that countries adopt a 'whole-of-government' approach to address the social determinants of health, with policies and interventions from all sectors and levels of society—for example, transport and housing policies at the local level; environmental, educational, and social policies at the national level; and financial, trade, and agricultural policies at the global level (WHO 2011).
The United Kingdom and the WHO Regional Office for Europe have both conducted reviews of political action required to narrow health inequalities (Marmot 2010; WHO 2013b). In Australia, a major focus has been on closing the gap in Indigenous health (see 'Chapter 5 Health of population groups').
Barriers remain, however, in adopting a social determinants approach. Despite strong evidence and an imperative to tackle health inequities, the complex nature of social determinants continues to challenge conventional policy-making and action (Baum et al. 2013; Carey et al. 2014).
What is the AIHW doing?
Socioeconomically disadvantaged people are a priority population for health monitoring. The AIHW routinely uses available measures, such as the IRSD, to assess and report the health outcomes of socioeconomic groups, and it investigates, where possible, which factors contribute to observed inequalities.
The Closing the Gap Clearinghouse at the AIHW has produced a number of reports that discuss how social determinants influence Aboriginal and Torres Strait Islander health outcomes, and how these determinants are associated with the health gap (AIHW 2015d).
The AIHW is seeking to expand its use of health and welfare data to further understand how social factors influence health.
What is missing from the picture?
Social determinants of health act through complex and multidirectional pathways. Research is focusing on better understanding the causal links between social determinants and health outcomes, and on which policies might lead to better health outcomes. Across all key determinants, evaluation of programs and interventions to identify successes in reducing inequalities is important.
Data availability and analytical constraints limit the monitoring of social determinants and the evidence needed for policy development. The extension of reporting to include variables such as ethnicity, culture and language, social support and the residential environment would provide a more robust picture of socioeconomic position. There is also scope for linking health and welfare data to provide a broader and more comprehensive understanding of the effects of social determinants. Additional longitudinal data would also enable improved monitoring of gaps and gradients in health inequalities.
Where do I go for more information?
Many AIHW reports include analysis of health indicators based on socioeconomic position, for example, Mortality inequalities in Australia 2009–2011.
For more information about disadvantage and social inequalities, see the AIHW report Australia's welfare 2015.
The World Health Organization has a leading role in supporting countries to take action on the social determinants of health to address health inequities.
References
ABS (Australian Bureau of Statistics) 2010. Australian social trends, March 2010. ABS cat. no. 4102.0. Canberra: ABS.
ABS 2012. Australian social trends, March quarter 2012. ABS cat. no. 4102.0. Canberra: ABS.
ABS 2013. Socio-Economic Indexes for Areas (SEIFA), 2011. ABS cat. no. 2033.0.55.001. Canberra: ABS.
ABS 2015a. National Health Survey, first results 2014–15. ABS cat. no. 4364.0.55.001. Canberra: ABS.
ABS 2015b. Patient experiences in Australia: summary of findings, 2014–15. ABS cat. no. 4839.0. Canberra: ABS.
AIHW (Australian Institute of Health and Welfare) 2014a. Cardiovascular disease, diabetes and chronic kidney disease: Australian facts: morbidity—hospital care. Cardiovascular, diabetes and chronic kidney disease series no. 3. Cat. no. CDK 3. Canberra: AIHW.
AIHW 2014b. Cardiovascular disease, diabetes and chronic kidney disease: Australian facts: prevalence and incidence. Cardiovascular, diabetes and chronic kidney disease series no. 2. Cat. no. CDK 2. Canberra: AIHW.
AIHW 2014c. Child social exclusion and health outcomes: a study of small areas across Australia. AIHW bulletin no. 121. Cat. no. AUS 180. Canberra: AIHW.
AIHW 2014d. Mortality inequalities in Australia 2009–2011. AIHW bulletin no. 124. Cat. no. AUS 184. Canberra: AIHW.
AIHW 2014e. National Drug Strategy Household Survey detailed report: 2013. Drug statistics series no. 28. Cat. no. PHE 183. Canberra: AIHW.
AIHW 2015a. Australia's mothers and babies 2013—in brief. Perinatal statistics series no. 31. Cat no. PER 72. Canberra: AIHW.
AIHW 2015b. Australia's welfare 2015. Cat. no. AUS 189. Canberra: AIHW.
AIHW 2015c. Cardiovascular disease, diabetes and chronic kidney disease—Australian facts: risk factors. Cardiovascular, diabetes and chronic kidney disease series no. 4. Cat. no. CDK 004. Canberra: AIHW.
AIHW 2015d. Closing the gap clearinghouse. Canberra: AIHW. Viewed 14 December 2015.
Barnay T 2015. Health, work and working conditions: a review of the European economic literature. European Journal of Health Economics, DOI:10.1007/s10198-015-0715-8.
Baum FE & Ziersch AM 2003. Social capital. Journal of Epidemiology and Community Health 57:320–23.
Baum FE, Laris P, Fisher M, Newman L & MacDougall C 2013. 'Never mind the logic, give me the numbers': former Australian health ministers' perspectives on the social determinants of health. Social Science & Medicine 87:138–46.
Brown L, Thurecht L & Nepal B 2012. The cost of inaction on the social determinants of health. Report No. 2/2012: CHA-NATSEM second report on health inequalities. Canberra: National Centre for Social and Economic Modelling.
Carey G, Crammond B & Keast R 2014. Creating change in government to address the social determinants of health: how can efforts be improved? BMC Public Health 14:1087.
CSDH (Commission on Social Determinants of Health) 2008. Closing the gap in a generation: health equity through action on the social determinants of health. Final report of the Commission on Social Determinants of Health. Geneva: WHO.
Dahlgren G & Whitehead M 1991. Policies and strategies to promote social equity in health. Background document to WHO—strategy paper for Europe. Stockholm, Sweden: Institute for Future Studies.
De Vogli R, Gimeno D, Martini G & Conforti D 2007. The pervasiveness of the socioeconomic gradient of health. European Journal of Epidemiology 22:143–44.
Dooley D, Fielding J & Levi L 1996. Health and unemployment. Annual Review of Public Health 17:449–65.
Galobardes B, Shaw M, Lawlor DA, Lynch JW & Smith GD 2006. Indicators of socioeconomic position. Journal of Epidemiology and Community Health 60(1):7–12 and 60(2):95–101.
Harper S, King NB, Meersman SC, Reichman ME, Breen N & Lynch J 2010. Implicit value judgements in the measurement of health inequalities. Milbank Quarterly 88(1):4–29.
Harper S & Lynch J 2006. Measuring health inequalities. In: Oakes JM & Kaufman JS (eds). Methods in social epidemiology. San Francisco: Jossey-Bass.
Hayes A, Gray M & Edwards B 2008. Social inclusion—origin, concepts and key themes. Canberra: Australian Institute of Family Studies.
Heckman JJ & Mosso S 2014. The economics of human development and social mobility. Annual Review of Economics, Annual Reviews 6(1):689–733.
Kawachi I, Kennedy BP, Lochner K & Prowther-Stith D 1997. Social capital, income equality and mortality. American Journal of Public Health 87(9):1491–98.
Kawachi I, Subramanian SV & Almeida-Filho N 2002. A glossary for health inequalities. Journal of Epidemiology and Community Health 56:647–52.
Lynch J, Smith GD, Harper S, Hillemeier M, Ross N & Kaplan GA et al. 2004. Is income inequality a determinant of population health? Part 1. A systematic review. Milbank Quarterly 82(1):5–99.
Lynch J & Smith GD 2005. A life course approach to chronic disease epidemiology. Annual Review of Public Health 26:1–35.
Mackenbach JP 2015. Socioeconomic inequalities in health in high-income countries: the facts and the options. In: Oxford textbook of global public health. Vol. 1. 6th edition. Oxford: Oxford University Press.
Mallett S, Bentley R, Baker E, Mason K, Keys D & Kolar V et al. 2011. Precarious housing and health inequalities: what are the links? Melbourne: Hanover Welfare Services, University of Melbourne, Melbourne City Mission and Adelaide: University of Adelaide.
Marmot M 2010. Strategic review of health inequalities in England post-2010. Marmot review final report. London: University College London.
Mathers CD & Schofield DJ 1998. The health consequences of unemployment: the evidence. Medical Journal of Australia 168(4):178–82.
NHPA (National Health Performance Authority) 2013. Healthy communities: avoidable deaths and life expectancies in 2009–2011. Sydney: NHPA.
OECD (Organisation for Economic Co-operation and Development) 2001. The wellbeing of nations: the role of human and social capital, education and skills. Paris: OECD Centre for Educational Research and Innovation.
Pearce N & Smith DG 2003. Is social capital the key to inequalities in health? American Journal of Public Health 93(1):122–29.
Shepherd CCJ, Li J & Zubrick SR 2012. Social gradients in the health of Indigenous Australians. American Journal of Public Health 102(1):107–17.
Whitehead M 1992. The concepts and principles of equity and health. International Journal of Health Services 22(3):429–45.
WHO (World Health Organization) 2011. Closing the gap: policy into practice on social determinants of health: discussion paper. Geneva: WHO.
WHO 2013a. Handbook on health inequality monitoring with a special focus on low- and middle-income countries. Geneva: WHO.
WHO 2013b. Review of social determinants and the health divide in the WHO European Region. Copenhagen: WHO.
Wilkinson R & Marmot M (eds) 2003. Social determinants of health. The solid facts, 2nd edition. Copenhagen: WHO.
4.2 Social determinants of Indigenous health
The social determinants of health refer to the close relationship between health outcomes and the living and working conditions that define the social environment. The previous article ('4.1 Social determinants of health') reviewed a wide range of social factors that influence health. One particular well-documented aspect of this relationship is the special role played by income and other related indicators of material affluence and socioeconomic position, such as education and occupation. That is the focus of this snapshot in the context of Indigenous health outcomes.
The social determinants of health related to socioeconomic position help to explain both the gaps in the average health status of Indigenous and non-Indigenous Australians, and also the wide variation observed in the health outcomes within the Indigenous population.
People with higher incomes live longer and have better health, on average, than do people with lower incomes. This relationship is a key component of the overall socioeconomic 'gradient' in health status (the strong association between health outcomes and socioeconomic position), and is regularly observed across countries and within the population subgroups of a country (CSDH 2008). This strong link occurs not just with higher levels of income but with a wide range of characteristics that denote a person's socioeconomic position, including educational attainment, employment and occupation. The higher the socioeconomic position, the better the health status on average. The gradient is not limited just to comparisons between the lowest and highest parts of the socioeconomic distribution, but is evident across the whole distribution (Case et al. 2002).
Contribution of social determinants to the Indigenous health gap
Previous studies have shown the importance of social determinants in understanding and addressing the health gap between Aboriginal and Torres Strait Islander Australians and non-Indigenous Australians (Booth & Carroll 2008; DSI Consulting 2009; Marmot 2011; Zhao et al. 2013). This was also confirmed by AIHW analyses on 'The size and causes of the Indigenous health gap' published in Australia's health 2014 (AIHW 2014). These studies found that between one-third and one-half of the health gaps between Indigenous and non-Indigenous Australians are associated with differences in socioeconomic position (AHMAC 2015).
Socioeconomic position and self-assessed health within the Indigenous population
Differences in social determinants can also explain a large part of the differences in health status within the Indigenous population. Indigenous Australians who are in the lowest income group, have a lower level of educational attainment or who are unemployed, are less likely to be in 'excellent' or 'very good' health (based on self-reported survey data) than those in the higher income groups, those with high educational attainment, or those who are employed (Figure 4.2.1).
Figure 4.2.1: Indigenous Australians reporting 'excellent' or 'very good' self-assessed health status, by selected socioeconomic factors, 2012–13
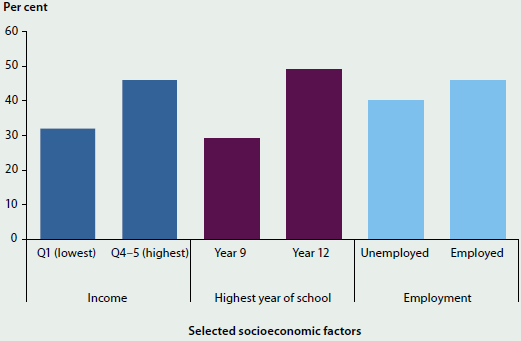
Note: Q1–Q5 refer to income quintiles.
Source: AHMAC 2015.
Socioeconomic position and behavioural risk factors
The socioeconomic gradient in health status also occurs because rates of risky health behaviours are usually higher among individuals in low socioeconomic positions. One example of this relationship is the difference in behavioural risk factors associated with employment status. Indigenous Australians who are unemployed face a higher risk of poor health through higher rates of smoking, substance use and dietary behaviour (such as lower level of daily fruit consumption) compared with Indigenous Australians who are employed (Figure 4.2.2). A counter-example of a risk factor that has a higher prevalence among employed Indigenous adults is being overweight or obese.
Socioeconomic gradient has an early start
The socioeconomic gradient in health starts early. Children in households with higher income have better health from an early age, and in many countries this relationship becomes more pronounced as children get older (Case et al. 2002).
There is limited direct evidence specifically for Indigenous children in Australia on the origins and trajectories of the gradient in health; but one proxy indicator—low birthweight—highlights the early start to socioeconomic disadvantage in health for many Indigenous children.
Figure 4.2.2: Selected risk factors, by employment status, Indigenous Australian adults, 2012–13
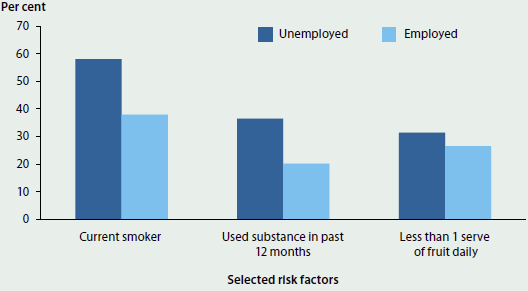
Source: AIHW 2015a.
AIHW analyses of the National Perinatal Data Collection show that:
- in 2013, babies born to Indigenous mothers were twice as likely to be of low birthweight as babies born to non-Indigenous mothers (12.2% compared with 6.1%) (see 'Chapter 5.2 Trends and patterns in maternal and perinatal health')
- the proportion of low birthweight babies born to Indigenous mothers in 2013 was higher in Very remote areas (14% in 2013) than in non-remote areas (12%)
- the proportion of low birthweight babies born to non-Indigenous mothers does not increase with remoteness as it does for Indigenous mothers, suggesting that greater social disadvantage of Indigenous families in remote areas could be an important factor behind the higher proportion of Indigenous low birthweight babies in remote areas
- the overall proportion of low birthweight babies born to Indigenous mothers fell slightly, from 12.7% in 2000 to 12.2%, in 2013 (AIHW 2015a, 2015b).
What is missing from the picture?
The relationship between health status and its social determinants can be complex. Social determinants can also influence other determinants of health, such as health behaviours and access to health services. More detailed longitudinal analysis is required. Previous analyses mainly sought to explain the health gaps between Indigenous and non-Indigenous Australians. Less is known about the role of socioeconomic factors in explaining differences in the health status among Indigenous Australians, including the health status of specific subgroups, such as Indigenous Australians with a disability.
Where do I go for more information?
More information on the social determinants of Indigenous health in Australia and other related health issues is available at Closing the gap.
The report Australia's mothers and babies 2013 has more detailed data on low birthweight babies and other outcomes for Indigenous and non-Indigenous babies.
References
AHMAC (Australian Health Ministers' Advisory Council) 2015. Aboriginal and Torres Strait Islander Health Performance Framework: 2014 report. Canberra: AHMAC.
AIHW (Australian Institute of Health and Welfare) 2014. Australia's health 2014. Australia's health series no. 14. Cat. no. AUS 178. Canberra: AIHW.
AIHW 2015a. Aboriginal and Torres Strait Islander Health Performance Framework 2014 report: detailed analyses. Cat. no. IHW 167. Canberra: AIHW.
AIHW 2015b. Australia's mothers and babies 2013—in brief. Perinatal statistics series no. 31. Cat. no. PER 72. Canberra: AIHW.
Booth AL & Carroll N 2008. Economic status and the Indigenous/non-Indigenous health gap. Economic Letters 99(3):604–06.
Case A, Lubotsky D & Paxson C 2002. Economic status and health in childhood: the origins of the gradient. The American Economic Review 92(5):1308–44.
CSDH (Commission on Social Determinants of Health) 2008. Closing the gap in a generation: health equity through action on the social determinants of health: final report of the Commission on Social Determinants of Health. Geneva: WHO.
DSI Consulting Pty Ltd & Benham D 2009. An investigation of the effect of socio-economic factors on the Indigenous life expectancy gap. Canberra: DSI Consulting Pty Ltd.
Marmot, M 2011. Social determinants and the health of Indigenous Australians. Medical Journal of Australia 194(10):512–513.
Zhao Y, Wright J, Begg S & Guthridge S 2013. Decomposing Indigenous life expectancy gap by risk factors: a life table analysis. Population Health Metrics 11:1–9.
4.3 Biomedical risk factors
Biomedical risk factors are bodily states that can contribute to the development of chronic disease. Abnormal levels of the three biomedical factors in this snapshot—blood pressure, blood lipids and blood glucose—pose direct and specific risks to health.
Biomedical risk factors may also be influenced by behavioural risk factors. For example, a high blood cholesterol level (biomedical) may be the result of a diet high in saturated fats (behavioural). The effects of individual biomedical risk factors on a person's health can also be amplified when other behavioural or biomedical risk factors are present. The longer a person lives with one or more risk factors, the greater the risk to their overall health and wellbeing.
The latest risk factor results have been sourced from the Australian Bureau of Statistics (ABS) 2014–15 National Health Survey and the biomedical component of the ABS 2011–12 Australian Health Survey (ABS 2013, 2015).
High blood pressure
Blood pressure is the force exerted by blood on the wall of the arteries. High blood pressure—also known as hypertension—is a risk factor for chronic diseases including stroke, coronary heart disease, heart failure and chronic kidney disease (see 'Chapter 3 Leading causes of ill health').
Poor diet (especially high salt intake), overweight and obesity, excessive alcohol consumption and physical inactivity can all contribute to high blood pressure. People with high blood pressure may be able to control their condition with lifestyle changes that reduce these risk factors, or they may require medication.
In 2014–15, 23% of adults, or 4.1 million people, had measured high blood pressure, excluding those taking medication.

- High blood pressure was more common in men (24%) than in women (22%)—except among people aged 75 and over (51% in women and 42% in men).
- The proportion with high blood pressure increased with age, from 6% for people aged 18–24 years to 47% for people aged 75 and over.
- In 2011–12, 11% of adults, or 1.5 million people, managed their high blood pressure through medications.
Note: High blood pressure is defined as systolic/diastolic blood pressure equal to or greater than 140/90 mmHg. The usual definition for the proportion of the population with high blood pressure generally includes people on blood pressure medication. These data were not available from the ABS 2014–15 National Health Survey for inclusion in this report.
The prevalence of high blood pressure is even greater among people with specific conditions. For example, in 2011–12, 77% of people with diabetes and 59% of people with chronic kidney disease had high blood pressure.
Dyslipidaemia
Dyslipidaemia—abnormal levels of blood lipids such as cholesterol and triglycerides—can contribute to the development of atherosclerosis, a build-up of fatty deposits in the blood vessels that may lead to the development of cardiovascular disease. Dyslipidaemia is a risk factor for chronic diseases such as coronary heart disease and stroke. People with dyslipidaemia are encouraged to adopt a healthy lifestyle through a balanced diet and sufficient physical activity, and may also be treated using lipid-modifying medications such as statins.

In 2011–12, 63% of adults or 8.5 million Australians had dyslipidaemia. Of these:
- 33% had high total cholesterol
- 33% had high LDL 'bad' cholesterol
- 23% had low HDL 'good' cholesterol.
Dyslipidaemia increased with age, to a peak of 81% in people aged 65–74 and then declined. Eighty-nine per cent of people with measured dyslipidaemia (7.6 million people) were not using lipid-modifying medication.
Note: Dyslipidaemia is defined as having either total cholesterol > 5.5 mmol/L, LDL cholesterol > 3.5 mmol/L, HDL cholesterol < 1.0 mmol/L for men and < 1.3 mmol/L for women, triglycerides > 2.0 mmol/L, or taking lipid-modifying medication.
The prevalence of dyslipidaemia is even greater among those with specific conditions. In 2011–12, 86% of people with diabetes and 78% of people with cardiovascular disease had dyslipidaemia.
Impaired glucose regulation
Impaired glucose regulation is a characteristic of pre-diabetes, a condition in which blood glucose levels are higher than normal, although not high enough to be diagnosed with type 2 diabetes. Impaired fasting glucose (IFG)—the presence of higher than usual levels of glucose in the blood after fasting—is one of two measures that are used to define impaired glucose regulation, the other being impaired glucose tolerance (IGT).
People who have IFG and IGT are at risk for the future development of diabetes and cardiovascular disease (see 'Chapter 3.7 Diabetes' and 'Chapter 3.5 Coronary heart disease'). Lifestyle changes incorporating increased physical activity and healthy eating can slow the progression of IFG to diabetes.

In 2011–12, 3.1% of adults or 416,000 Australians had IFG.
- IFG was more common in men (4.1%) than women (2.1%).
- IFG increased with age, to 7.5% in people aged 75 and over.
Note: Impaired fasting glucose is defined as a fasting plasma glucose level ranging from 6.1 mmol/L to less than 7.0 mmol/L.
The prevalence of IFG is even greater among those with specific conditions. In 2011–12, 5.9% of people with cardiovascular disease and 4.6% of people with chronic kidney disease had IFG.
What is missing from the picture?
There is limited national data to measure progress and monitor trends in some biomedical risk factors. Future collections measuring dyslipidaemia and impaired glucose regulation will be needed to provide updated data on these risk factors and to determine trends in the Australian population.
Where do I go for more information?
More information on these biomedical risk factors is available on the AIHW website at Risk factors to health.
The report Cardiovascular disease, diabetes and chronic kidney disease—Australian facts: risk factors and other recent publications can be downloaded for free.
References
ABS (Australian Bureau of Statistics) 2013. Australian Health Survey: biomedical results for chronic diseases, 2011–12. ABS cat. no. 4364.0.55.005. Canberra: ABS.
ABS 2015. National Health Survey: first results, Australia, 2014–15. ABS cat. no. 4364.0.55.001. Canberra: ABS.
4.4 Overweight and obesity
Overweight and obesity refers to abnormal or excessive fat accumulation which presents health risks. It generally arises from a sustained energy imbalance when energy intake through eating and drinking exceeds energy expended through physical activity.
Being overweight or obese increases the risk of chronic diseases such as cardiovascular disease (including heart disease and stroke), type 2 diabetes, musculoskeletal conditions, some cancers and mental health conditions. Mortality risk also increases progressively as weight increases, with being obese presenting greater health risks than being overweight. Weight loss can help reduce the incidence and severity of many chronic conditions.
Who is overweight or obese?
- In 2014–15, an estimated 11.2 million adults (63%) were overweight or obese—6.3 million (35%) were overweight and 4.9 million (28%) were obese. One in 4 children aged 5–17 (27%, or 1 million) were overweight or obese (ABS 2015).
- Overweight and obesity was greater among men (71%) than women (56%), and increased with age from 39% of people aged 18–24 to 74% for those aged 65–74.
- Adults living in the lowest socioeconomic areas were more likely to be overweight or obese than those in the highest socioeconomic areas (66% compared with 58%).
- Overweight and obesity was more common among Indigenous adults, especially rates of obesity (43% compared with 27% for non-Indigenous adults in 2011–13).
Trends in overweight and obesity
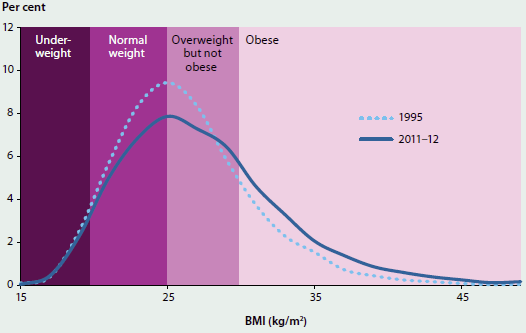
- The proportion of overweight or obese adults increased from 56% to 63% between 1995 and 2014–15. Average weights increased by 4.4kg for both men and women.
- There has been a shift in the distribution of body mass index (BMI), with fewer people in the 'normal' or 'overweight' category and more people in the 'obese' category (Figure 4.4.1).
Factors influencing overweight and obesity
The main factors influencing overweight and obesity are poor diet and inadequate physical activity. As well as being important components in weight management, a healthy diet and regular physical activity also assist in preventing chronic diseases such as heart disease, stroke, type 2 diabetes and colorectal cancer.
Figure 4.4.1: Distribution of body mass index, people aged 18 and over, 1995 and 2011–12
Minimal consumption of discretionary foods—foods and drinks not necessary to provide the nutrients the body needs, and often high in saturated fats, sugars, salt and/or alcohol—and sufficient consumption of fruit and vegetables (recommended intake of 2 and 5–6 serves per day, respectively) are good indicators of a healthy diet (NHRMC 2013).
- In 2014–15, 93% of adults did not eat five serves of vegetables, and 50% did not eat two serves of fruit per day (ABS 2015).
- Discretionary foods contributed 35% of energy intake for adults, and 39% for children and young people aged 2–18 in 2011–12 (ABS 2014).
For adults aged 18–64, the recommended minimum level of activity for health benefits is 150 minutes of moderate intensity physical activity or 75 minutes of vigorous intensity physical activity, or an equivalent combination of both, each week (Department of Health 2014).
- Almost half of adults aged 18–64 (45%) were inactive or insufficiently active for health benefits in 2014–15, with rates higher among women (47%) than men (42%) (ABS 2015).
- The proportion of the population inactive or insufficiently active increased with age in 2014–15, from 40% for those aged 18–24 to 59% for those aged 65 and over.
- Among children and young people aged 5–17 years in 2011–12, 80% did not meet physical activity recommendations on all 7 days of the week. Rates increased from 64% for those aged 5–8 to 94% for those aged 15–17 (ABS 2013).
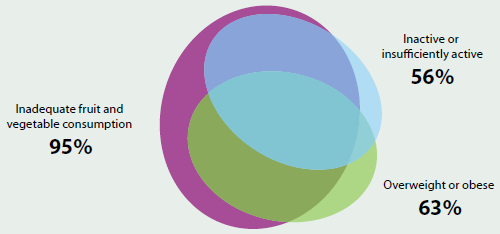
The combination of overweight or obesity, poor dietary intake and/or insufficient physical activity further increases the risk of chronic disease. In 2011–12, most adults who were overweight or obese were also inactive or insufficiently active, and/or had inadequate fruit and vegetable consumption (Figure 4.4.2). Almost one-third (31%) of adults had all three risk factors. This increased to over half (54%) for those with diabetes and 42% for those with cardiovascular disease.
Figure 4.4.2: Graphical representation of the overlap between selected risk factors for chronic disease, people aged 18 and over, 2011–12
What is missing from the picture?
Better data are needed to monitor trends in overweight and obesity among particular groups over time, especially children. Longitudinal research into factors associated with overweight and obesity, such as changing patterns of health, nutritional status, vulnerable populations and education could provide further public health benefits for Australians.
Regular data on food, nutrition and physical activity will inform policy development and resource investment, and assist in evaluation and monitoring. Some data used to report on these aspects are self-reported and may be prone to under-reporting; exploring ways to obtain additional measured data could eliminate some of this bias.
Where do I go for more information?
For more information on overweight and obesity, nutrition and physical activity, refer to Overweight and obesity and Food and nutrition. The following reports are available for free download: Cardiovascular disease, diabetes and chronic kidney disease—Australian facts: risk factors; Risk factors contributing to chronic disease and Australia's food and nutrition 2012.
References
ABS (Australian Bureau of Statistics) 2013. Australian Health Survey: physical activity, 2011–12. Cat. no. 4364.0.55.004. Canberra: ABS.
ABS 2014. Australian Health Survey: nutrition first results—foods and nutrients, 2011–12. Cat. no. 4364.0.55.007. Canberra: ABS.
ABS 2015. National Health Survey: first results, 2014–15. Cat. no. 4364.0.55.001. Canberra: ABS.
Department of Health 2014. Australia's physical activity and sedentary behaviour guidelines. Canberra: Department of Health.
NHMRC (National Health and Medical Research Council) 2013. Australian dietary guidelines. Canberra: NHMRC.
4.5 Illicit drug use
Introduction
Drug use is a serious and complex issue, which contributes to substantial illness, disease and injury, many deaths, social and family disruptions, workplace concerns, violence and to crime and community safety issues (MCDS 2011). The misuse of licit and use of illicit drugs is widely recognised in Australia as a major health problem, and one with wider social and economic costs (Collins & Lapsley 2008). While illicit drug use is a significant issue in the context of Australia's health, tobacco continues to cause more ill health and premature death than any other drug, and alcohol-related hospital separations are higher than those related to illicit drugs (including heroin, cannabis, methamphetamine and cocaine) (Roxburgh and Burns 2013).
Illicit drug use contributed to 1.8% of the total burden of disease and injury in Australia in 2011. This included the impact of injecting drug use and cocaine, opioid, amphetamine and cannabis dependence. Globally, illicit drug use contributed 0.8% of the total burden of disease in 2010 and has increased since 1990—moving from the 18th to 15th ranking risk factor (IHME 2014). It is estimated that illicit drug use costs the Australian economy $8.2 billion annually through crime, productivity losses and health care costs (Collins & Lapsley 2008).
Illicit drug use is associated with many risks of harm to the user and to their family and friends. It has both short-term and long-term health effects, which can be severe, including poisoning, heart damage, mental illness, self-harm, suicide and death (NRHA 2015).
The first part of this article profiles illicit drug use and looks at the four most commonly used illegal drugs. As there is currently a substantial community and policy interest in the use and effects of 'ice', (see Box 4.5.1) the second part of this article focuses in more detail on methamphetamine and explores recent trends in availability, use and treatment, and highlights the current evidence about this drug.
What do we know about the prevalence of illicit drug use?
According to the 2013 National Drug Strategy Household Survey (NDSHS), around 2.9 million people in Australia aged 14 and over were estimated to have used illicit drugs in the previous 12 months, and 8 million were estimated to have done so in their lifetime (AIHW 2014b). Both nationally and internationally, the proportion of people using illicit drugs has remained relatively stable over the last 10 years—around 15% of adults in Australia, and around 5% of the global adult population (AIHW 2014a; UNODC 2015).
However, over time, changes occur in the use of specific drugs, in the forms of drugs used and in the way drugs are taken. In Australia, changes in the use of methamphetamine have been one area of increasing concern among the community (see Box 4.5.1).
Box 4.5.1: Strategies, legislation and other activities
Since 1985, the National Drug Strategy (NDS) has provided an overarching framework for a consistent and coordinated approach to addressing licit and illicit drug use in Australia. The NDS is guided by the principle of harm minimisation. Harm minimisation encompasses three components (pillars): demand reduction, supply reduction and harm reduction. The aim of the NDS is to prevent the uptake and misuse of drugs and to reduce the production and supply of illicit drugs and the negative social, economic and health consequences of drug use. The NDS also continues to support and develop essential partnerships between the law enforcement, health and non-government sectors, communities, and all levels of government (MCDS 2011).
Research undertaken by the Drug Policy Modelling Program revealed that Australian governments spent approximately $1.7 billion in 2009–10 on illicit drug programs and estimated that 64% was spent on law enforcement, 22% on treatment, 9.7% on prevention and 2.2% on harm reduction (Ritter et al. 2013).
The NDS recognises illicit drug use as a health and social issue, while acknowledging the role of law enforcement in detecting and deterring drug-related crime. Legislative and regulatory provisions relating to illicit drugs, precursor chemicals and proceeds of crime exist at the national level (for example, border protection and compliance), but most action (including expenditure) in relation to illicit drugs rests with the states and territories (Ritter et al. 2013).
Many national initiatives are implemented under the NDS, including the National Drugs Campaign. This is a media campaign aimed at reducing illicit drug use among young Australians, by increasing their knowledge of the negative consequences of drug use. The campaign has been running since 2001 and the focus varies, depending on trends in drug use and emerging drugs. The most recent campaign focused on crystal methamphetamine (Department of Health 2015).
The National Ice Taskforce
The Australian Government established a National Ice Taskforce in April 2015 and released its final report in December 2015. The Government will provide almost $300 million over 4 years from 1 July 2016 to improve treatment, education, prevention, support and community engagement, and to capture better data to identify emerging trends on illicit drug use (PM&C 2015). The Final Report of the National Ice Taskforce made 38 recommendations across five key areas:
- support families, communities and frontline workers
- target prevention
- tailor services and support
- strengthen law enforcement
- improve governance and build better data (PM&C 2015).
Illicit drug use and trends
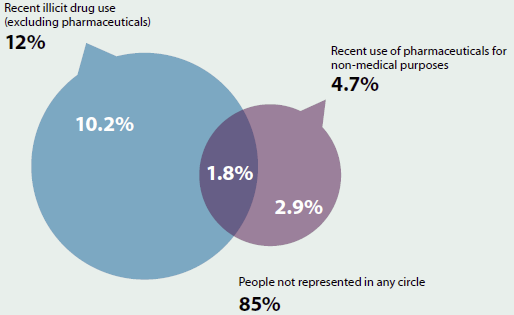
Among the 15% of people aged 14 and over in Australia who are illicit drug users (see Box 4.5.2 for a definition of illicit drug use), 4 in 5 reported using illegal drugs such as cannabis and cocaine, or other substances such as inhalants (Figure 4.5.1). The remaining 1 in 5 reported misuse of a pharmaceutical drug (without use of any other illicit drug) (AIHW 2014b).
Box 4.5.2: Definition of illicit drug use
'Illicit drug use' can encompass a broad range of substances including:
- illegal drugs—drugs that are prohibited from manufacture, sale or possession in Australia (for example, cannabis, cocaine, heroin and amphetamine-type stimulants)
- pharmaceuticals—drugs that are available from a pharmacy, over the counter or by prescription, which may be subject to misuse (when used for purposes, or in quantities, other than medical purposes for which they were prescribed)—for example, opioid-based pain relief medications, opioid substitution therapies, benzodiazepines, over-the-counter codeine and steroids
- other psychoactive substances—legal or illegal, potentially used in a harmful way—for example, kava, synthetic cannabis and other synthetic drugs, or inhalants such as petrol, paint or glue (MCDS 2011).
Each data collection cited in this article uses a slightly different definition of illicit drug use; please refer to the relevant report for additional information.
Figure 4.5.1: Relationship between recent illicit drug use and pharmaceutical use, people aged 14 and over, 2013
Notes
- Components may not sum to totals due to rounding.
- Illicit use of at least 1 of 17 drugs.
Source: AIHW 2014b.
According to the 2013 NDSHS, there was no change in the overall use of any illicit drug between 2010 and 2013 (15% of people reporting they had used at least 1 of 17 illicit drugs). However, there were significant changes for a few specific drugs. There were falls in the reported use of ecstasy (from 3.0% to 2.5%), heroin (from 0.2% to 0.1%) and gamma hydroxybutyrate (GHB). Longer-term trends, since 2001, show that use of cannabis, ecstasy and methamphetamine have all declined, but use of cocaine and misuse of pharmaceuticals have increased (AIHW 2014b). Although methamphetamine use has declined over the last 12 years, and remained stable between 2010 and 2013, there was change in the main form used, with ice replacing powder (discussed in further detail in the 'Methamphetamine use, availability and treatment' section).
This section focuses on key findings from the 2013 NDSHS for the four most commonly used illegal drugs—cannabis (10%), ecstasy (2.5%), methamphetamine (2.1%) and cocaine (2.1%). Box 4.5.3 then highlights the increasing misuse of pharmaceuticals, which is an important and emerging issue in relation to illicit drug use in Australia.
Cannabis
According to the 2013 NDSHS, an estimated 6.6 million (or 35%) people aged 14 and over older had used cannabis in their lifetime and about 1.9 million (or 10%) had used cannabis in the previous 12 months. About 1 in 20 Australians (5.3%) had used it in the month prior to the survey and 3.5% had used it in the previous week.
About one-third (32%) of recent cannabis users used the drug as often as weekly, and older people (50 and over) were more likely than younger people to use cannabis regularly, with at least 4 in 10 recent users in these age groups using it as often as once a week or more. Among people aged 14–24, the average age for first cannabis use increased between 2001 and 2013 (from 15.5 to 16.7 years).
Ecstasy
In 2013, ecstasy was the second most commonly used illicit drug in a person's lifetime, with 2.1 million (10.9%) people aged 14 and over reporting having ever used the drug and 500,000 having done so in the past 12 months, representing 2.5% of the population. Ecstasy use had been gradually increasing since 2001, before peaking in 2007 at 3.5%. It then declined in 2010 (3.0%) and again in 2013 (2.5%).
The majority of recent ecstasy users only took ecstasy once or twice a year (54%). The average age for first trying ecstasy has remained relatively stable, since 2001, at 18 years.
Methamphetamines
In 2013, about 1.3 million (7.0%) people had used methamphetamines in their lifetime and 400,000 (2.1%) had done so in the last 12 months. Methamphetamine use had been declining since it peaked at 3.7% in 1998 but remained stable at 2.1% between 2010 and 2013. While there was no increase in methamphetamine use in 2013, there was a change in the main form of methamphetamines used, with crystal replacing powder as the preferred form of the drug. Among recent users, powder decreased from 51% to 29%, while the use of crystal more than doubled, from 22% in 2010 to 50% in 2013. This is discussed in further detail in the 'Methamphetamine use, availability and treatment' section.
Cocaine
Of people aged 14 and over, 8.1% (or 1.5 million) had used cocaine in their lifetime, and 2.1% (or about 400,000 people) had used it in the previous 12 months. While use of drugs such as cannabis, ecstasy and methamphetamines has generally declined since 2004, the proportion of people using cocaine has been increasing since 2004. This is particularly so among those aged 20–29 and 30–39. Cocaine use in Australia is currently at the highest levels seen since the survey collection commenced.
However, recent users used cocaine less often in 2013 than in previous years, with a lower proportion using it every few months (from 26% to 18%) and a higher proportion using it once or twice a year from 61% to 71%.
Box 4.5.3: Opioids and misuse of pharmaceuticals
According to the 2013 NDSHS, an estimated 900,000 Australians aged 14 and over (4.7%) used a pharmaceutical drug for non-medical purposes in the previous 12 months. This represents a significant rise from 4.2% in 2010, and is the highest proportion reported since 2001 (AIHW 2014b).
Australia has seen an increase in mortality and morbidity associated with prescription drugs, from opioids in particular. From 2002 to 2011, the rate of accidental overdose deaths due to opioids increased from 32.3 to 49.5 per million people aged 15–54. In the 10 years since 2004–05, hospital separations for opioids also increased from 292 to 362 separations per million people (Roxburgh & Burns 2015; AIHW National Hospital Morbidity Database).
The AIHW will undertake further exploration and analysis on this emerging trend in 2016–17 and will publish results in a future report.
Age comparisons
According to the 2013 NDSHS, people in their 20s were the most likely of all age groups to report using an illicit drug in the previous 12 months (27%) (Figure 4.5.2). Recent cannabis use was by far the most common illicit drug use reported by this group in 2013; however, since 2001, recent use of cannabis decreased (from 29% to 21%).
While people aged 40 and over generally have the lowest rate of illicit drug use, this was the only age group in which a statistically significant increase was found in recent illicit drug use, increasing from 7.5% to 9.9% between 2001 and 2013. This was mainly driven by an increase among people in their 50s and people aged 60, and the largest relative rise in illicit drugs use was reported among people in their 50s (from 6.7% in 2001, to 8.8% in 2010 and 11% in 2013).
Figure 4.5.2: Recent use of selected illicit drugs, by age, 2001 and 2013
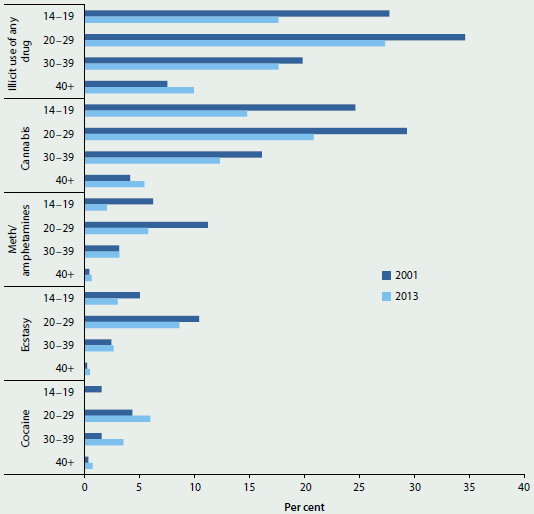
Note: 'Any illicit drug use' means they reported using at least 1 of 17 illicit drugs in the previous 12 months.
Source: AIHW 2014b.
Secondary students
Analysis of the 2011 Australian Secondary Students' Alcohol and Drug Survey suggests that an estimated 16% of 12–17 year olds had used an illicit drug, down from 20% in 2005. Illicit drug use was more common for older teenagers, with 27% of 16–17 year olds using an illicit drug in their lifetime, but again this declined from 33% in 2005. Among secondary students, misuse of tranquillisers (misuse of a specific pharmaceutical) (17%) was the most common behaviour of concern reported to have occurred in their lifetime, followed by marijuana/cannabis use (15%) (White & Bariola 2012).
Use among specific population groups
Illicit drug use varies across different population groups in Australia and Figure 4.5.3 focuses on those groups that show some of the largest disparities in illicit drug use compared with the general population—Indigenous people; people who were unemployed; people identifying as homosexual or bisexual; people with a mental illness; and people living in remote areas.
Figure 4.5.3: Proportion of illicit drug users, people aged 14 and over by specific population groups, 2013
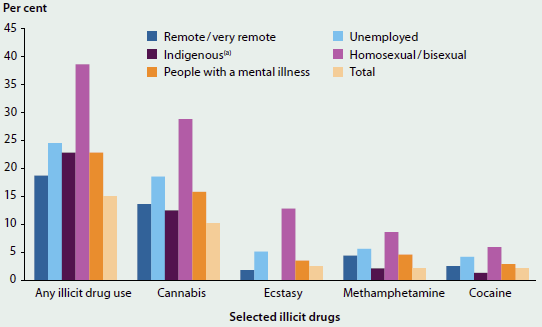
- Age-standardised percentage.
Methamphetamine use, availability and treatment
Methamphetamine (generally referred to by the street names of its two main illicit forms, 'ice' or 'speed'—see Box 4.5.4 for methamphetamine terminology) is a drug of national concern, with the Australian Crime Commission assessing it to be the illicit drug posing the greatest risk to the Australian community (ACC 2015). A number of indicators suggest that the Australian methamphetamine market has grown since 2010, as there have been increases in the detected importation, manufacture and supply of the drug. Use of crystal methamphetamine has also increased among some population groups; the number of people seeking treatment for amphetamines is increasing; and there are more hospitalisations for amphetamine-related problems. Methamphetamine comes in a number of forms and can be administered in different ways (see Box 4.5.5).
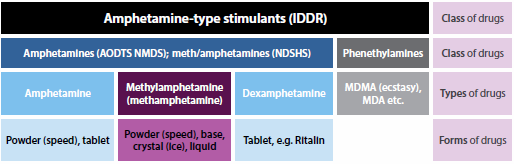
Box 4.5.4: Terminology for methamphetamine
Methamphetamine is commonly referred to as methamphetamine or 'meth' or by one of the forms in which it is purchased, such as its crystalline form 'ice'; and the terminology varies across data sources. Where possible, the crystalline form of methamphetamines has been referred to as 'crystal' throughout this feature article, rather than its street name, 'ice'. Not all data sources collect data on methamphetamine specifically; some use the broader classes of drugs— amphetamines, amphetamine-type stimulants, or 'meth/amphetamines'—to which methamphetamine belongs. This diagram provides a description of the various terms used.
Notes
- IDDR: Illicit Drug Data Report.
- AODTS NMDS: Alcohol and Other Drug Treatment Services, National Minimum Data Set.
- NDSHS: National Drug Strategy Household Survey.
Box 4.5.5: Forms of methamphetamine and route of administration
Methamphetamine comes in many forms, and changes in the use of methamphetamine have been one area of increasing concern among health professionals and the Australian community.
- Methamphetamine forms include powder/pills ('speed'), crystal ('crystal meth' or 'ice') and a sticky paste ('base').
- Powder/pills are generally snorted or ingested and crystal is usually smoked or injected.
- Dependence on methamphetamine is more commonly associated with people who inject the drug or who smoke crystalline methamphetamine, rather than among those who prefer oral or intranasal routes of administration.
- Injecting and smoking methamphetamine are both associated with more frequent use patterns, treatment demand, higher levels of risky behaviour and other health and psychiatric consequences (McKetin et al. 2008).
Production and supply
Since 2009, the global market for amphetamine-type stimulants (ATS—see Box 4.5.4) has increased substantially. An upsurge in seizures since 2009 point to a rapid expansion of the global ATS market, with ATS seizures almost doubling to reach over 130 tonnes in 2011 and 2012—the highest amount since the United Nations Office on Drug Crime systematic monitoring began—before decreasing slightly in 2013 (UNODC 2015). The increase from 2009 is primarily attributable to the growing amount of methamphetamine seized, which increased from 31 tonnes in 2009 to 80 tonnes in 2013.
Arrests, seizures and detections
Over the last 5 years, the total number of arrests for ATS increased—accounting for 16% of illicit drug arrests in 2009–10 (12% were for consumers; 4.6% for providers) and 23% (18% for consumers; 5.6% for providers) in 2013–14 (Figure 4.5.4). Consumers apprehended for possessing or using illicit drugs accounted for more than three-quarters (76%) of all ATS arrests in 2013–14 (ACC 2015).
In Australia, the number of ATS (excluding MDMA) detections at the Australian border has increased dramatically since 2009–10 (ACC 2015) and was the highest number on record in 2013–14 (from 672 in 2009–10 to 2,367 in 2013–14). The total mass of these detections also increased from 67 kg in 2009–10 to 1,812 kg in 2013–14, although the national mass of seizures decreased by 326 kg between 2012–13 and 2013–14 (ACC 2015). The number of national seizures followed similar trends, increasing from 10,543 in 2009–10 to 26,805 in 2013–14. The national mass of seizures also increased over this period (from 671kg to 4,076kg).
Figure 4.5.4: Selected key trends in methamphetamine use, availability and treatment, 2009–10 to 2013–14
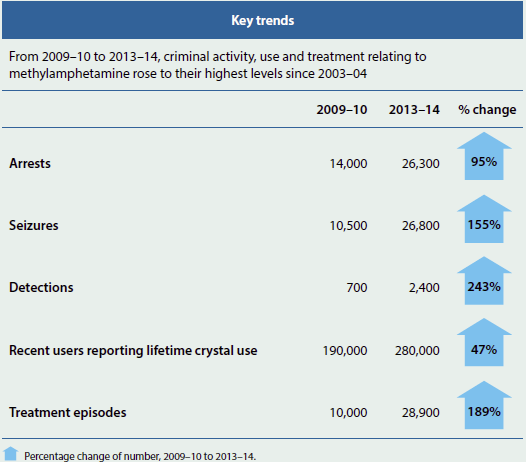
Notes
- Each data source has different reference periods, counting units and sample sizes, see 'Data sources'.
- The specific timing of when these increases occurred may vary due to the overlap between reference periods used across data sources (that is, calendar versus financial year).
- Numbers are rounded to the nearest 100, except for use numbers, which are rounded to the nearest 10,000.
In addition to increased seizures and detections at the Australian border, the number of clandestine laboratories detected (also known as 'clan' labs—sites where illegal drugs are manufactured in secret, usually with improvised materials and methods) also increased, which is another indicator of the size of the ATS market. The number of clandestine laboratories detected in Australia more than doubled from 2003–04 to 2013–14—from 358 to 744. Of these, the majority were identified as producing ATS (excluding MDMA) (ACC 2015), and given the ease of access of precursor chemicals, such as pseudoephedrine, methamphetamine is reported as the most common ATS produced in Australia (AIC 2015).
Price and purity
In 2014, around three-quarters of people using powder, base and crystal forms of methamphetamine reported stable prices (Stafford & Burns 2014) and have reported a relatively stable price of all three forms (powder, crystal and base) since 2009.
However, using a purity-adjusted price of both powder and crystal, based on Victorian data, Scott et al. (2015) argue that the increasing purity of crystal means the price of both powder and crystal are effectively on par and the price of both has decreased over time.
Current use and trends
Despite the apparent increases in supply (see the 'Production and supply' section), lifetime and recent use of methamphetamine has declined over the last decade and remained stable in recent years. There was, however, a change in the main form of methamphetamine used between 2010 and 2013, with crystal methamphetamine being the preferred form and used more often than powder. In addition, there were consistent increases across a number of data sources between 2010 and 2013. For example:
- the proportion of recent methamphetamine users who reported smoking the drug increased significantly (from 19% to 41%), and the proportion swallowing the drug decreased significantly (from 36% to 26%), probably reflecting the shift in main form used from powder to crystal
- among recent meth/amphetamine users, the number who 'mainly' and 'ever' used crystal, and the number who 'frequently' used crystal (at least once per week) all increased (Figure 4.5.5)
- it was estimated that there were around 120,000 more recent methamphetamine users who used crystal as their main form in 2013, compared with 2010 (AIHW 2015d) (Note, this only represents those people who reported that they used crystal as their main form in the previous 12 months; the number is likely to be higher as it does not represent all crystal users.)
- the number of treatment episodes for amphetamines increased from around 10,000 in 2009–10 to 28,900 in 2013–14 (AIHW 2014b)
- the reported availability of crystal also increased, with people who inject drugs, psychostimulant users and police detainees all claiming that crystal was easier to obtain in 2013 (Coghlan & Goldsmid 2015; Sindicich & Burns 2014; Stafford & Burns 2014).
Figure 4.5.5: Recent methamphetamine users who 'ever used', 'mainly used', and 'used crystal at least weekly', and closed episodes for clients receiving treatment for amphetamines, 2004 to 2013
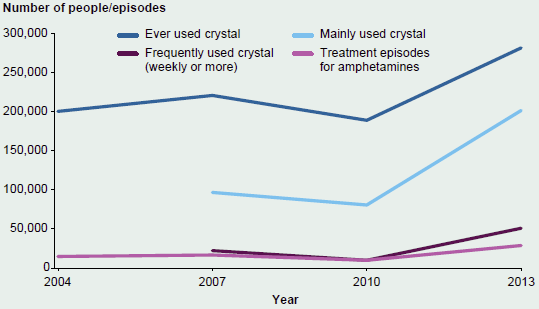
Notes
- Treatment data relates to episodes; a person may have multiple treatment episodes in a reporting year.
- Information on crystal specifically is not available prior to 2007 for main form used and frequency of use.
Sources: 2004 to 2013 National Drug Strategy Household Surveys; 2003–04 to 2013–14 Alcohol and Other Drug Treatment Services National Minimum Data Set.
Frequency of use
High doses and frequent use of methamphetamine can cause amphetamine-induced psychosis (characterised by symptoms similar to paranoid schizophrenia and other psychoses); increased risk of suicide; violent behaviour; diminished effects over time (leading to users increasing their dose to achieve intoxication); and methamphetamine dependence (Campbell 2001). Dependent users have been found to be three times as likely to experience psychotic symptoms as non-dependent users (McKetin et al. 2006). Results indicate that those using methamphetamine, particularly ice, are doing so with increased frequency. Between 2010 and 2013:
- there was an increase in the reported frequency of methamphetamine use—daily or weekly use rose from 9.3% to 16%
- daily and weekly use among people who reported mainly using crystal more than doubled—from 12% in 2010 to 25% in 2013 (AIHW 2014b).
Data from the Illicit Drug Reporting System (IDRS) indicates that this trend in increased frequency of crystal use has also been observed among the population of people who inject drugs, and it has continued past 2013. Between 2010 and 2015, the reported median number of days crystal was used in the last 6 months surpassed the median number of days for powder use—7 days for crystal and 10 days for powder in 2010, compared with 20 days for crystal and 11 days for powder and in 2015 (Stafford & Burns 2014).
Who uses methamphetamines?
In 2013, males were more likely than females to have reported the use of methamphetamine in their lifetimes (8.6% and 5.3% respectively) and recently (2.7% and 1.5% respectively), and this pattern is consistent with previous years. Recent users of methamphetamine were most commonly aged 20–29, and this age group has consistently accounted for the largest prevalence of recent methamphetamines users. However, the proportion of recent users in this age group has been steadily decreasing since 2001 (from 11% in 2001 to 5.7% in 2013) (AIHW 2014b).
Which population groups are most likely to use methamphetamines?
Certain groups within the population are more likely to use drugs and to experience drug-related harms, with some population groups in the 2013 NDSHS far more likely to report having used methamphetamines recently than the general population. For example, methamphetamine use was 6.1 times as high among people experiencing high or very high levels of psychological distress as among the general population (AIHW 2014b).
| Image | Population group | Usage |
|---|---|---|
 |
Those living in Remote/Very remote areas | 2.1 times |
 |
Aboriginal and Torres Strait Islander people | 1.5 times |
 |
Unemployed people | 2.7 times |
 |
Homosexual/bisexual people | 4.1 times |
 |
Males aged 20–29 | 3.2 times |
 |
Single people with dependent children | 2.4 times |
 |
People with high or very high levels of psychological distress | 6.1 times |
Prison entrants
For the first time since the National Prisoner Health Data Collection began in 2009, in 2015 methamphetamine was the most commonly reported illicit drug used among prison entrants in the previous 12 months (AIHW 2015c). More specifically:
- use increased by 35% (from 37% in 2012 to 50% in 2015) and surpassed cannabis (41%), which has traditionally been the most common drug used among this population group as well as among the general population (10%)
- a prison history was both more common and more extensive among prison entrants who reported having used illicit drugs, particularly methamphetamine
- use of methamphetamine was more common among non-Indigenous entrants than Indigenous entrants (54% and 38%, respectively)
- the youngest entrants (aged 18–24) were the age group most likely to report methamphetamine use (59%) (AIHW 2015c).
Treatment patterns
Alcohol and other drug treatment services (AODTS) play an important role in efforts to respond to the recent trends in methamphetamine use. Information on publicly funded alcohol and other drug (AOD) treatment services in Australia, and the people and drugs treated, are collected through the AODTS National Minimum Data Set (NMDS). In 2013–14, amphetamines were the third most common principal drug of concern (17% of all treatment episodes), behind alcohol (40%) and cannabis (24%). Since 2003–04, the proportion of episodes where amphetamines were the principal drug of concern has increased (from 11% in 2003–04 to 17% in 2013–14) (AIHW 2015a).
Treatment episodes for clients using amphetamines in 2013–14 typically involved males aged 20–29—the same profile seen for methamphetamine users in the general population (AIHW 2015a).
Information on the different forms of methamphetamine is not captured in the AODTS NMDS, but the client's usual method of administration is captured. This can provide an indication of the form a client used. For example, clients smoking (report either smoking or inhaling amphetamines in vapour form) will largely be using the crystal form and clients ingesting or snorting are most likely to be using the powder form. For clients injecting amphetamines it is less clear, as each of the base, crystal, powder, or liquid forms can be injected. But, according to the most recent data from the IDRS, for injecting users who were injecting methamphetamine, crystal was the form most often used in the month preceding interview (Stafford & Burns 2014).
Since 2009–10, the number of episodes for clients injecting and smoking amphetamines has increased, while use via other methods remained relatively stable. In 2003–04, injectors accounted for 4 in 5 (79%) episodes for amphetamines and just 3.0% involved smoking the drug. However, the proportion of clients reporting they smoked amphetamines had increased, over the 11-year period to 2013–14, to 41%, while clients injecting fell to 44% (AIHW 2015a).
These trends in method of use for treatment episodes parallel those seen in the population of recent methamphetamine users from the NDSHS, where there was a substantial change in the main form of methamphetamine used—from powder to crystal—between 2010 and 2013 (AIHW 2014b).
Between 2003–04 and 2012–13, there was an increase in the geographic spread of amphetamine-related treatment episodes across Statistical Local Areas in Australia (AIHW 2015a). Overall, this represented a change of around two percentage points, with an increase in the number of episodes across all regional and remote areas (from 24% to 26%) and a decrease across Major cities (from 76% to 74%) (see also 'Chapter 6.16 Specialised alcohol and other drug treatment services').
Amphetamine-related hospital separations have also risen. Between 2003–04 and 2013–14, separations rose from 43 to 348 separations per million people. In addition, the number of methamphetamine-related hospital separations has risen since these data were first collected in 2008–09, from 22 to 131 separations per million people in 2013–14 (note that counts of methamphetamines separations are likely to be underestimated) (AIHW National Hospital Morbidity Database). These increases could partly be attributed to the increase in use of methamphetamines in their purer crystal form—crystal generally being recognised as the highest in levels of purity of methamphetamine (DoHA 2008)—which is generally considered to cause more potential harm.
What is the AIHW doing?
As with previous iterations of the NDSHS, the AIHW has established a Technical Advisory Group to provide advice on the survey design and content for the 2016 survey. Refinements to the 2016 questionnaire being considered include an additional question to measure the use of crystal methamphetamine in the previous 12 months, and changes to the pharmaceutical opioid/analgesic questions to better capture the misuse of prescription and over-the-counter opioids/analgesics.
A number of data-development activities have been identified to enhance the AODTS NMDS, including a review of treatment types and settings to better reflect current practice in the AOD sector; analysis of existing data items on pharmaceutical misuse and their involvement in polydrug use; and exploration of options for capturing treatment outcomes.
A data portal with dynamic and interactive data is also being developed.
The AIHW is undertaking a data linkage project to explore the relationship between AOD use and homelessness. This research will inform the development of integrated service approaches to help people with multiple and complex needs to stabilise their lives and reintegrate with the community.
What is missing from the picture?
People who use illicit drugs can be a difficult population to survey, as they may not wish to disclose that they are involved in an illegal activity. Currently, it is not possible to calculate the number of people who used crystal methamphetamine in the previous 12 months, from the NDSHS. From 2007, an additional question about the main form of meth/amphetamine used was added to the survey, which has enabled estimates to be produced for the minimum number of people using, but not for the total number who have used in the previous 12 months.
It is difficult to fully quantify the scope of AOD services in Australia. There are a variety of settings in which people receive treatment for alcohol and other drug-related issues that are not in scope for the AODTS NMDS. In addition, the AODTS NMDS does not cover all agencies providing substance-use services to Indigenous Australians. These agencies provide data to the Online Services Report collection.
Data on the different forms of amphetamines, and methamphetamine specifically, are not separately available in the AODTS NMDS due to the nature of the classification structure used in this collection.
Where do I go for more information?
For more information on illicit drug use and harms in Australia, see AIHW drug-related reports available online at Illicit use of drugs and Alcohol sections. The National Drug Strategy Household Survey detailed report: 2013; Trends in methylamphetamine availability, use and treatment, 2003–04 to 2013–14; and other recent publications are available for free download.
Additional research and statistics are available from the National Drug and Alcohol Research Centre; the Australian Crime Commission; National Drug Research Institute; and the National Centre for Education and Training on Addiction websites.
Two key reports quantify the efforts of such agencies: the Illicit drug data report, produced by the ACC, and the World drug report, produced by the United Nations Office on Drug Crime.
References
ACC (Australian Crime Commission) 2015. The Australian methylamphetamine market: the national picture. Canberra: ACC.
AIC (Australian Institute of Criminology) 2015. Canberra: AIC. Amphetamines.
AIHW (Australian Institute of Health and Welfare) 2014a. Australia's health 2014. Australia's health series no. 14. Cat. no. AUS 178. Canberra: AIHW.
AIHW 2014b. National Drug Strategy Household Survey detailed report: 2013. Drug statistics series no. 28. Cat. no. PHE 183. Canberra: AIHW.
AIHW 2015a. Alcohol and other drug treatment services in Australia 2013–14. Drug treatment series no. 25. Cat. no. HSE 158. Canberra: AIHW.
AIHW 2015b. National opioid pharmacotherapy statistics annual data (NOPSAD) collection. Canberra: AIHW.
AIHW 2015c. The health of Australia's prisoners 2015. Cat. no. PHE 207. Canberra: AIHW.
AIHW 2015d. Trends in methylamphetamine availability, use and treatment, 2003–04 to 2013–14. Drug treatment series no. 26. Cat. no. HSE 165. Canberra: AIHW.
Campbell A 2001. The Australian illicit drug guide: every person's guide to illicit drugs—their use, effects and history, treatment options and legal penalties. Melbourne: Black Inc.
Coghlan S & Godsmid S 2015. Findings from the DUMA program: impact of reduced methamphetamine supply on consumption of illicit drugs and alcohol. Canberra: Australian Institute of Criminology.
Collins DJ & Lapsley HM 2008. The costs of tobacco, alcohol and illicit drug abuse to Australian society in 2004–05. National Drug Strategy Monograph Series no. 66. Canberra: Department of Health and Ageing.
Department of Health 2015. The National Drugs Campaign.
DoHA (Department of Health and Ageing) 2008. Understanding the broad context of methamphetamine use. Canberra: DoHA.
IHME (Institute for Health Metrics and Evaluation) 2014. Data visualizations. Seattle: IHME.
MCDS (Ministerial Council on Drug Strategy) 2011. The National Drug Strategy 2010–2015. Canberra: DoHA.
McKetin R, McLaren J, Lubman DI & Hides L 2006. The prevalence of psychotic symptoms among methamphetamine users. Addiction 101(10):1473–78.
McKetin R, Ross J, Kelly E, Baker A, Lee N, Lubman DI et al. 2008. Characteristics and harms associated with injecting and smoking methamphetamine among methamphetamine treatment entrants. Drug and Alcohol Review 27(3):277–85.
NRHA (National Rural Health Alliance) 2015. Illicit drug use in rural Australia. Fact sheet 33, June 2015. Canberra: NRHA.
PM&C (Department of the Prime Minister and Cabinet) 2015. Release of the final report of the National Ice Taskforce. Canberra: PM&C.
Ritter A, McLeod R, & Shanahan M 2013. Monograph no. 24: Government drug policy expenditure in Australia—2009/10. DPMP Monograph Series. Sydney: National Drug and Alcohol Research Centre, University of New South Wales.
Roxburgh A & Burns L 2015. Accidental drug-induced deaths due to opioids in Australia, 2011. Sydney: National Drug and Alcohol Research Centre, University of New South Wales.
Scott N, Caulkins JP, Dietze P & Ritter A 2015. Understanding and describing Australian illicit drug markets: drug price variations and associated changes in a cohort of people who inject drugs. Monograph series no. 58. Canberra: National Drug Law Enforcement Research Fund.
Sindicich, N & Burns, L 2014. Australian trends in ecstasy and related drug markets 2013. Findings from the Ecstasy and Related Drugs Reporting System (EDRS). Australian Drug Trends Series No. 118. Sydney: National Drug and Alcohol Research Centre, University of New South Wales.
Stafford J & Burns L 2014. Australian drug trends 2013. Findings from the Illicit Drug Reporting System (IDRS). Australian Drug Trend Series No. 109. Sydney: National Drug and Alcohol Research Centre, University of New South Wales.
White V & Bariola E 2012. Australian secondary school students' use of tobacco, alcohol, and over-the counter and illicit substances in 2011. Melbourne: Cancer Council of Victoria.
UNODC (United Nations Office on Drugs and Crime) 2015. World drug report 2015. Vienna: United Nations.
4.6 Alcohol risk and harm
The consumption of alcohol is widespread within Australia and associated with many social and cultural activities. However, excessive alcohol consumption is a major cause of ill health and social harms, not limited to individual drinkers but also affecting families, bystanders and the broader community (NHMRC 2009). Alcohol-related absenteeism in Australia in 2013 was estimated at 7.5 million days, resulting in a cost of over $2 billion in lost workplace productivity (Roche et al. 2015).
Alcohol use was responsible for 5.1% of the total burden of disease and injury in Australia in 2011. It was responsible for 28% of the burden due to road traffic injuries (motor vehicle occupants), 24% of the burden due to chronic liver disease, 23% of the burden due to suicide and self-inflicted injuries, and 19% of the burden due to stroke.
What do we know about alcohol consumption in Australia?
The 2013 National Drug Strategy Household Survey has highlighted improvements in drinking patterns in Australia (Figure 4.6.1). The overall volume of alcohol consumed by people in Australia fell from 10.8 litres of pure alcohol per person in 2007–08 to 9.7 litres in 2013–14. This is the lowest level since 1962–63 (ABS 2015).
Figure 4.6.1: Drinking status, 2010 and 2013
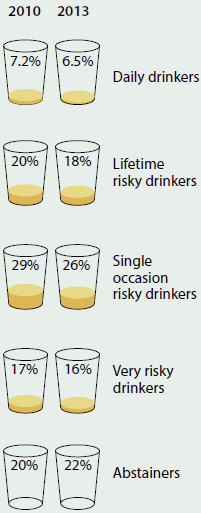
Note: the above drinking categories are not mutually exclusive.
Daily drinking down from previous years
Between 2010 and 2013, daily drinking fell from 7.2% to 6.5% in people aged 14 and over. Before this, the daily drinking rate had remained fairly stable at around 8% between 1993 and 2007.
Fewer Australians drinking at risky levels
Between 2010 and 2013, the proportion of people who drank at levels placing them at lifetime risk of harm (more than two standard drinks per day on average) fell from 20% to 18%. Fewer people also consumed five or more standard drinks on a single drinking occasion at least once a month—29% in 2010 compared with 26% in 2013. The alcohol risk data presented here are reported against guideline 1 and guideline 2 of The Australian guidelines to reduce health risks from drinking alcohol released in March 2009 by the National Health and Medical Research Council (NHMRC 2009).
Before this, the consumption of alcohol in quantities that placed Australians at risk of an alcohol-related disease, illness or injury had remained at similar levels between 2001 and 2010.
More people are abstaining from drinking alcohol
The proportion of people choosing to abstain from drinking alcohol rose from 20% in 2010 to 22% in 2013. This was largely influenced by an increase in young people aged 12–17 abstaining, from 64% in 2010 to 71% in 2013.
A considerable proportion drink to excess
In 2013, around 1 in 6 (16%) people aged 12 or older had consumed 11 or more standard drinks on a single drinking occasion in the past 12 months (compared with 17% in 2010).
Half of pregnant women still drinking
In 2013, 47% of pregnant women reported consuming alcohol during their pregnancy (little changed from 2010), but most (96%) consumed only 1–2 standard drinks on that drinking occasion.
Harm, hospitalisation and treatment
While many drinkers consume alcohol responsibly, a substantial proportion of drinkers consume alcohol at a level that is considered to increase their risk of alcohol-related disease, illness or injury. Excessive intake of alcohol not only affects a drinker's health, but also affects the people around them. In 2013:
- more than 1 in 5 (21%) of recent drinkers put themselves or others at risk of harm while under the influence of alcohol in the previous 12 months (for example, by driving a vehicle, or verbally or physically abusing someone or undertaking some other risky activity)
- more than 1 in 4 (26%) Australians had been a victim of an alcohol-related incident; verbal abuse was the most common incident reported (22%), although this proportion was lower than the 24% in 2010.
In 2014–15, there were around 115,000 clients who received treatment from publicly funded alcohol and other drug treatment agencies across Australia. Alcohol was the most common principal drug of concern, accounting for over one-third (37%) of clients and 40% of treatment episodes (a total of 60,000 episodes) (AODTS NMDS). See 'Chapter 6.16 Specialised alcohol and other drug treatment services' for more information.
In 2013–14, about 1% of hospitalisations had a drug-related principal diagnosis; of those, 55% were for alcohol. Over the 5 years to 2013–14, alcohol has consistently been the drug-related principal diagnosis with the highest number of hospital separations, increasing from 61,000 to nearly 66,000 hospitalisations in that time (from about 280 to 282 hospitalisations per 100,000) (AIHW analysis of the National Hospital Morbidity Database).
In 2014–15, around 70,000 emergency department presentations for alcohol/ drug abuse and alcohol/drug induced mental disorders were reported, based on diagnosis information. This equates to approximately 1% of all emergency department presentations. (Note, the quality of diagnosis information in the National Non-Admitted Patient Emergency Department Care Database has not been assessed.)
What is missing from the picture?
Estimation of ill health and death associated with alcohol use is complex. While both can occur as a direct result of alcohol use (for example, alcohol poisoning), in most cases alcohol is one of a number of contributing factors. The data presented on alcohol-related hospitalisations is therefore likely to represent only a fraction of the total harm caused by alcohol.
Surveys of self-reported alcohol consumption are likely to produce an underestimate of the total amount of alcohol consumed in Australia (Stockwell et al. 2004). Wholesale sales data are an alternative measure of consumption. While national data are available, they have not been available at a regional level since 1997. Recent progress has been made to collect data from most (but not all) states and territories (Loxley et al. 2014). While wholesale data provides a more accurate estimate of average consumption, it cannot identify individual drinking levels and the number of drinkers exceeding the recommended alcohol guidelines.
Where do I go for more information?
More information on alcohol consumption and harms in Australia is available at Illicit use of drugs and Alcohol sections. The National Drug Strategy Household Survey detailed report: 2013; Alcohol and other drug treatment services in Australia 2013–14; and Emergency department care 2014–15: Australian hospital statistics can be downloaded for free.
References
ABS (Australian Bureau of Statistics) 2015. Apparent consumption of alcohol, Australia, 2013–14. ABS cat. no. 4307.0.55.001.
Loxley W, Gilmore W, Catalano P & Chikritzhs T 2014. National Alcohol Sales Data Project (NASDP) stage four report, 2014. Perth, Western Australia: National Drug Research Institute, Curtin University.
NHMRC (National Health and Medical Research Council) 2009. Australian guidelines to reduce health risks from drinking alcohol. Canberra: NHMRC.
Roche A, Pidd K & Kostadinov V 2015. Alcohol- and drug-related absenteeism: a costly problem. Australian and New Zealand Journal of Public Health. DOI: 10.1111/1753-6405.12414.
Stockwell T, Donath S, Cooper-Stanbury M, Chikritzhs T, Catalano P & Mateo C 2004. Under-reporting of alcohol consumption in household surveys: a comparison of quantity-frequency, graduated-frequency and recent recall. Addiction 99(8):1024–33.
4.7 Tobacco smoking
In 2011, tobacco smoking was the leading risk factor contributing to death and disease in Australia and was responsible for 9.0% of the total burden of disease and injury. This includes the risks associated with past tobacco use, current use, and exposure to second-hand smoke. Tobacco smoking increases the risk of cardiovascular disease, respiratory diseases and other health problems (USHHS 2014). In Australia in 2011, it was estimated that 80% of lung cancer burden and 75% of chronic obstructive pulmonary disease burden were attributable to tobacco smoking.
It has been estimated that, during a given year, smoking kills around 15,000 Australians and has significant social (including health) and economic costs—estimated at $31.5 billion in 2004–05 (Collins & Lapsley 2008).
Australia has been successful in reducing smoking prevalence over many years through the use of many strategies (IGCD 2013). These have included advertising bans; bans on smoking indoors and increasingly in outdoor public spaces; plain packaging; price increases; restrictions on sales to minors; public education; and media campaigns (IGCD 2013; MCDS 2011).
Fewer Australians are smoking
Fewer people, both proportionally and absolutely, are smoking daily and more people have never smoked, compared with 20 years ago.
- In 2013, the proportion of people aged 14 and over smoking daily (13%) was lower than in 2010 (15%), and almost half that of 1991 (24%). The proportion of people who reported never smoking rose from 58% in 2010 to 60% in 2013.
- In 2014, the proportions of secondary school students aged 12–17 smoking in their lifetime, in the past 4 weeks, past week or on 3 days of the last 7, were significantly lower than in 2008 and 2011 (White & Williams 2015).
Positive changes to smoking patterns over time
Fewer people are being exposed to tobacco smoking, more people are delaying the uptake of smoking and smokers are smoking fewer cigarettes.
- Dependent children were far less likely to be exposed to tobacco smoke inside the home in 2013 (3.7%) than in 1995 (31%).
- The average age at which young people aged 14–24 smoked their first cigarette has steadily risen since 2001 (15.9 years in 2013 compared with 14.3 in 2001), indicating a delay in uptake of smoking.
- Smokers smoked fewer cigarettes per week in 2013 (96) than in 2001 (113).
- The proportion of women smoking at any time during pregnancy has steadily declined over time—from 15% in 2009 to 12% in 2013.
The likelihood of being a daily smoker is:
 2 times as high in Remote/Very remote areas compared with Major cities
 1.9 times as high for homosexual/bisexual people compared with heterosexual people
 3 times as high in the lowest socioeconomic areas compared with the highest socioeconomic areas
 2.7 times as high for single people with dependent children compared with couples with dependent children
 1.7 times as high for unemployed people compared with employed people
 5.7 times as high for prison entrants compared with the general population
 2.6 times as high for Aboriginal and Torres Strait Islander Australians compared with non-Indigenous Australians.
- Rate ratio based on the estimates reported in the 2015 NPHDC and the 2013 NDSHS.
- Rate ratio based on the Indigenous estimates reported in the 2011–13 AATSIHS and the non-Indigenous estimates reported in the 2011–12 NHS (ABS 2014).
Notes
- All other rate ratios are based on estimates reported in the 2013 NDSHS.
- The rate ratio for socioeconomic areas is based on the Index of Relative Socio-economic Advantage and Disadvantage.
Rates differ across population groups
Although substantial progress has been made in reducing the rates of smoking in Australia, smoking remains one of the leading causes of preventable disease and death. In 2013, certain groups within the population were far more likely to smoke daily than their counterparts, and are at greater risk of tobacco smoking and tobacco-related harm.
The proportion of people smoking daily in 2013 was highest among people aged 25–29 and 40–49. The fall in daily smoking rates over the past 12 years has predominantly been for people aged 18–49—there has been little change among people aged 60 and over during this period (Figure 4.7.1). Use of battery-operated electronic cigarettes (e-cigarettes) is more common among younger smokers and was highest for smokers aged 18–24 (27%) in the last 12 months and declined with age (to 5.3% of smokers aged 70 and over).
Figure 4.7.1: Daily smokers, by age, 2001 and 2013
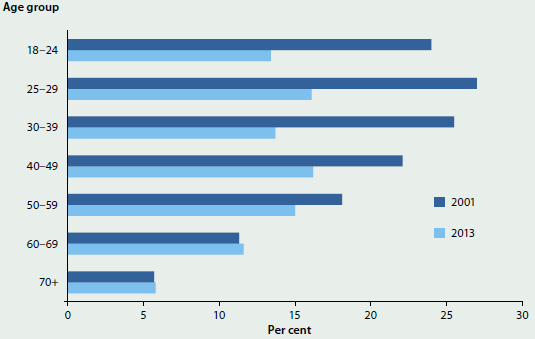
What is missing from the picture?
The most recent estimate of the social and economic costs of tobacco smoking is for 2004–05. Substantial changes to smoking patterns have occurred since 2004 and more recent data on these costs would enhance evaluations of policy effectiveness.
There are limited data on smoking behaviours for some population groups at risk of tobacco smoking and related harm. For example, there is no regular data collection on smoking prevalence among many groups that face multiple levels of disadvantage, such as people experiencing homelessness; people living with a mental illness; culturally and linguistically diverse populations; and the drug treatment population.
There are also limited data on behaviours or circumstances that lead ex-smokers to successfully quit and maintain cessation.
Where do I go for more information?
More information on tobacco use in Australia is available at National Drug Strategy Household Survey (NDSHS). The National Drug Strategy Household Survey detailed report: 2013 can be downloaded for free. More information about tobacco control measures in Australia is available at Tobacco Control key facts and figures.
References
ABS (Australian Bureau of Statistics) 2014. Australian Aboriginal and Torres Strait Islander Health Survey: first results, Australia, 2012–13. Cat. no. 4727.0.55.001. Canberra: ABS.
Collins D & Lapsley H 2008. The costs of tobacco, alcohol and illicit drug abuse to Australian society in 2004/05. National Drug Strategy Monograph Series: Monograph no. 64. Canberra: Department of Health and Ageing.
IGCD (Intergovernmental Committee on Drugs) 2013. National Tobacco Strategy 2012–2018. Canberra: Department of Health and Ageing.
MCDS (Ministerial Council on Drug Strategy) 2011. National Drug Strategy 2010–2015: a framework for action on alcohol, tobacco and other drugs. Canberra: Department of Health and Ageing.
USHHS (US Department of Health and Human Services) 2014. The health consequences of smoking—50 years of progress: a report of the Surgeon General, 2014. Atlanta, Georgia: US Department of Health and Human Services, Centers for Disease Control and Prevention, National Center for Chronic Disease Prevention and Health Promotion, Office on Smoking and Health.
White V & Williams T 2015. Australian secondary school students' use of tobacco in 2014: report. Report prepared for: Tobacco Control Taskforce, Australian Government Department of Health. Sydney: Cancer Council.
4.8 Health behaviours and biomedical risks of Indigenous Australians
The prevalence of major behavioural and biomedical health risk factors is generally higher for Aboriginal and Torres Strait Islander Australians than for other Australians. Behavioural risks include smoking, poor nutrition, physical inactivity and excessive alcohol consumption. Biomedical risks are bodily states that can contribute to the development of chronic disease, such as being obese or having abnormal levels of blood lipids (see 'Chapter 4.3 Biomedical risk factors').
This snapshot describes some of the behavioural and biomedical risk factors that contribute to poor health status for Indigenous Australians.
Smoking and alcohol consumption
The prevalence of smoking remains significantly higher in the Indigenous population than in the non-Indigenous population, while the picture for alcohol consumption is more complex.
- In 2012–13, 44% of Indigenous Australians aged 15 and over reported being a current smoker—42% smoked daily and 2% smoked weekly or less frequently. After adjusting for differences in age structure, Indigenous Australians were 2.6 times as likely as non–Indigenous Australians to smoke daily (Figure 4.8.1).
- The smoking rate for Indigenous Australians aged 15 and over has declined significantly, from 51% to 44% between 2002 and 2012–13.
- In 2012–13, a high proportion (26%) of Indigenous Australians aged 15 and over reported that they had not drunk any alcohol in the previous 12 months. After adjusting for age differences, this rate of abstention was 1.6 times the non-Indigenous rate (AIHW 2015).
- Indigenous Australians who consume alcohol do so at levels that are risky for their health. In 2012–13, 54% of Indigenous Australians aged 15 and over drank at levels placing them at risk of harm—more than four standard drinks on a single occasion at least once in the past 12 months. After adjusting for differences in age structure, Indigenous people aged 15 and over were 1.1 times as likely as non-Indigenous people to have exceeded the guidelines for single-occasion risk (50% and 44% respectively) (Figure 4.8.1). This is a much smaller difference than in smoking rates.
Physical inactivity
Physical inactivity is a risk factor associated with several potentially preventable chronic diseases that are prevalent in the Indigenous population, including cardiovascular disease, hypertension and diabetes.
Figure 4.8.1: Age-standardised prevalence of selected health behaviours and risks, by Indigenous status, 2011–13
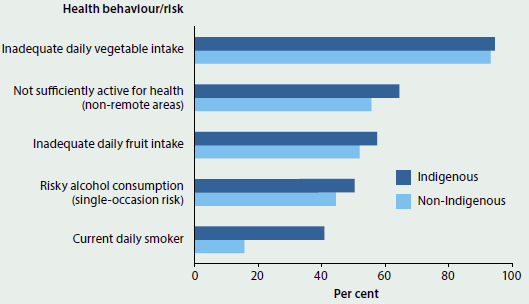
Sources: ABS 2013, 2014b, 2014c.
Based on 2012–13 Australian Aboriginal and Torres Strait Islander Health Survey (AATSIHS) data:
- More than 6 in 10 (61%) of Indigenous adults in non-remote areas had been sedentary or undertook low levels of physical activity in the week prior to the survey (less than 150 minutes over five or more sessions).
- Insufficient activity levels were higher for Indigenous females (68%) than for males (53%).
- After adjusting for differences in age structure, Indigenous adults were more likely than non-Indigenous adults to not have undertaken the recommended activity levels in the last week (64% compared with 56%) (Figure 4.8.1).
The physical activity of Indigenous adults was assessed differently in remote areas (and this measure is not comparable with the physical activity data for persons living in non-remote areas).
- More than half (55%) of Indigenous adults in remote areas spent more than 30 minutes in the previous day undertaking physical activity or walking 20% spent less than 30 minutes, 21% did no physical activity, while data were missing for 4% (ABS 2014b).
Dietary behaviours
Several principal causes of ill health are nutrition-related, including type 2 diabetes and coronary heart disease. The AATSIHS self-reported results (ABS 2014c) show that:
- 85% of Indigenous children aged 2–14, and 97% of Indigenous adults aged 15 and over, had inadequate daily fruit and/or vegetable intake
- 22% of Indigenous children aged 2–14, and 58% of Indigenous adults aged 15 and over, did not eat the daily intake of fruit (2 serves), recommended in the 2013 National Health and Medical Research Council guidelines
- 84% of Indigenous children aged 2–14, and 95% of Indigenous adults aged 15 and over, did not eat the daily recommended intake of vegetables (5–6 serves).
Biomedical risks
This section summarises data on four biomedical factors that can pose direct and specific risks to health: high blood pressure, obesity, vitamin D deficiency and abnormal blood lipid levels (such as high cholesterol and triglycerides). Data about high blood pressure and being overweight or obese (based on body mass index, or BMI) among Indigenous Australians are sourced from the 2012–13 AATSIHS. Information on vitamin D deficiency and high levels of cholesterol and triglycerides are from the National Aboriginal and Torres Strait Islander Health Measures Survey (NATSIHMS), a voluntary component of the AATSIHS, in which around 3,300 Indigenous adults aged 18 and over from across Australia provided blood and urine samples for analyses (ABS 2014a).
- One in 5 (20%) Indigenous adults had measured high blood pressure, with more men (23%) affected than women (18%).
- Nearly 4 in 5 (79%) people who had measured high blood pressure did not report it as a long-term condition (ABS 2014c).
- Almost 7 in 10 (69%) Indigenous adults aged 18 and over were either overweight (29%) or obese (40%), according to their BMI score (ABS 2014c).
- After adjusting for differences in age structure, Indigenous adults aged 18 and over were 1.6 times as likely to be obese as non-Indigenous adults—43% compared with 27% (Figure 4.8.2); but less likely (0.8 times) to be overweight than non-Indigenous adults (30% compared with 35%).
- Overall, Indigenous adults were 1.2 times as likely to be either overweight or obese as non-Indigenous adults (72% compared with 63%).
Levels of physical activity are related to being overweight or obese:
- Indigenous adults in non-remote areas who were sufficiently active were less likely to be obese than those who were fully inactive (31% compared with 56%) (ABS 2014b).
The NATSIHMS results show that, among Indigenous adults in 2012–13:
- around 1 in 4 (27%) had vitamin D deficiency, and this condition was more common among Indigenous adults living in remote areas (39%) than among those living in non-remote areas (23%)
- 1 in 4 (25%) had abnormal or high total cholesterol levels, and a similar proportion also had high triglyceride levels.
After adjusting for differences in the age structure (Figure 4.8.2):
- Indigenous adults were nearly twice as likely to have abnormally high triglycerides compared with non-Indigenous adults (27% compared with 14% respectively, a rate ratio of 1.9).
- Indigenous adults were less likely than non-Indigenous adults to have high total cholesterol levels (26% compared with 33%, a rate ratio of 0.8).
Figure 4.8.2: Age-standardised prevalence of selected biomedical risks, by Indigenous status, 2011–13
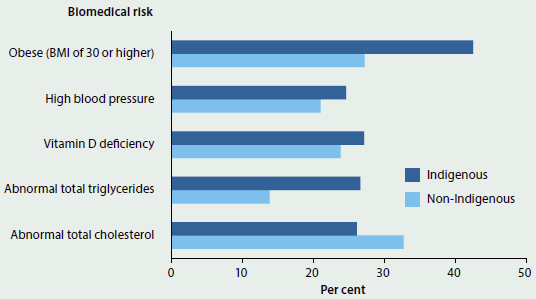
Sources: ABS 2014a, 2014c.
What is missing from the picture?
Data on the behavioural and biomedical health risk factors among Indigenous Australians were enhanced through the additional components of the 2012–13 AATSIHS, such as the Health Measures Survey and the Nutrition and Physical Activity Survey. The frequency of these additional components, however, is insufficient to produce a consistent time series. The available data are too sparse to regularly assess changes in these risk factors, or explain their contribution to the health gaps between the Indigenous and non-Indigenous populations, and the health inequities within the Indigenous population. Some of these data items are collected only from Indigenous people living in non-remote locations. There also are data gaps on the relationship between the observed behavioural risk factors and an individual's participation in and outcomes from treatment programs and other preventative health interventions.
Where do I go for more information?
For more details on the health behaviours and biomedical markers of Indigenous Australians, see the Australian Aboriginal and Torres Strait Islander Health Survey (AATSIHS) 2012–13.
References
ABS (Australian Bureau of Statistics) 2013. Australian Aboriginal and Torres Strait Islander Health Survey: first results, 2012–13. ABS cat. no. 4727.0.55.001. Canberra: ABS.
ABS 2014a. Australian Aboriginal and Torres Strait Islander Health Survey: biomedical results, 2012–13. ABS cat. no. 4727.0.55.003. Canberra: ABS.
ABS 2014b. Australian Aboriginal and Torres Strait Islander Health Survey: physical activity, 2012–13. ABS cat. no. 4727.0.55.004. Canberra: ABS.
ABS 2014c. Australian Aboriginal and Torres Strait Islander Health Survey: updated results, 2012–13. ABS cat. no. 4727.0.55.006. Canberra: ABS.
ABS 2015. Australian Aboriginal and Torres Strait Islander Health Survey: nutrition results—food and nutrients, 2012–13. ABS cat. no. 4727.0.55.005. Canberra: ABS.
AIHW (Australian Institute of Health and Welfare) 2015. Aboriginal and Torres Strait Islander Health Performance Framework 2014 report: detailed analyses. Cat. no. IHW 167. Canberra: AIHW.