
Chapter 1 An overview of Australia's health
1.0 Introduction
Good health is important—it influences not just how we feel, but how we go about our everyday lives. The vast majority of Australians aged 15 and over report their health as 'good' or better, but this can mean different things to different people.
It is now widely accepted that health is much more than the presence or absence of disease. It reflects genetic, lifestyle and environmental factors; cultural influences; socioeconomic conditions; and the availability and quality of health care programs and services.
To this end, Australia's health 2016 examines health from a variety of perspectives, including the leading types of ill health that affect us as a nation; specific risks and health inequalities faced by different groups within our population; and the services that are provided to people to prevent illness, or to treat and support them in times of illness. It also provides an overview of the health system.
Topical issues featured in the report include chronic disease, mental health, illicit drug use, health spending, access to health services, end-of-life care, and trends in hospital care.
The report contains a lot of good news: our life expectancy is one of the highest in the world, and the incidence of heart attacks and the death rate from cardiovascular disease have improved. A much smaller proportion of people smoke today than 20 years ago, and overall alcohol consumption has fallen to its lowest level in 50 years.
Despite this good news, in 2014–15 more than 11 million Australians had at least one of eight chronic conditions, and some—including people living in rural and remote areas, people living in the lowest socioeconomic areas, Aboriginal and Torres Strait Islander Australians, and people living with disability—fare worse than others in terms of their health and longevity. For this reason, inequality in health is one of the important themes highlighted in this edition.
1.1 What is health?
What does it mean when we say a person is 'healthy' or 'unhealthy'?
At a simple level, one can view the concept of health by focusing on the individual and on the presence, or absence, of disease and medically measured risk factors.
A broader and more widely accepted view sees health as multidimensional: defining health 'as a state of complete physical, mental and social well-being and not merely the absence of disease or infirmity' (WHO 1946).
This multidimensional model incorporates:
- genetic, lifestyle and environmental factors
- cultural influences
- socioeconomic conditions
- provision of, access to, and use of health care services and programs.
Australia's health 2016 takes this broader view of health and functioning—a conceptual framework outlined in Figure 1.1.1. This figure shows that a person's health and wellbeing depend on two general factors: 'determinants' (things that influence health) along with 'interventions' and the required resources (what can be done to improve a person's health).
Figure 1.1.1: Conceptual framework for Australia's health 2016
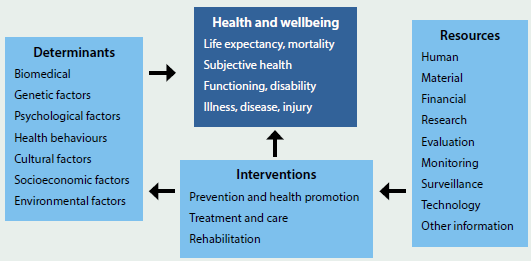
As this figure illustrates, a person's health and wellbeing result from a complex interplay between biological, lifestyle, socioeconomic, societal and environmental factors—many of which can be modified to some extent by health care and other interventions.
Many things can affect how healthy we are, ranging from the macro to the molecular: from society-wide influences (for example, the prevalence of drug and alcohol use), to highly individual factors such as genetic make-up. And, of course, our health can also be significantly affected by the quality and timeliness of the health care we receive, including preventive health care such as screening and immunisation (see 'Chapter 6.1 Prevention and health promotion').
Measures of health
There are many measures used to ascertain the health status of a person and a population. Box 1.1.1 explains some of the main measures that are featured throughout this report.
Box 1.1.1: Common measures of health
- Life expectancy: a measure of length of life. It is often expressed as either the number of years a newborn baby is expected to live, or as the expected number of years of life remaining for a person at a given age.
- Mortality: the number of deaths in a population in a given period.
- Morbidity: refers to ill health in an individual and to levels of ill health within a population or group.
- Comorbidity: the occurrence of two or more diseases in a person at any one time.
- Incidence: the number of new cases occurring in a given period. For example, in 2016, it is estimated that 130,500 new cases of cancer will be diagnosed in Australia.
- Prevalence: the number or proportion of cases in a population at a given time. For example, at the end of 2009, the 5-year prevalence for all cancers was 370,474—that is, 370,474 people were alive who had been diagnosed with cancer in the previous 5 years.
- Disability-adjusted life year (DALY): a year of healthy life 'lost, either through dying early or through living with disability due to illness or injury. It combines the estimates of years of life lost (YLL)—which measures the years lost between the age at which a person dies and the number of years they could have potentially gone on to live—and years lived with disability (YLD), to arrive at the total years of healthy life lost from living with disease and injury (see 'Chapter 3.1 Burden of disease and injury in Australia').
- Self-assessed health status: this measure is based on a person's own opinion about how they feel about their health, their state of mind and their life in general. It is commonly sourced from population surveys.
Determinants
As shown in Figure 1.1.1, a range of factors influence a person's health—from biomedical factors such as blood pressure, cholesterol levels and body weight, to behavioural factors such as smoking, alcohol consumption and exercise. Health can also be affected by social determinants: the social, economic, political, cultural and environmental 'conditions into which people are born, grow, live, work and age' (WHO 2015). For detailed discussion of these factors, see 'Chapter 4 Determinants of health'.
About Australia's health 2016
This report encompasses the ideas that health is an important part of how people feel and function; that it contributes to social and economic wellbeing; that there are degrees of good health as well as of bad health; that health can vary over time; and that health should be seen in a broad social context. To this end, Australia's health 2016 examines health through a variety of different 'lenses', including the leading types of ill health that affect us as a nation; the burden of disease in the Australian population; specific risks and health inequalities faced by different groups within our population; the role of preventive health care; and the services that are provided to people in times of illness. It also provides an overarching view of how the health system functions.
Where do I go for more information?
More information on health definitions, social determinants of health, global health actions and data can be obtained from the World Health Organization website. See also 'Chapter 3.1 Burden of disease and injury in Australia', 'Chapter 3.3 Chronic disease and comorbidities' and 'Chapter 4.1 Social determinants of health'.
References
WHO (World Health Organization) 1946. Preamble to the Constitution of the World Health Organization as adopted by the International Health Conference, New York, 19–22 June, 1946. New York: WHO.
WHO 2015. Social determinants of health. Geneva: WHO. Viewed 12 October 2015.
1.2 Australians: who we are
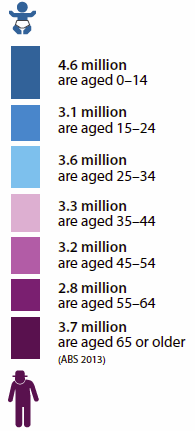
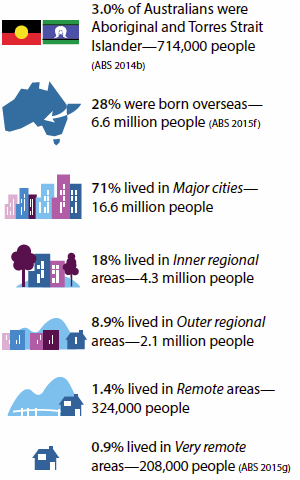
Our estimated population in 2016 is 24.4 million, of which:
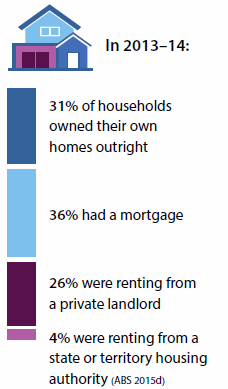
In 2014:

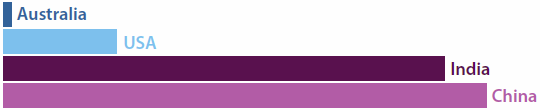
Australia's population ranks it 56th most populous in the world. The most populous country is China, with 1.37 billion people, followed by India (1.25 billion) and the United States with 321.4 million (CIA 2013).
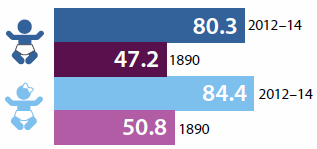
A boy born between 2012 and 2014 can expect to live to 80.3 years and a girl to 84.4 years (ABS 2015a). This compares with 47.2 and 50.8 years, respectively, in 1890 (ABS 2014a).
 In 2015, 76% of people aged 15–64 held a Year 12 or non-school qualification at Certificate II level or above (ABS 2015b).
 In 2014, the labour force participation rate for Australians aged 15–64 was 76% (ABS 2015e).
 Almost 1 in 3 (30%) employed people aged 15–64 worked part-time (ABS 2015e).
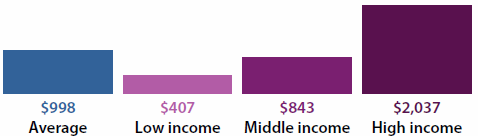
 In 2013–14, in real terms, the average disposable household income (after adjusting for the number of people in the household) was $998 per week. Low-income households had an income of $407 per week, middle-income households $843 per week and high-income households $2,037 per week (ABS 2015c).
References
ABS (Australian Bureau of Statistics) 2013. Population projections, Australia, 2012 (base) to 2101. ABS cat. no. 3222.0. Canberra: ABS.
ABS 2014a. Australian historical population statistics, 2014. ABS cat. no. 3105.0.65.001. Canberra: ABS.
ABS 2014b. Estimates and projections, Aboriginal and Torres Strait Islander Australians, 2001 to 2026. ABS cat. no. 3238.0. Canberra: ABS.
ABS 2015a. Deaths, Australia, 2014. ABS cat. no. 3302.0. Canberra: ABS.
ABS 2015b. Education and work, Australia, May 2015. ABS cat. no. 62227.0. Canberra: ABS.
ABS 2015c. Household income and wealth, Australia, 2013–14. ABS cat. no. 6523.0. Canberra: ABS.
ABS 2015d. Housing occupancy and costs, 2013–14. ABS cat. no. 4130.0. Canberra: ABS.
ABS 2015e. Labour force, Australia, detailed—electronic delivery, Dec 2014. ABS cat. no. 6291.0.55.001. Canberra: ABS.
ABS 2015f. Migration, Australia, 2013–14. ABS cat. no. 3412.0. Canberra: ABS.
ABS 2015g. Regional population growth, Australia 2013–14. ABS cat. no. 3218.0. Canberra: ABS.
CIA (Central Intelligence Agency) 2013. The world factbook 2013–14. Washington, DC: CIA.
1.3 How healthy are Australians?
There is a lot of good news on the health front in Australia: our life expectancy is one of the highest in the world; death rates have continued their long-term downward trend; and our health generally compares well with that of the populations of comparable Organisation for Economic Co-operation and Development (OECD) countries.
This article examines how healthy we are by looking at some of the common measures outlined earlier in this chapter—life expectancy, morbidity, mortality, incidence and prevalence rates, disability-adjusted life years (DALY) and self-assessed health status (see 'Chapter 1.1 What is health?'). It also compares Australia's health with that of other OECD countries.
It highlights the growing impact of chronic disease, and the crucial role that lifestyle risk factors such as smoking, alcohol and obesity will play in our health outcomes now and in the future.
It also discusses the health inequalities faced by some population groups, such as Aboriginal and Torres Strait Islander Australians and people living outside our urban centres, and whether progress is being made in narrowing these 'health gaps'.
By many measures, we are doing well
We are living longer
Life expectancy is one of the most commonly used measures of the overall health of a population. It can be defined as how long, on average, a male or female at a given age can expect to live, based on current death rates (AIHW 2014a).
Life expectancy at birth in Australia has climbed steadily over time, and is now more than 30 years longer than it was in the late 1800s (Figure 1.3.1). For example, life expectancy for males and females born in 2014 was 80.3 years and 84.4 years respectively (ABS 2015c), whereas males and females born in 1890 could expect to live to 47.2 years and 50.8 years respectively (ABS 2014b).
Figure 1.3.1: Life expectancy at birth, by sex, Australia, 1890–2014
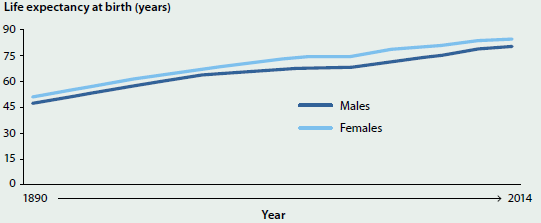
Sources: ABS 2014b, 2015c.
Males who had survived to the age of 65 in 2014 could expect to live, on average, another 19.4 years (to 84.4 years) and females an extra 22.2 years (to 87.2) (ABS 2015c).
We are living longer free of disability
The concept of what it means to be 'healthy' encompasses not just how many years a person lives, but whether those years are lived with disability, chronic illness, or other health conditions that affect quality of life.
In 2012, a newborn boy in Australia could expect to live 62.4 years without disability and another 17.5 years with some form of disability, and a newborn girl 64.5 years without disability and 19.8 years with some form of disability (see Glossary) (AIHW 2014b).
Between 1998 and 2012, the disability-free life expectancy for males rose by 4.4 years, which was more than the gain in male life expectancy over that period (4 years). However, the increase in years free of disability for females was 2.4 years, compared with a 2.8 years gain in female life expectancy (AIHW 2014b).
Our death rates continue to fall
In 2013, there were nearly 147,700 deaths registered in Australia—about 600 more than in 2012 and nearly 15,400 more than in 2003. Since 2003, the number has risen by around 1.0% per year on average for males and by 1.2% for females (ABS 2014c).
Despite an increase in the absolute number of deaths, there has been a long and continuing fall in death rates per 100,000 population in Australia. From 1907 to 2013, the age-standardised death rate for males and females fell by 71% and 76% respectively (AIHW 2015d) (see Figure 1.3.2).
Figure 1.3.2: Age-standardised death rates by sex, Australia, 1907–2013
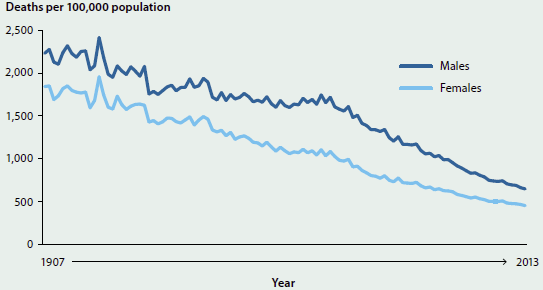
Source: AIHW 2016b.
In 2013, children aged 5–9 and 10–14 had the lowest rates of death (9 and 10 per 100,000 population respectively). The rate gradually increased from the age of 15–19 (32 per 100,000) and by the age of 60–64 was 613 per 100,000 population. The highest death rate was for people aged 85 and over (13,088 per 100,000). Death rates have remained higher for males than for females for all age groups (AIHW 2016b).
In 2013, coronary heart disease was the leading underlying cause of death in Australia (see Glossary), followed by dementia and Alzheimer disease, and cerebrovascular disease (predominantly stroke). The fourth leading underlying cause of death was lung cancer and the fifth was chronic obstructive pulmonary disease (COPD) (AIHW 2015a) (see Figure 1.3.3).
Figure 1.3.3: Leading causes of death, by sex, Australia 2013
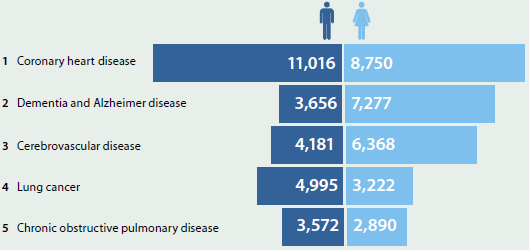
Note: Leading causes of death are based on underlying causes of death and classified using an AIHW-modified version of Becker et al. 2006.
Source: AIHW National Mortality Database.
When considering broad groups of diseases, such as all types of cancer combined or all cardiovascular disease (which includes coronary heart disease, stroke and heart failure), cancer contributed to the most deaths in 2013. This was the first time that the total number of deaths due to all types of cancer combined surpassed the total number of deaths due to all cardiovascular disease (44,100 and 43,600 respectively) (AIHW 2015d, 2016a).
Different age groups have different leading causes of death
Coronary heart disease was the most common underlying cause of death in Australia for people over age 45.
Land transport accidents were the leading underlying cause of death among people aged 1–14, at 14%. Suicide was the leading underlying cause of death among people aged 15–24 (28%) and 25–44 (18%) (AIHW 2015a) (see 'Chapter 5.3 How healthy are Australia's children?' and 'Chapter 5.4 Health of young Australians').
Among infants aged under 1, certain conditions originating in the perinatal period and congenital conditions were responsible for most deaths (76%). This was followed by sudden infant death syndrome (SIDS), which accounted for 6% of infant deaths (AIHW 2015a) (see 'Chapter 5.3 How healthy are Australia's children').
Premature death rates have fallen
In 2013, more than 1 in 3 deaths (34%) in Australia were 'premature' (that is, they occurred before the age of 75)—substantially lower than the 43% in 1997 (AIHW 2015b).
The three leading causes of premature death for all Australians were coronary heart disease, lung cancer and suicide. Nearly 1 in 5 deaths (18%) among people aged 25–44 were due to suicide (AIHW 2015b).
The rate of premature deaths among Indigenous Australians is higher than among non-Indigenous Australians for both males and females across every age group. Between 2009 and 2013, 81% of all Indigenous deaths were of people aged under 75, compared with 34% for non-Indigenous Australians (ABS 2015b) (see 'Chapter 3.2 Premature mortality').
Overall burden of disease has fallen
'Burden of disease' is the impact of a disease or injury on an individual or a population. Burden of disease analysis quantifies the gap between a population's actual health and an 'ideal' level of health—that is, every individual living in full health to the maximum possible life span—for all diseases at the same time. It measures both the burden of living with ill health as well the burden of dying prematurely, using disability-adjusted life years (DALY) as the unit of measurement. One DALY is one year of 'healthy life' lost due to illness/death.
Overall, in 2011 there were 201 years of healthy life lost, due to dying or to living with disease or injury, for every 1,000 people in Australia. This is equivalent to 4.5 million DALY in total. Cancer, cardiovascular disease, mental and substance-use disorders, musculoskeletal disorders and injury contributed the most burden in Australia in 2011. Together they accounted for around two-thirds of the disease burden.
After accounting for population increase and ageing, the burden of disease for the Australian population decreased between 2003 and 2011, from 211 to 190 DALY per 1,000 people (see 'Chapter 3.1 Burden of disease and injury in Australia').
Most Australians report their health as 'good' or better
According to the Australian Bureau of Statistics (ABS) 2014–15 National Health Survey (NHS), 85% of Australians aged 15 and over report their health as 'good' or better, which is similar to the previous survey in 2011–12 (ABS 2015e).
Internationally, Australia is one of the leading countries on this measure—among 34 OECD countries it ranks behind only New Zealand (90%), Canada (89%) and the United States (88%), and ranks higher than the OECD average of 69% (OECD 2015).
More than half (56%) of Australians rated their health as 'excellent' or 'very good'. Just over 1 in 10 (10.4%) Australians rated their health as 'fair' (10.7% in 2011–12), and 4.4% as 'poor' (4.0% in 2011–12) (ABS 2015e).
By comparison, only 39% of Indigenous Australians rated their health as 'excellent' or 'very good', 37% as 'good', 17% as 'fair' and 6.9% as 'poor' in 2012–13 (ABS 2014a).
But there are concerns
While there are positive signs and progress on many fronts, it is clear that Australia is not healthy in every way, and some patterns and trends give cause for concern.
Chronic disease
Chronic diseases such as cancer, coronary heart disease and diabetes are becoming increasingly common in Australia due to a population that is increasing and ageing, as well as to social and lifestyle changes. Improvements in medical care have also enabled us to live longer with illnesses and diseases, and have provided access to treatments not available in the past (AIHW 2012).
In the early 20th century, people ate fewer processed and energy-dense foods, walked more, performed more manual labour and lived with few labour-saving appliances and gadgets. Today, we may be less likely than our parents and grandparents to smoke, but we are more likely to be sedentary and spend more time in front of televisions or other electronic screens.
In terms of health burden, chronic diseases are the leading cause of ill health and death in Australia, and have been for some decades—largely replacing the infectious diseases of 50–100 years ago, such as pneumonia and tuberculosis (see 'Chapter 3.1 Burden of disease and injury in Australia').
In 2014–15, based on self-reported data from the NHS, more than 11 million Australians (50%) had at least one of eight selected chronic conditions (arthritis, asthma, back problems, cancer, chronic obstructive pulmonary disease, cardiovascular disease, diabetes mellitus, or a mental or behavioural condition) (ABS 2015e). Of these people, 5.3 million had two or more of the eight conditions (see 'Chapter 3.3 Chronic disease and comorbidities').
There is some good news in the chronic diseases story—for example, the death rates from coronary heart disease and stroke fell by 75% and 67% respectively between 1983 and 2013 (see 'Chapter 3.5 Coronary heart disease' and 'Chapter 3.6 Stroke'). However, some findings give cause for concern:
- In 2014–15, based on self-reported data from the NHS, incidence of coronary heart disease and acute coronary events was 1.7 times as high in men as in women (ABS 2015d).
- In 2014–15, again based on self-reported data from the NHS, an estimated 1.2 million Australians (5.1%) had diabetes (ABS 2015e) (see 'Chapter 3.7 Diabetes').
- The number of new cancer cases diagnosed (excluding common non-melanoma skin cancers) more than doubled between 1982 and 2016—from 47,400 to an expected 130,500. This increase can be partly explained by the ageing and increasing size of the population and by improvements in the technologies and techniques used to identify and diagnose cancer (see 'Chapter 3.4 Cancer').
Inequalities in health
Presenting a broad picture of health status can mask the fact that some groups in our community are not faring as well, including people living in rural and remote areas, the lowest socioeconomic groups, Indigenous Australians and people living with disability.
Health in rural and remote areas
Australians living in rural and remote areas tend to have lower life expectancy and higher rates of disease and injury than people living in Major cities (see 'Chapter 5.11 Rural and remote health').
In 2009–2011, people living in Remote and Very remote areas had mortality rates 1.4 times as high as people living in Major cities. For nearly all causes of death, rates were higher for people living outside Major cities, with people in Remote and Very remote areas faring the worst. For example, the rate of dying due to a land transport accident was more than 4 times as high in Remote and Very Remote areas as in Major cities.
People in regional and remote areas are more likely to die prematurely than their Major city counterparts. While fewer than 3 in 10 people (29%) live in regional and remote areas, deaths in these areas accounted for almost 2 in 5 (38%) of premature deaths in 2011–13.
The premature mortality rate among people living in Remote areas was 1.6 times as high as the rate among people in Major cities, and in Very remote areas it was 2.2 times as high (see 'Chapter 3.2 Premature mortality').
Disease prevalence is generally higher in rural and remote areas of Australia than in Major cities. In 2014–15, based on self-reported data from the NHS, people living in Inner regional and Outer regional/Remote areas of Australia were more likely than people in Major cities to have arthritis, asthma, COPD, and a number of other chronic health conditions (ABS 2015e).
People living in rural and remote areas are, on average, also more likely than their urban counterparts to engage in lifestyle behaviours that can lead to adverse health outcomes (such as smoking, insufficient physical activity, and risky alcohol consumption).
These poorer health outcomes may also reflect a range of social and other factors that can be detrimental to health, including a level of disadvantage with regard to educational and employment opportunities; income; and access to goods and services.
Socioeconomic groups
In general, the higher a person's income, education and/or occupation level, the healthier they tend to be (see 'Chapter 4.1 Social determinants of health' and 'Chapter 5.1 Health across socioeconomic groups').
On a range of health measures, people living in the lowest socioeconomic areas (that is, areas of most disadvantage) tend to fare worse than people living in the highest socioeconomic areas (that is, areas of least disadvantage). For example, according to AIHW analysis of the ABS Australian Health Survey, in 2011–12, people living in the lowest socioeconomic areas were 1.6 times as likely to have chronic kidney disease and 2.2 times as likely to have coronary heart disease as people living the highest socioeconomic areas.
Aboriginal and Torres Strait Islanders
Health outcomes for Aboriginal and Torres Strait Islander people have improved in recent years in a number of key areas, including life expectancy and child mortality (see 'Chapter 5.7 How healthy are Indigenous Australians?'). However, as a population group, they continue to experience greater health disadvantage—they are more likely to die at younger ages and to have a higher prevalence of many chronic health conditions.
Indigenous males born in 2010–12 could expect to live to 69.1 years—10.6 years less than non-Indigenous males. For females, the gap was 9.5 years (a life expectancy of 73.7 and 83.2 years, respectively) (ABS 2013). (See 'Chapter 5.8 Main contributors to the Indigenous life-expectancy gap'.)
There are large gaps between Indigenous and non-Indigenous Australians on many other health measures. For example, after adjusting for differences in age structure:
- according to the ABS 2012–13 Australian Aboriginal and Torres Strait Islander Health Survey (AATSIHS), 29% of Indigenous Australians rated their health as either 'fair' or 'poor', which was more than double the non-Indigenous rate of 14% (see 'Chapter 5.7 How healthy are Indigenous Australians?')
- Indigenous Australians have higher rates of diabetes: prevalence, hospitalisation and death rates are 3–4 times as high as for non-Indigenous Australians (see 'Chapter 3.7 Diabetes')
- according to the 2012–13 AATSIHS, 36% of Indigenous Australians (an estimated 228,000 people) have some form of disability (AIHW 2015c). Based on age-standardised rates of 44% and 29%, respectively, this is 1.5 times the rate experienced by non-Indigenous Australians (see 'Chapter 5.7 How healthy are Indigenous Australians?')
- Indigenous Australian women are twice as likely to die from complications of pregnancy or childbirth as non-Indigenous women (14 compared with 6.6 maternal deaths per 100,000 women, respectively, non age-standardised) (see 'Chapter 5.2 Trends and patterns in maternal and perinatal health')
- after adjusting for differences in age structure, in the period from 2009 to 2013, the mortality rate for Indigenous Australians who died from all potentially avoidable causes was more than 3 times the rate for non-Indigenous Australians (351 and 110 deaths per 100,000 population, respectively) (see 'Chapter 5.7 How healthy are Indigenous Australians?').
People living with disability
People with disability experience significantly poorer health than those without disability. In 2011–12, according to the ABS NHS, half (51%) of people aged 15–64 with severe or profound core activity limitation (that is, sometimes or always needing help with activities of self-care, mobility or communication) reported 'poor' or 'fair' health, compared with 5.6% for those without disability.
Further:
- about 1 in 5 people aged under 65 with severe or profound core activity limitation had arthritis (21%) compared with about 1 in 20 (5.3%) of people without disability
- people aged 15–64 with severe or profound core activity limitation were twice as likely as those without disability to be current daily smokers (31% versus 15%) and 1.7 times as likely as people without disability to be obese (43% versus 25%) (see 'Chapter 5.9 Health of Australians with disability').
Risk factors
Many chronic diseases share common lifestyle risk factors that are largely preventable—for example, tobacco smoking, excessive alcohol consumption and excess body weight. According to results of the Australian Burden of Disease Study, in 2011, a large proportion (31%) of the burden of disease experienced by the population could be prevented by reducing the exposure to modifiable risk factors.
The five risk factors included in the study that caused the most burden were tobacco use, high body mass, high alcohol use, physical inactivity and high blood pressure (see 'Chapter 3.1 Burden of disease and injury in Australia').
Monitoring risk factor trends is therefore crucial to help guide prevention programs, which will help reduce the future health burden of chronic disease on individuals and society (see 'Chapter 4 Determinants of health').
Smoking rates continue to fall
Smoking rates in Australia are still falling, continuing a long-term downward trend over the past 50 years that the OECD has described as 'remarkable progress' (OECD 2014).
In 2013, 13% of people aged 14 or older smoked daily, compared with 15% in 2010 and 24% in 1991 (see 'Chapter 4.7 Tobacco smoking'). This was one of the lowest smoking rates in the world; the OECD average daily smoking rate for people aged 15 and older was 20% (OECD 2015).
Drinking levels are lower
While excessive alcohol consumption remains a major health and social concern in Australia, the overall volume of alcohol people drink and the proportion of people who drink every day have fallen.
In 2013–14, Australians consumed 9.7 litres of pure alcohol per person aged 15 and over, compared with 10.8 litres in 2007–08. This new level was the lowest in 50 years (ABS 2015a) but is still higher than the OECD average of 8.8 litres per person in 2013 (OECD 2015).
Between 2010 and 2013, the proportion of people aged 14 and over who drank every day fell from 7.2% to 6.5% and the proportion of people who drank at levels putting them at lifetime risk of harm (more than two standard drinks per day on average) fell from 20% to 18% (see 'Chapter 4.6 Alcohol risk and harm').
Overweight and obesity
According to the 2014–15 NHS, an estimated 11 million people aged 18 and over (63% of Australian adults) were overweight or obese—4.9 million of whom were obese. Only about one-third (35%) of Australian adults were in the normal weight range (ABS 2015e).
While the proportion of overweight or obese adults rose from 56% to 63% between 1995 and 2011–12, there was a much smaller increase between 2011–12 and 2014–15 (62.8% to 63.4% respectively) (ABS 2015e).
In 2014–15, just over 1 in 4 (26%) of children aged 5–14, and nearly 4 in 10 (37%) of young people aged 15–24, were overweight or obese (ABS 2015d).
In 2013, Australia was the fifth most obese country in the OECD (28% of the population aged 15 and over), behind the United States (35%), Mexico (32%), New Zealand (31%) and Hungary (29%) (OECD 2015).
Nutrition and physical activity
A healthy diet and regular physical activity are important factors in maintaining a healthy weight. According to the 2014–15 NHS, the vast majority of adults (95%) (ABS 2015e) and children aged 5–14 (98%) do not eat the recommended daily serves of fruit and vegetables (ABS 2015d). (For further information on the recommended daily serves of fruit and vegetables, see the Australian Dietary Guidelines.)
In 2014–15, just over half (56%) of Australians aged 18–64 undertook sufficient physical activity per week. This proportion was little changed from 2011–12 (55%) (ABS 2015e).
How do we compare internationally?
There is a lot of good news on the health front in Australia—we have one of the highest life expectancies in the developed world; our overall burden of disease has fallen; and most of us rate our health as 'good' or better.
When ranked against other OECD countries, we rate better than average for mortality from coronary heart disease, cancers and suicide, and we have one of the lowest rates of tobacco smoking.
However, as highlighted in Table 1.3.1, there is room for improvement in a number of other areas.
Table 1.3.1 shows how Australia ranks against other OECD countries on a selected group of health measures. For rankings on other health measures, visit the OECD website.
| Indicator | OECD average | Australia | Group |
|---|---|---|---|
| Life expectancy at birth (males) | 77.8 | 80.1 | Best third |
| Life expectancy at birth (females) | 83.1 | 84.3 | Best third |
| Coronary heart disease mortality (per 100,000) | 117.4 | 98.2 | Middle third |
| Cancer mortality (per 100,000) | 205.6 | 197.7 | Middle third |
| Suicide rate (per 100,000) | 12.0 | 10.1 | Best third |
| Infant mortality rate (per 1,000 live births)(a) | 3.8 | 3.1 | Middle third |
| Low birthweight babies(b) | 6.6 | 6.2 | Middle third |
| Daily smoking in adults (% of people aged 15 and over) | 19.7 | 12.8 | Best third |
| Alcohol consumption (litres per person, aged 15 and over) | 8.8 | 9.9 | Middle third |
| Obesity (% aged 15 and over, combination of self-reported and measured data) | 19.0 | 28.3 | Worst third |
| Overweight/obesity among children (boys) | 24.3 | 22.0 | Middle third |
| Overweight/obesity among children (girls) | 22.1 | 24.0 | Worst third |
- The data for most countries are based on a minimum threshold of 22 week birthweight to remove the impact of different registration practices of extremely premature babies across countries.
- 'Low birthweight babies' refers to number of babies weighing less than 2,500 grams per 100 live births.
Notes
- Data for Australia reflect those in the OECD database and may differ from data presented elsewhere in this report.
- For mortality data, the rates have been directly age-standardised to the 2010 OECD population to remove variations arising from differences in age structures across countries and over time.
- Cancer rates are age-standardised and provided to the OECD by GLOBOCAN. GLOBOCAN estimates may differ from national estimates due to differences in methods.
Source: OECD 2015.
Where do I go for more information?
The remaining chapters in Australia's health 2016 provide comprehensive data and analysis on all of the topics mentioned. In addition, more information on the health status of Australians overall can be obtained from the ABS National Health Survey website. For more detailed data on nutrition and physical activity, visit the Australian Health Survey website. For more statistics on diabetes, cancer, burden of disease and a range of other health conditions, visit the AIHW website.
For more information on global health statistics, visit OECD health statistics 2015.
References
ABS (Australian Bureau of Statistics) 2013. Life tables for Aboriginal and Torres Strait Islander Australians, 2010–2012. ABS cat. no. 3302.0.55.003. Canberra: ABS.
ABS 2014a. Australian Aboriginal and Torres Strait Islander Health Survey: updated results, Australia, 2012–13. ABS cat. no. 4727.0.55.006. Canberra: ABS.
ABS 2014b. Australian historical population statistics, 2014. ABS cat. no. 3105.0.65.001. Canberra: ABS.
ABS 2014c. Deaths, Australia, 2013. ABS cat. no. 3302.0. Canberra: ABS.
ABS 2015a. Apparent consumption of alcohol, Australia, 2013–14. ABS cat. no. 4307.0.55.001. Canberra: ABS.
ABS 2015b. Causes of death, Australia, 2013. ABS cat. no. 3303.0. Canberra: ABS.
ABS 2015c. Deaths, Australia, 2014. ABS cat. no. 3302.0. Canberra: ABS.
ABS 2015d. National Health Survey: 2014–15, customised report. Canberra: ABS.
ABS 2015e. National Health Survey: first results, 2014–15. ABS cat. no. 4364.0.55.001. Canberra: ABS.
AIHW (Australian Institute of Health and Welfare) 2012. Risk factors contributing to chronic disease. Cat. no. PHE 157. Canberra: AIHW.
AIHW 2014a. Australia's health 2014. Australia's health series no. 14. Cat. no. AUS 178. Canberra: AIHW.
AIHW 2014b. Healthy life expectancy in Australia: patterns and trends 1998 to 2012. AIHW bulletin no. 126. Cat. no. AUS 187. Canberra: AIHW.
AIHW 2015a. Leading causes of death. Canberra: AIHW. Viewed 7 October 2015.
AIHW 2015b. Premature mortality in Australia 1997–2012. Canberra: AIHW. Viewed 8 October 2015.
AIHW 2015c. The health and welfare of Australia's Aboriginal and Torres Strait Islander peoples 2015. Cat. no. IHW 147. Canberra: AIHW.
AIHW 2015d. Trends in deaths. Canberra: AIHW. Viewed 7 October 2015.
AIHW 2016a. Australian Cancer Incidence and Mortality (ACIM) books. Canberra: AIHW. Viewed 11 February 2016.
AIHW 2016b. General record of incidence of mortality (GRIM) books. Canberra: AIHW. Visited 11 February, 2016.
Becker R, Silvi J, Ma Fat D, L'Hours A & Laurenti R 2006. A method for deriving leading causes of death. Bulletin of the World Health Organization 84(4):297–304.
OECD (Organisation for Economic Co-operation and Development) 2014. OECD health statistics 2014. How does Australia compare? Paris: OECD.
OECD 2015. Health at a glance 2015: OECD indicators. Paris: OECD.
.editable-text table.e-table-responsive .table-cell-mobile-header, .editable-text table.e-table-responsive--left .table-cell-mobile-header { table-layout: fixed; width: 60%; text-align: left; } /* make mobile header cells wide enough for text */