Indigenous Australians
There were an estimated 761,300 Aboriginal and Torres Strait Islander people in Australia as at 30 June 2017, or 3% of the total population. There are demographic differences between the Indigenous and non-Indigenous populations. For example:
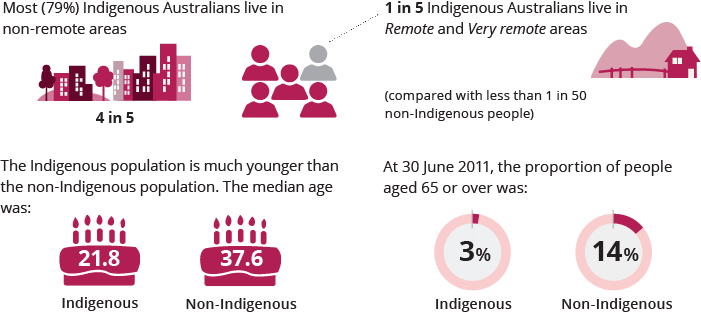
Indigenous households are less likely than other households to be lone-person households (14% compared with 25%), more likely to consist of two or more families (6% compared with 2%) and more likely to contain 5 or more people (23% compared with 10%).
Indigenous communities pass on knowledge, tradition, ceremony and culture from one generation to the next through language, performance, protection of significant sites, storytelling and the teachings of Elders. In 2014–15, 62% of Indigenous Australians aged 15 and over identified with a clan, tribal or language group, and 74% recognised an area as homelands or traditional country.
Indigenous Australians experience widespread socioeconomic disadvantage and health inequality. Factors like discrimination and racism, violence, alcohol and drug use and high psychological distress can negatively affect social and emotional wellbeing. Poor social and emotional wellbeing, in turn, can have negative impacts on employment, income, living conditions and opportunities.
Indigenous children twice as likely to be developmentally vulnerable
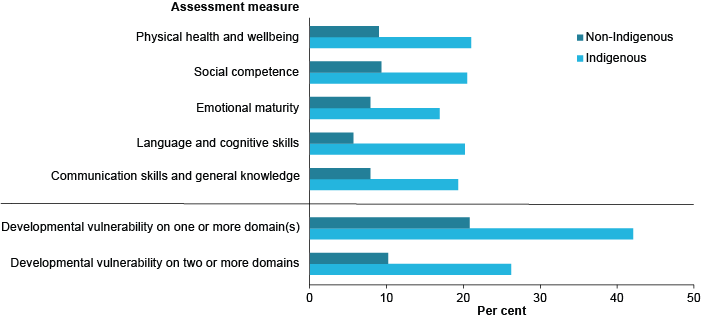
Nationally, in 2015, around 42% of all Indigenous children in their first year of full-time schooling were categorised as developmentally vulnerable on one or more of the five key areas of early childhood development (or domains), compared with 21% of all non Indigenous children.
Indigenous children living in Very remote areas were 1.5 times as likely as Indigenous children living in Major cities to be assessed as vulnerable on one or more of the domains, and were the least likely to have improved over the last 6 years (for all remoteness areas).
Proportion of developmentally vulnerable children, by assessment domain and vulnerability summary measures, by Indigenous status, 2015
But the gap is getting smaller
The rate of developmental vulnerability for all Indigenous children dropped from 47% in 2009 to 42% in 2015. Some encouraging progress has been made to reduce the gap in early childhood development outcomes between Indigenous and non-Indigenous children over time.
Find out more: Chapter 7.4 'Closing the gap in Indigenous education' in Australia's welfare 2017.
Literacy and numeracy targets out of reach
Indigenous students in Years 3, 5, 7 and 9 consistently achieve lower scores in the National Assessment Program—Literacy and Numeracy (NAPLAN) tests than non-Indigenous students. The current performance and trajectory suggest that Indigenous students are not on track to meet almost every 2018 target. Also, literacy and numeracy scores decline substantially with increasing remoteness.
Any improvements in Indigenous youth education targets?
The good news is that progress is on track to halve the gap in Year 12 attainment by 2020. The proportion of Indigenous people aged 20-24 who had attained a Year 12 or equivalent level of education has increased significantly, from 45% in 2008 to 62% in 2014-2015 (compared with 86% of non-Indigenous Australians).
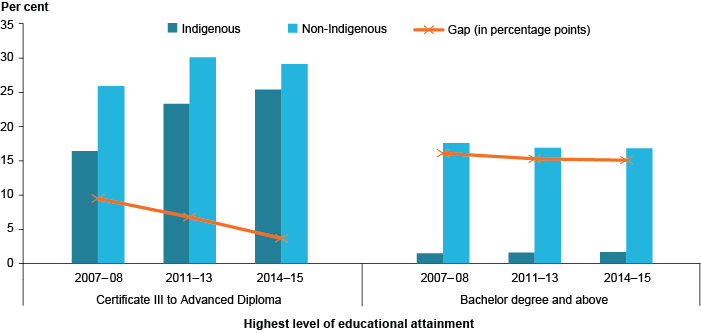
The gap between Indigenous and non-Indigenous people aged 20-24 who had obtained a post school qualification has not narrowed over time; however the proportion of Indigenous people in this age range who have done so has doubled since 2002. In 2014-15, the gap in attainment rates for Certificate III through to Advanced Diploma was almost eliminated, but a large gap remained for a Bachelor degree or higher.
Post-school qualification at Certificate III level to Advanced Diploma, and Bachelor degree and above, for people aged 20–24 by Indigenous status, 2007–08, 2011–13 and 2014–15
Find out more: Chapter 7.4 'Closing the gap in Indigenous education' in Australia's welfare 2017.
Indigenous people over-represented in the child protection and justice systems
In 2015-16, Indigenous children aged 0-17 received child protection services at a rate around 7 times that for non-Indigenous children, and they were 10 times as likely to be in out-of-home care.
While Indigenous Australians aged 10-17 account for less than 6% of all Australians of that age, on an average day in 2015-16:
- 48% of young people under youth justice supervision were Indigenous
- more than half (59%) of young people in youth detention were Indigenous.
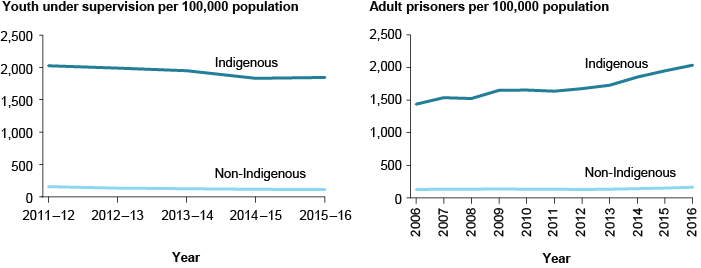
As at 30 June 2016, over one-quarter (27%) of the total Australian prison population was Indigenous— meaning that the Indigenous age-standardised imprisonment rate was 13 times that for non-Indigenous Australians.
Youth under supervision and adult imprisonment rates, by Indigenous status
Find out more: Chapter 7.3 ‘Community safety among Indigenous Australians’ in Australia’s welfare 2017.
Higher rates of unemployment and lower earnings
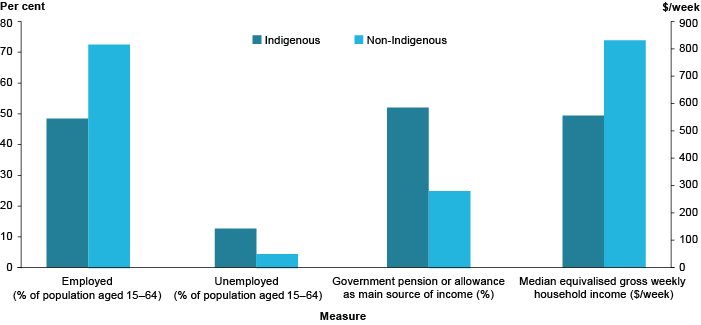
Indigenous Australians have higher unemployment rates than non-Indigenous Australians; they also earn lower household incomes and are more likely to receive a government pension or allowance, as their main source of income.
Employment and unemployment rates (people aged 15-64), proportion of people with a government pension or allowance as their main source of income (aged 15 and over) and median equivalised gross weekly household income ($ per week), by Indigenous status, 2014-15
But some improvement
The proportion of Indigenous people aged 18 and over with incomes in the bottom 20% of equivalised gross weekly household incomes decreased from 49% in 2008 to 37% in 2014-15. Despite this, Indigenous adults were still more than twice as likely as non-Indigenous adults to be in the bottom 20%.
Find out more: Chapter 7.5 'Income and employment for Indigenous Australians' in Australia's welfare 2017.
Indigenous home ownership rates half that of other households
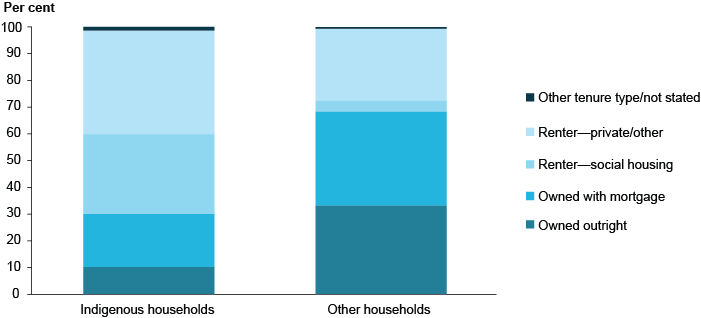
Compared with other households, Indigenous households are:
- half as likely to own their own home
- more than twice as likely to rent (public or private)
- more than 3 times as likely to live in overcrowded dwellings
- more than 7 times as likely to live in social housing.
There was little change in the proportion of Indigenous households that owned their home between 2008 and 2014-15.
Indigenous people are over-represented in homelessness services. In 2015-16, they made up 24% of clients accessing these services, a rate more than 9 times that for non Indigenous Australians.
Housing tenure, by Indigenous status of the household, 2014-15
Find out more: Chapter 7.1 'Community factors and Indigenous wellbeing' in Australia's welfare 2017.
Regional disparity for Indigenous people
Indigenous Australians experience disadvantage and inequality across a wide range of measures. Disparity/differences also exist within the Indigenous population—with people living in Remote/Very remote areas faring relatively worse on several measures.
For example, compared with Indigenous people/households living in non-remote areas, Indigenous people/households in Remote and Very remote areas are:
- 2.7 times as likely to live in overcrowded dwellings
- 2.5 times as likely to live in social housing
- 1.9 times as likely to live in a house that does not meet acceptable standards
- half as likely to own their own home.
How do earnings differ across remoteness areas?
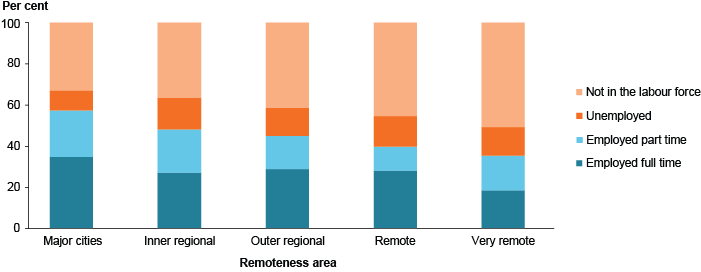
Compared with Indigenous people/households in Major cities, Indigenous people/households in Very remote areas earn $271 less a week, are 1.4 times as likely to be unemployed, are 1.5 times as likely to receive a government pension or allowance as their main source of income, and are far less likely to be working full or part time.
Labour force status, Indigenous people aged 15-64, by remoteness area, 2014-15
Find out more: Chapter 7 'Indigenous Australians' in Australia's welfare 2017.
Cultural and community positives for Indigenous Australians living remotely
While Indigenous people living in Remote and Very remote areas experience disparity across several areas compared with Indigenous people living in non-remote areas, they are more likely to report higher rates of community functioning and culture, which support wellbeing and build resilience.
Compared with Indigenous people living in non-remote areas, Indigenous people aged 15 and over in Remote and Very remote areas are:
- more likely to speak an Australian Indigenous language (55% compared with 8%)
- more likely to identify with a clan, or a tribal or language group (79% compared with 58%)
- more likely to have been involved in Indigenous cultural events, ceremonies or organisations in the last 12 months (82% compared with 57%)
- less likely to have used other drugs (drugs other than alcohol and tobacco) in the last 12 months (21% compared with 33%)
- less likely to have experienced homelessness (18% compared with 32%).

Find out more: Chapter 7.1 'Community factors and Indigenous wellbeing' in Australia's welfare 2017.


