Home ownership and housing tenure
Citation
AIHW
Australian Institute of Health and Welfare (2024) Home ownership and housing tenure, AIHW, Australian Government, accessed 27 July 2024.
APA
Australian Institute of Health and Welfare. (2024). Home ownership and housing tenure. Retrieved from https://www.aihw.gov.au/reports/australias-welfare/home-ownership-and-housing-tenure
MLA
Home ownership and housing tenure. Australian Institute of Health and Welfare, 12 July 2024, https://www.aihw.gov.au/reports/australias-welfare/home-ownership-and-housing-tenure
Vancouver
Australian Institute of Health and Welfare. Home ownership and housing tenure [Internet]. Canberra: Australian Institute of Health and Welfare, 2024 [cited 2024 Jul. 27]. Available from: https://www.aihw.gov.au/reports/australias-welfare/home-ownership-and-housing-tenure
Harvard
Australian Institute of Health and Welfare (AIHW) 2024, Home ownership and housing tenure, viewed 27 July 2024, https://www.aihw.gov.au/reports/australias-welfare/home-ownership-and-housing-tenure
Get citations as an Endnote file: Endnote

Secure and affordable housing is fundamental to the wellbeing of Australians. Home ownership continues to be a widely held aspiration in Australia, as it affords owners with security of housing tenure and both long–term social and economic benefits (AIHW 2023). There has been ongoing public conversation about the rate of home ownership and housing affordability. For more information see Housing affordability and Housing assistance.
In 2021, there were nearly 9.8 million households in Australia (ABS 2022a). Where household tenure was known:
- 67% (6.2 million households) were home owners
- 32% (2.9 million households) without a mortgage
- 35% (3.3 million households) with a mortgage
- 31% (2.9 million households) were renters
- 26% (2.4 million households) were renting from private landlords
- 3.0% (277,500 households) from state or territory housing authorities
- 2.4% (223,600 households) from other landlords.
- 2.1% (192,200 households) were other tenure, including households which are not an owner with or without a mortgage, or a renter (ABS 2022a).
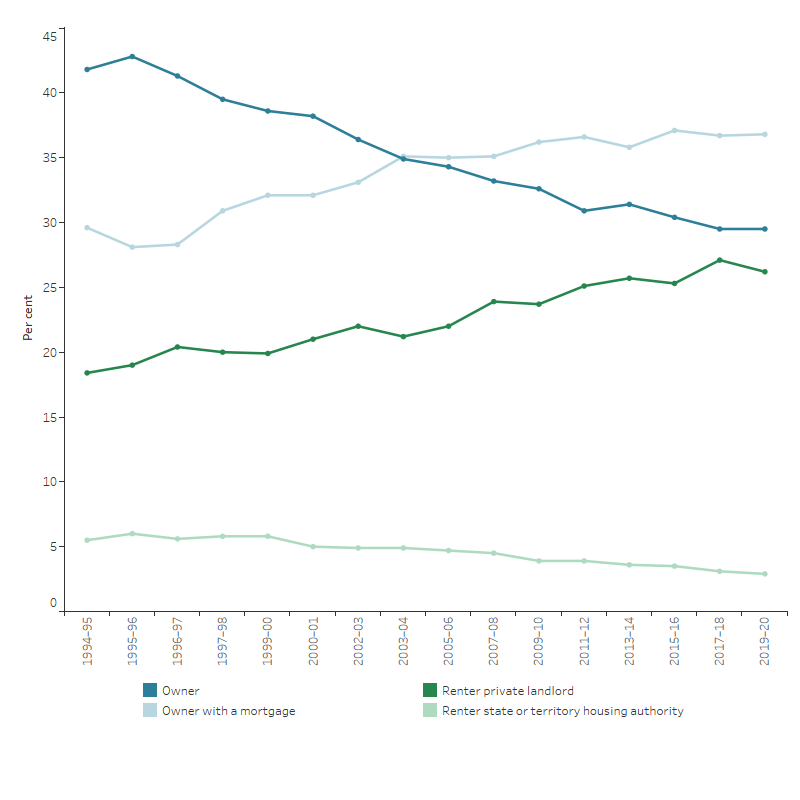
Although Australian Bureau of Statistics (ABS) 2021 Census of Population and Housing (Census) data provides the most comprehensive view of housing tenure among Australian households, it is only conducted once every 5 years. During non-Census periods, other survey data can be used to monitor changes in housing circumstance. The survey of Income and Housing (conducted every two years) shows that in the 20 years to 2019–20, there was a decline in the proportion of households owning their home without a mortgage and increases in households with a mortgage and in private rental agreements (Figure 1) (ABS 2022b).
Figure 1: Proportion of households by housing tenure type, 1994–95 to 2019–20
Proportion of households by housing tenure type, 1994–95 to 2019–20
This line graph shows that the proportion of owners without a mortgage declined from about 42% in 1994–95 to 30% in 2019–20. This line graph shows that the proportion of owners with a mortgage increased from about 30% in 1994–95 to 37% in 2019–20. This line graph shows that the proportion of renters renting from private landlords increased from about 18% in 1994–95 to 26% in 2019–20. This line graph shows that the proportion of renters renting from state or territory housing authorities declined slightly from about 6% in 1994–95 to 3% in 2019–20.

Note: Values have been interpolated for non-survey years.
Source: ABS 2022b
Trends in home ownership
Home ownership data from the 2021 Census show a home ownership rate of 67%, down from 70% in 2006. While the home ownership rate remained around 67–70% from the early 1970’s, the rate for different age groups has varied markedly over this time. The rates among different age groups can be determined using the age of the Census household reference person. The following analysis uses the number of private dwellings by age of household reference person and tenure type to calculate the proportion of homeowners for specific age groups from total households (excluding not stated).
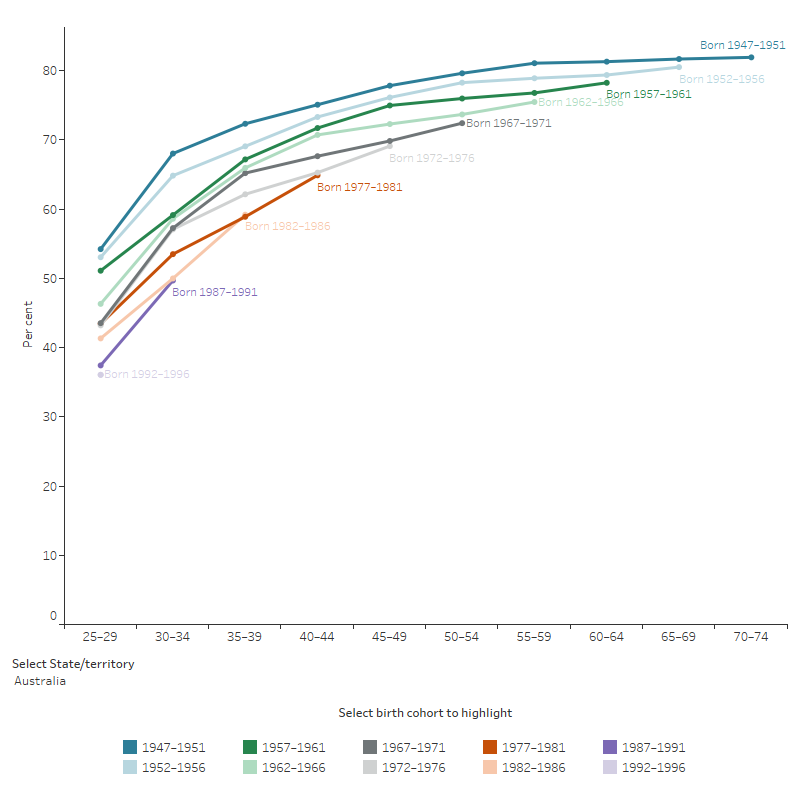
The home ownership rate of 30–34 year old’s was 64% in 1971, decreasing 14 percentage points to 50% in 2021 (Unpublished, AIHW analysis of Census data). For Australians aged 25–29, the decrease was similar – 50% in 1971, compared with 36% in 2021. Home ownership rates have also gradually decreased among people nearing retirement. Since 1996, home ownership rates for the 50–54 age group decreased by 8 percentage points over 25 years (80% to 72%) (Figure 2).
To further illustrate these changes in home ownership rates, data can be presented by birth cohorts (Figure 2). Home ownership rates of Australians born during 1947–1951 increased from 54% in 1976 (when they were aged 25–29) to 82% 45 years later in 2021 (when they were aged 70–74). By contrast, the home ownership rate of those born during 1992–1996 was 36% in 2021 (when they were aged 25–29), 18 percentage points lower than the 1947–1951 cohort at the same age.
Nationally, the rate of home ownership was lower for almost each successive birth cohort since the 1947–1951 birth cohort (Figure 2). The home ownership rate has been higher in only two instances; 0.2 percentage points for the 1977–1981 cohort in the 25–29 age group and 0.3 percentage points for the 1982–1986 cohort in the 35–39 age group. In the most recent results, the home ownership rates in birth cohorts 1972–1976, 1977–1981 and 1982–1986 increased to similar levels as their preceding birth cohort. However, rates were still lower compared with older birth cohorts.
Figure 2: Home ownership rate by birth cohort and age group
Home ownership rate, by birth cohort and age group
This line graph shows that the home ownership rates of those in the birth cohort 1947–51, who were 25–29 in 1976, increased from 54% in 1976 to 82% by 2021, or 45 years later when they were 70–74. In contrast to the 1947–1951 cohort, the home ownership rate of those 25–29 years old in 2021 (the 1992–1996 birth cohort) was 36%, 18 percentage points lower than the 1947–1951 cohort at the same age. In every age group, the rate of home ownership is lower for almost each successive birth cohort since the 1947–1951 birth cohort.

Notes:
- Analysis excludes not stated.
- Home ownership rates reflect the year the household reference person was born.
- Census data; data for 1991 has been extrapolated.
Source: Unpublished, AIHW analysis of ABS data.
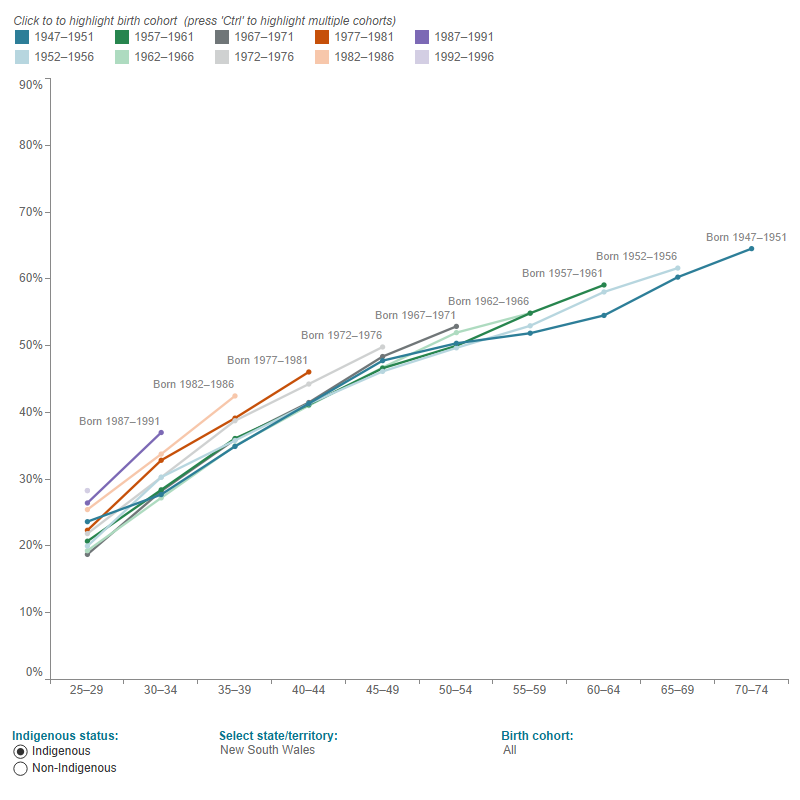
The home ownership rate for Aboriginal and Torres Strait Islander (First Nations) people in 2021 was 42%. This was the highest rate ever reported for First Nations people, with home ownership rates steadily increasing from 25% in 1981. Broadly, the rate of home ownership for First Nations people has increased for each successive birth cohort (Figure 3), however, rates for First Nations people were consistently around 20 percentage points lower than home ownership rates for non-Indigenous Australians across all birth cohorts and age groups.
Figure 3: Indigenous home ownership (%), by birth cohort and age group
This line graph shows that the home ownership rates of Indigenous Australians in the birth cohort 1947–1951, who were 30–34 years old in 1976, increased from 26% in 1976 to 61% by 2021, or 45 years later when they were 75–79. In contrast to the 1947–1951 cohort, the home ownership rate of those 30–34 years old in 2021 (the 1987–1991 birth cohort) was 34%, 8 percentage points higher than the 1947–1951 cohort at the same age. In every age group, the rate of home ownership is higher for almost each successive birth cohort since the 1947–1951 birth cohort.

Notes
- Analysis excludes not stated.
- Home ownership rates reflect the year the household reference person was born.
- Data are small for some states/territories and some age groups within birth cohorts; data points have been suppressed where the numerator is less than 20.
- Comparisons over time should be approached with caution as trends may be affected by changes in Indigenous identification over time.
Source: Unpublished, AIHW analysis of ABS data.
Financial support for home buyers
Governments provide financial support to assist first home buyers, low-income households, First Nations people, and vulnerable people to buy a house. The four main types of support available to home buyers are Home purchase assistance, First Home Owner Grant scheme, First Home Super Saver Scheme and Home Guarantee Scheme.
Home purchase assistance provides financial assistance, such as direct lending, concessional loans, and mortgage relief, to eligible low-income households to improve their access to, and to maintain home ownership. Households may receive more than one type of home purchase assistance (AIHW 2023).
First Home Owner Grant Scheme, introduced nationally on 1 July 2000, is funded by the state and territory governments and administered under their legislation. A one–off grant is payable to low–income first homeowners who apply and satisfy eligibility criteria. Examples are that at least one applicant must be a permanent resident or Australian citizen, each applicant must be at least 18 years of age, and temporary residents do not qualify to receive the grant (Australian Government 2020).
The Indigenous Home Ownership Program facilitates home ownership for First Nations people by providing access to affordable home loan finance. The program aims to address barriers to home ownership by providing access to knowledge, skills and networks to support home buyers and owners (IBA 2023).
First Home Super Saver Scheme, introduced by the Australian Government in the 2017–18 Federal Budget, supports first home buyers who meet the eligibility criteria to save money for a house deposit using their superannuation fund. As of July 2022, first home buyers have been able to voluntarily contribute up to $15,000 in any one financial year, up to a total of $50,000. They receive the tax benefit of saving through their superannuation contribution arrangements (ATO 2024).
Home Guarantee Scheme (HGS), comprises the First Home Guarantee (FHBG), the Family Home Guarantee (FHG), and the Regional First Home Buyer Guarantee (RFHBG). For each program, part of the home loan is guaranteed by the Commonwealth, through Housing Australia. Under the First Home Guarantee, an eligible first homebuyer can purchase a property with a deposit of as little as five per cent, while through the Family Home Guarantee a single parent with dependents can purchase a home with a deposit of as little as two per cent.
The Help to Buy program will assist low to middle income earners into home ownership using shared equity. Legislation to establish the program is before the Senate, as at July 2024. Once legislation has passed, it will be managed by Housing Australia.
In 2022–23, around 36,900 instances of home purchase assistance were provided across Australia. Of these:
- over one-quarter (26% or 9,700) of the main applicants receiving assistance were aged 35–44
- over one-quarter (26%) of recipients earned a gross income that was below the national minimum wage ($812.60 per week)
- 57% (or 21,000) of households receiving home purchase assistance were in Major cities, 24% (8,900) in Inner regional areas and 11% (4,200) in Outer regional areas. Only a small proportion were in Remote (3.8% or 1,400) or Very remote (3.8% or 1,400) areas (AIHW 2024).
Lending commitments to owner occupier first time home buyers increased, from around 81,650 commitments in the 12 months to May 2017 to 120,500 in the 12 months to March 2024 (ABS 2024c).
Trends in the private rental market
The proportion of households renting – which also includes renting from state or territory authority, community housing provider, person not in the same household, other landlord types, dwellings occupied rent free or under a life tenure scheme – has had a greater impact on younger households over recent years. There has been a sharper increase in the proportion of young Australians renting compared with older Australians (Figure 4).
Figure 4: Proportion of households renting, by age of household reference person, 1996 to 2021
This vertical bar graph shows that the proportion of households who rent in the private rental market has increased between 1996 and 2021. In 2021, 60% of households where the reference person was under 35 years old, 34% of households where the reference person was between 35 and 54 years old, and 21% of households where the reference person was 55 years old and over were renters. In 1996, the renters in the corresponding age group were 55%, 26% and 18% respectively.

Notes
- Households who rent include those renting from: Real estate agent, State or Territory housing authority, Community housing provider, Person not in same household, Other landlord type, Landlord type not stated. It also includes dwellings being occupied rent free and dwellings being occupied under a life tenure scheme.
- Analysis excludes Tenure type not stated.
Source: Unpublished, AIHW analysis of Census data.
What factors are influencing these changes over time?
The price of housing, changing household demographics and population increases have influenced home ownership trends and a shift from home ownership to renting privately. They have also influenced changes to the dwelling type needs of households (ABS 2017; CAF 2023; Parliamentary Library 2019).
House prices
Economic factors, such as changes in house prices, have influenced the changes in home ownership over time (Parliamentary Library 2019). The mean price of residential dwellings has increased by more than 60% over eight years, from $611,600 in the December 2015 quarter, to $933,800 in the December 2023 quarter (ABS 2024a).
Family and household composition
Family composition and marital status are related to housing tenure (Baxter and McDonald 2005; Stone et al. 2013). Over recent decades, the number of single-people households and single-parent households have increased and as a result, the average household size has decreased. These household types tend to have lower home ownership rates than other household types (Parliamentary Library 2019). In 2017–18, 47% of single-parent households were renting, an increase from 42% in 2007–08. While changing household composition may be related to an increase in the proportion of people living in private rental dwellings, the percentage of couples with children who rented privately also increased from 20% to 24% during this 10-year period (ABS 2022b; Warren and Qu 2020).
Population growth
Population increases in Australia are driving demand for housing, other services, and infrastructure (CAF 2023). Perth (3.6%) and Melbourne (3.3%) had the highest growth rates of the capital cities in 2022–23 (ABS 2024b). Overseas migration has contributed to increased housing demand (Daley et al. 2018). Most immigrants move to major cities, leading to an increase in demand for housing in these areas. International students have also had an impact on the private rental market, predominantly in major cities (Parkinson et al. 2018). The subsequent pressure on housing stocks in these areas highlights the need for coordinated and well considered urban planning strategies.
Changes in dwelling types
The types of dwellings Australians live in has changed over time. The proportion of households occupying separate houses (see glossary) has decreased in the past 25 years, from 76% of all households in 1996 to 71% in 2021, offset by increases in semi-detached and townhouse households. In 2021, around 13% of households lived in semi–detached row or terrace and townhouses, up from 8% in 1996. Around 15% of households lived in flats or apartments in 2021, an increase from 13% in 1996 (ABS 2001, 2022a).
Where do I go for more information?
For more information on home ownership and housing tenure, see:
ABS (Australian Bureau of Statistics) (2001) 2001 Census All persons QuickStats, ABS website, accessed 16 April 2024.
ABS (2017) Census of Population and Housing: Reflecting Australia – stories from the Census, 2016, accessed 16 April 2024.
ABS (2022a) Housing: Census 2021 , ABS website, accessed 16 April 2024.
ABS (2022b) Housing Occupancy and Costs, 2019–20 financial year, ABS website, accessed 16 April 2024.
ABS (2024a) Total Value of Dwellings, December quarter 2023, ABS website, accessed 16 April 2024.
ABS (2024b) Regional Population, 2022–23 financial year, ABS website, accessed 16 April 2024.
ABS (2024c) Lending Indicators March 2024, ABS website, accessed 16 April 2024.
Australian Government (2020), First home Owner Grant Scheme, Australian Government website, accessed 16 April 2024.
AIHW (Australian Institute of Health and Welfare) (2024) Housing Assistance in Australia, AIHW website, accessed 3 July 2024.
ATO (Australian Tax Office) (2024) First home super saver scheme, ATO website, 16 April 2024.
Baxter J and McDonald P (2005) Why is the rate of home ownership falling in Australia? [PDF 152KB] Australian Housing and Urban Research Institute (AHURI) Research and Policy Bulletin issue no. 52, Melbourne.
Council of the Australian Federation (CAF) (202 3) COAG meeting communiqué, 12 December 2018, Australian Government website, accessed 18 April 2024.
Daley J, Coates B and Wiltshire T (2018) Housing Affordability: re–imagining the Australian Dream, Report no. 2018–04, Grattan Institute Melbourne.
Housing Australia (2024) Family Home Guarantee, Housing Australia website, accessed 16 April 2024.
IBA (Indigenous Business Australia) (2021) Indigenous Business Australia Annual report 2020–21, Canberra.
Parkinson S, James A and Kiu E (2018) Navigating a changing private rental sector: opportunities and challenges for low-income renters, AHURI final report no. 302, Melbourne.
Parliamentary Library (2019) Declining home ownership rates in Australia, Parliamentary Library Briefing Book: Key issues for the 46th Parliament, accessed 27 June 2024.
Stone W, Burke T, Hulse K and Ralston L (2013) Long-term private rental in a changing Australian private rental sector, AHURI final report no. 209, Melbourne.
Warren D and Qu L (2020) Australian Institute of Family Studies (AIFS), Families Then & Now: Housing, Research Report–July 2020, Melbourne AIFS, accessed 16 April 2024.


