
Living with illness or injury (non-fatal)
53%
of total burden
Dying prematurely (fatal)
47%
of total burden
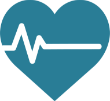
Living with illness or injury (non-fatal burden) caused more total disease burden than dying prematurely (fatal). There has been a shift from fatal to non-fatal burden being the biggest contributor to total burden between 2003 and 2018, driven by fewer premature deaths.
Figure 1: Proportion (%) of total burden due to fatal and non-fatal burden among Indigenous Australians in 2003 and 2018
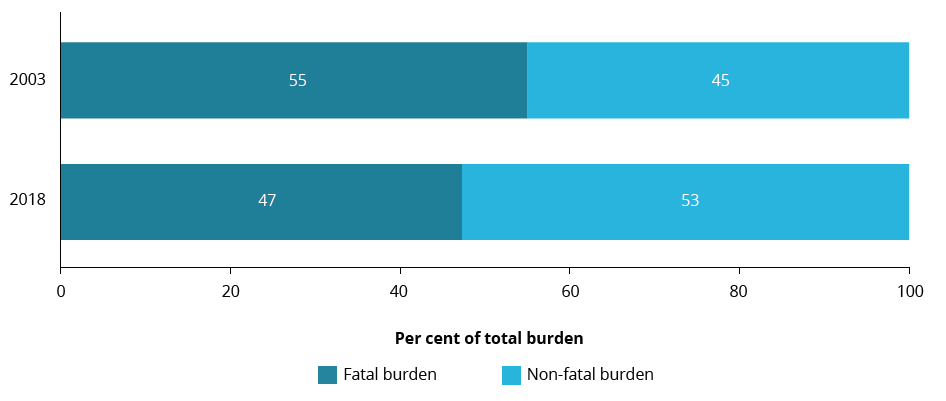
Substantial drop in fatal burden
Over the 15-year period from 2003 to 2018, after adjusting for population growth and ageing, there was a 27% decline in fatal burden, with non-fatal burden rates remaining stable. This meant that the total burden decreased by 15%.
Figure 2: Change between 2003 and 2018 in the age-standardised total burden (DALY), fatal burden (YLL), and non-fatal burden (YLD) rate (per 1,000 people) for Indigenous Australians
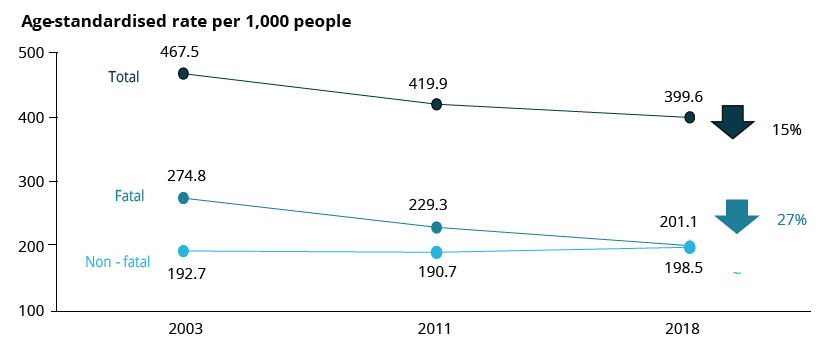
Chronic diseases and injury cause most of the burden
In 2018, the 5 disease groups that caused the most burden among Indigenous Australians were mental & substance use disorders, injuries (which includes suicide), cardiovascular diseases, cancer, and musculoskeletal conditions.
Figure 3: Proportion (%) of total burden, and fatal and non-fatal component of total burden, for the leading 5 disease groups among Indigenous Australians in 2018
Together these disease groups accounted for almost two-thirds (63%) of the total burden. With the exception of acute injuries, these are considered to include chronic, or long-lasting, conditions. The mental & substance use disorders disease group contributed the most burden across all years of the study.
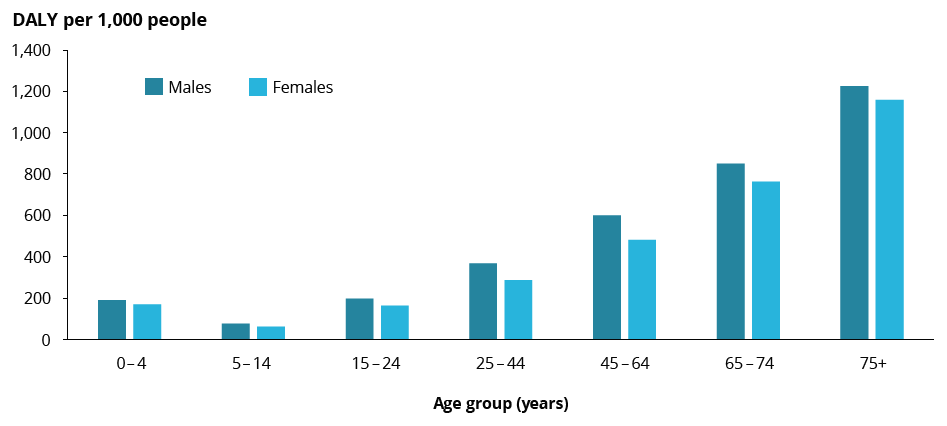
Rate of burden higher for males
Indigenous males experienced a greater rate of total burden than Indigenous females in all age groups. In 2018, males suffered 1.4 times the rate of fatal burden (238 YLL per 1,000 people) experienced by females (167 YLL per 1,000). Males suffered more than three times the amount of burden due to alcohol use disorders (ranked second in males) and suicide & self-inflicted injuries (ranked fourth in males), and almost twice the burden due to coronary heart disease compared with females. Females experienced more burden from anxiety (ranked second in females) and depressive disorders (ranked fourth in females) compared with males.
Figure 4: Rate of total burden (DALY per 1,000 people), by sex and age group, Indigenous Australians, 2018
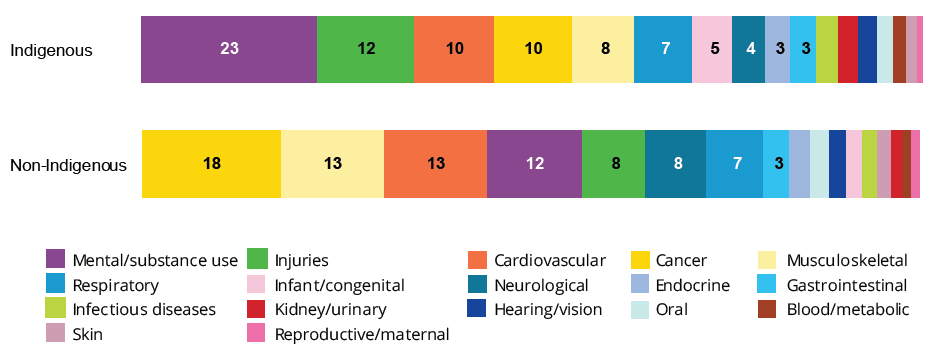
 Ranking of the causes of burden vary for Indigenous and non-Indigenous Australians
The various disease groups made different contributions to the overall burden for Indigenous and non-Indigenous Australians. Mental & substance use disorders and injuries were the leading contributors to DALY for Indigenous Australians, but made a smaller contribution among non-Indigenous Australians. Similarly, the leading contributors to DALY for non-Indigenous Australians, cancer and musculoskeletal conditions, contributed a smaller proportion of the total for Indigenous Australians.
Figure 5: Contribution (%) of disease groups to total burden (DALY), by Indigenous status, 2018
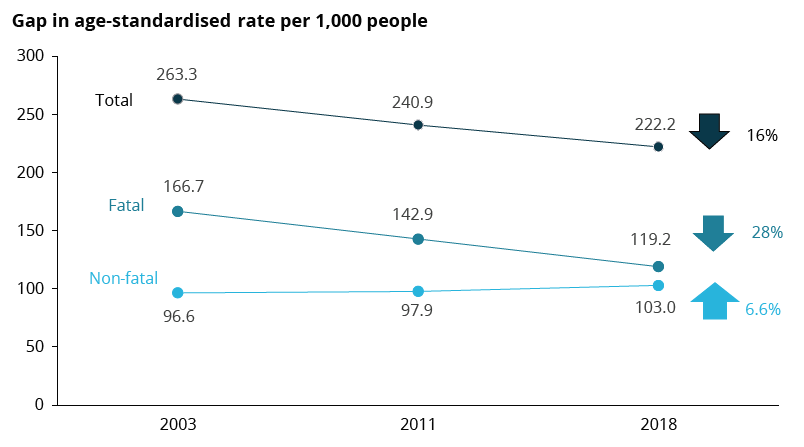
Gap in burden has narrowed
After removing differences in population size and age structure, the absolute gap in burden between Indigenous and non-Indigenous Australians decreased between 2003 and 2018 (DALY rate differences of 263 and 222 per 1,000 people), although the relative gap remained stable (rate ratio of 2.3 in each year). This was largely driven by a narrowing of the gap for fatal burden, which decreased by 28% between 2003 and 2018. The gap in non-fatal burden increased slightly during this period, by 6.6%.
Figure 6: Change between 2003 and 2018 in the gap in age-standardised total burden (DALY), fatal burden (YLL), and non-fatal burden (YLD) rate (per 1,000 people) between Indigenous and non-Indigenous Australians
Almost half of disease burden is potentially preventable
In 2018, 49% of the burden of disease in Indigenous Australians could have been prevented by avoiding exposure to the modifiable risk factors examined in this study. The risk factors contributing the most burden in 2018 were tobacco use (12%), alcohol use (10%), overweight (including obesity) (9.7%), illicit drug use (6.9%) and dietary factors (6.2%).
Tobacco use was the leading risk factor for both males and females and contributed the most to fatal burden, with over 800 deaths (23% of all deaths) in 2018. Alcohol use contributed the most (9.2%) to non-fatal burden.
Figure 7: Proportion (%) of total, fatal and non-fatal burden attributable to the leading 5 risk factors among Indigenous Australians in 2018
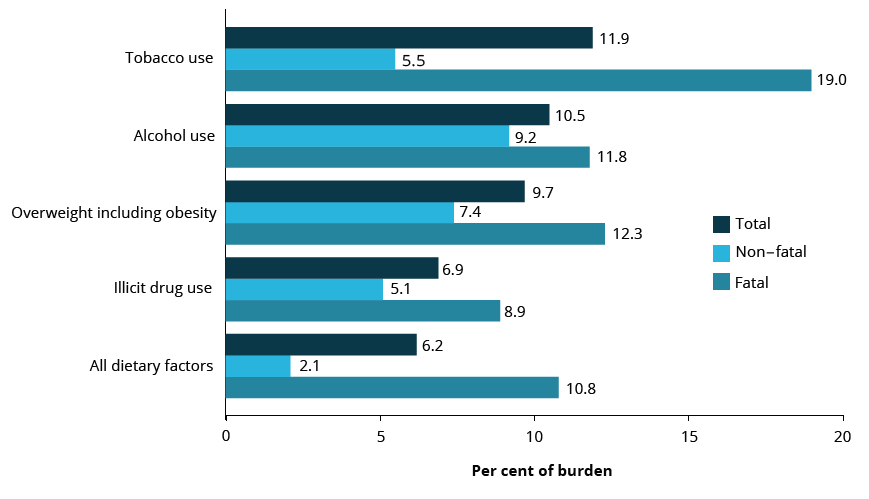
Note: Risk factor contributions in this figure can not be added together to estimate totals, due to interactions between factors.
Most of life is spent in good health
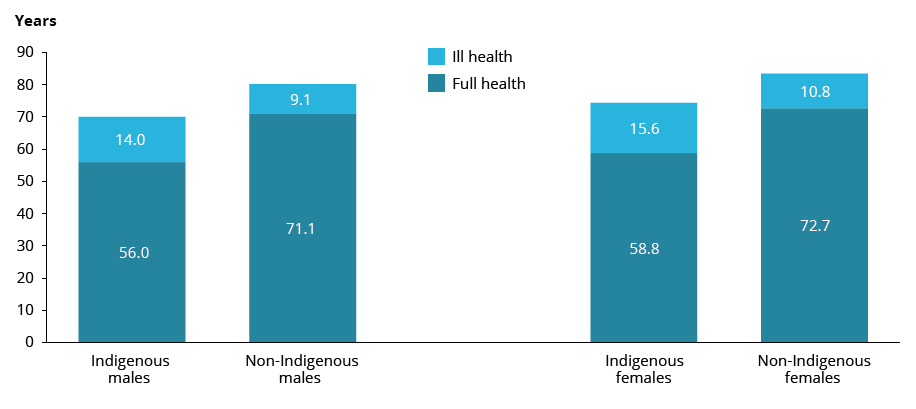
Indigenous Australians are, on average, spending most of their lives in full health (meaning no disease or injury; also referred to as health-adjusted life expectancy (HALE)).
Indigenous males and females born in 2018 could expect to live around 80% their lives in full health — 56.0 years of the 70.0 years of average life expectancy for males, and 58.8 years of the 74.4 years of average life expectancy for females. The gap in HALE at birth between Indigenous and non-Indigenous Australians in 2018 was 15.2 years for males and 13.9 years for females.
Figure 8: Expected years (at birth) lived in full health and ill health, by sex and Indigenous status, 2018
 Main contributors to burden change over the life course
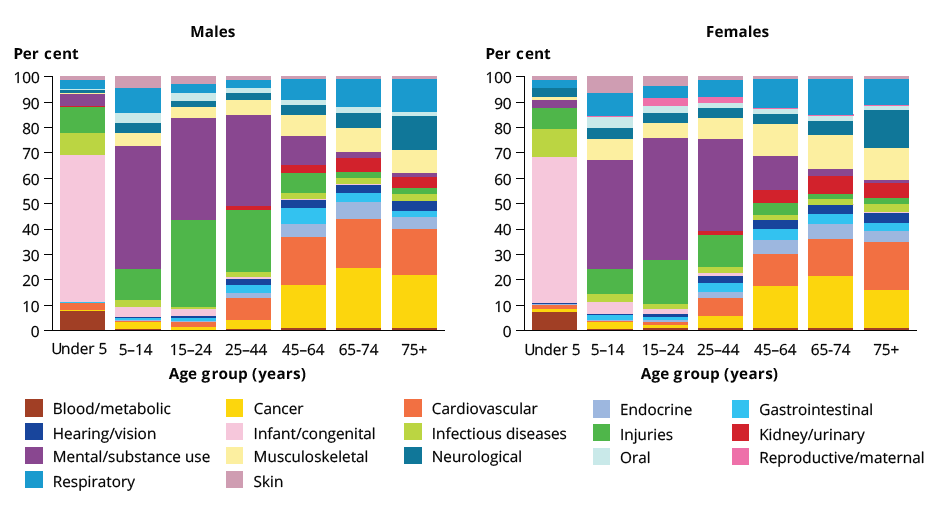
Indigenous Australians experienced major health loss from different types of disease groups and specific diseases throughout the life course.
In infancy and young childhood, infant & congenital conditions were the predominant cause of burden. Mental & substance use disorders and injuries (including suicide) were the main causes of burden for late childhood, adolescence and adulthood (to age 44), although injuries caused more burden in Indigenous males than Indigenous females.
Cardiovascular diseases and cancer started to emerge as major causes of burden among Indigenous males and females from around age 45, and continued to contribute substantially to disease burden in older Indigenous Australians. The contribution of neurological and endocrine disorders also increased with age, with neurological disorders responsible for 14% of the burden in people aged 75 and over.
Respiratory diseases affected all age groups, accounting for between 3% and 14% of total burden in Indigenous males and females across age groups. Musculoskeletal conditions (back pain & problems) affected all age groups from age 5, accounting for between 4% and 13% of total burden in Indigenous males and females across age groups.
Figure 9: Contribution (%) of disease groups to total burden (DALY) for Indigenous Australians, by sex and age group, 2018
 Leading specific causes of burden changing over time
When considering individual diseases, coronary heart disease was the leading cause of burden among Indigenous Australians, and also showed the largest reduction in total burden over time—from 55 to 29 DALY per 1,000 people between 2003 and 2018. This reduction was mainly driven by large declines in fatal burden.
A decline in total burden (based on age-standardised DALY rates) was also seen for type 2 diabetes, stroke, rheumatoid arthritis, hearing loss and chronic obstructive pulmonary disease (COPD).
The leading 5 diseases causing burden (% of total DALY) among Indigenous Australians in 2018 were:
- Coronary heart disease 5.8%
- Anxiety disorders 5.3%
- Suicide & self-inflicted injuries 4.6%
- Alcohol use disorders 4.4%
- Depressive disorders 4.3%
The leading diseases causing fatal burden among Indigenous Australians were coronary heart disease (which had a large decline between 2003 and 2018), suicide & self-inflicted injuries, and lung cancer. Anxiety disorders were the leading cause of non-fatal burden, followed by depressive disorders and alcohol use disorders.
Figure 10: Leading specific causes of total burden (rank based on age-standardised DALY rate) among Indigenous Australians, 2003 and 2018
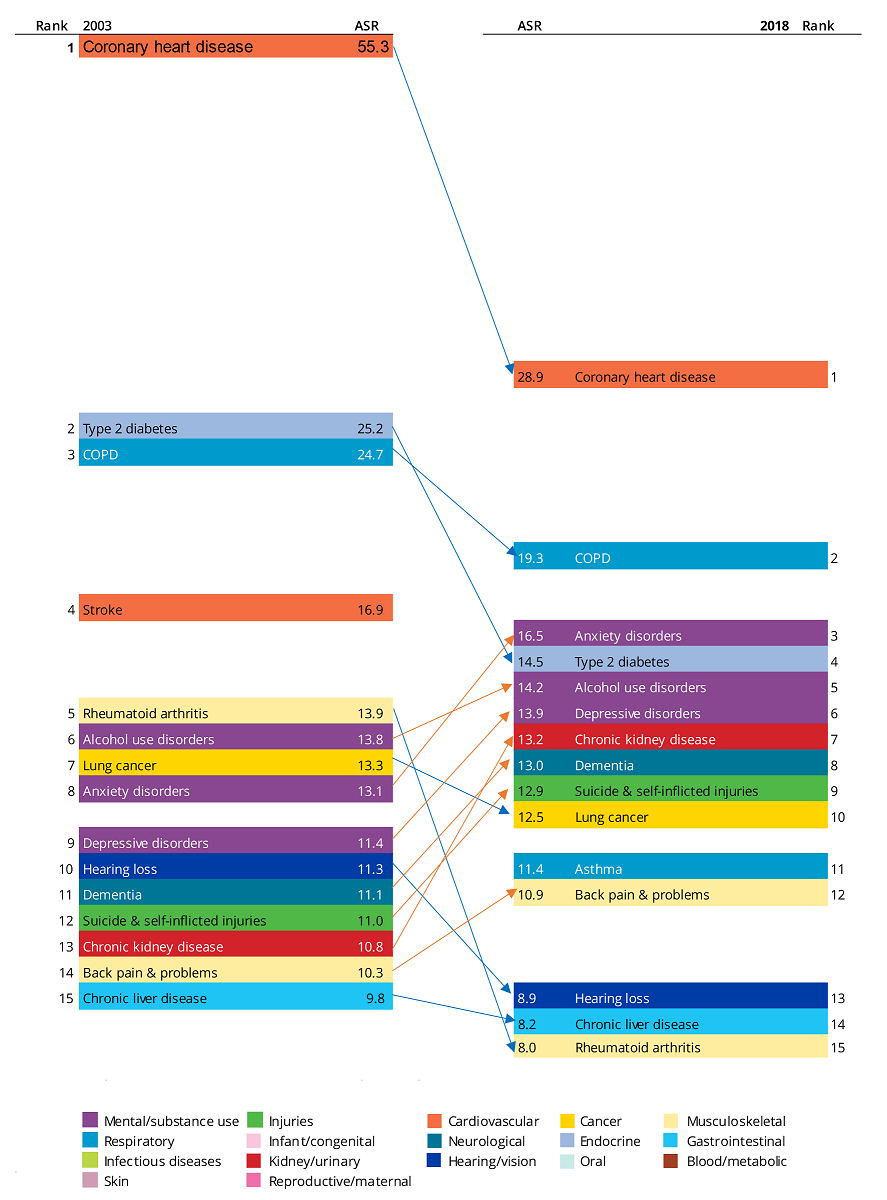
ASR = Age-standardised rate, calculated as DALY per 1,000 people.
Notes
- Diseases are presented in descending order, from highest ASR to lowest ASR, with arrows indicating either an increase orange), decrease (blue) or no change (black) in the ASR over time.
- Disease rankings exclude ‘other‘ residual conditions from each disease group; for example, ‘other musculoskeletal conditions’.
- There were changes in practices of coding deaths due to dementia; therefore, caution is recommended when interpreting changes over time for dementia burden.
- Asthma was ranked 17th in 2003 with an ASR of 8.3 DALY per 1,000 people. Stroke was ranked 16th in 2018 with an ASR of 7.9 per 1,000.