All cancers combined
(C00–C97, D45, D46, D47.1, D47.3–D47.5)
Cancer is a diverse group of diseases, and while each has its own specific risk factors, progression, treatment and prognosis, reporting and projecting the mortality of all cancers combined is useful for estimating the future impact of cancer.
In 2012, a total of 122,093 new cases of cancer were diagnosed, at a rate of 485 new cancer cases per 100,000 persons. In 2013, there were 44,108 deaths from cancer, accounting for 30% of all deaths in that year.
The mortality rate for all cancers combined generally decreased over time: from 199 deaths per 100,000 persons in 1968, to 166 per 100,000 in 2013. Between 1994 and 2013, the mortality rate from all cancers combined decreased significantly by 2.5 deaths per 100,000 persons per year.
The decreasing trend in cancer mortality is influenced overall by changes in both total cancer incidence and total cancer survival. It is driven by mortality trends in individual cancers, particularly those that are most commonly diagnosed (bowel cancer, prostate cancer in males, breast cancer in females, lung cancer and melanoma of the skin). General factors that influence the mortality of individual cancers include:
- the virulence (severity) of the cancer
- diagnosis, management and treatment options
- individual characteristics (age, sex, comorbid conditions)
- underlying risk (factors) in the individual and population.
Projection summary
Between 2014 and 2025, the age-standardised mortality rate for all cancers combined is projected to decrease for males and females:
- from an estimated 208 to 180 deaths per 100,000 males
- from an estimated 133 to 120 deaths per 100,000 females.
Between 2014 and 2025, the number of deaths from all cancers combined is projected to increase for males and females:
- from an estimated 25,643 to 31,555 deaths among males
- from an estimated 19,644 to 24,159 deaths among females.
Males
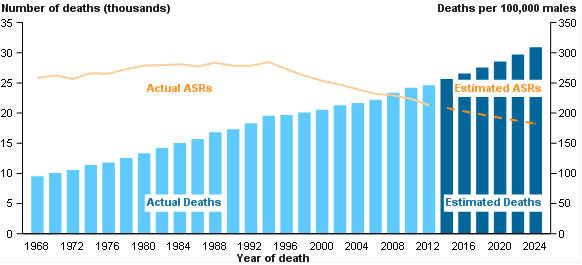
Trend analysis of age-standardised rates shows that mortality from all cancers combined decreased significantly by around 3.8 deaths per 100,000 males per year, between 1994 and 2013. The mortality projections model for all cancers combined among males was extrapolated from the actual age-specific rates between 1994 and 2013.
Between 2014 and 2025, the rate of deaths from all cancers combined is projected to continue to decrease, while the number of deaths is projected to increase (Figure 1a). In 2025, the mortality rate for all cancers combined is projected to be 180 deaths per 100,000 males, an estimated 31,555 deaths in that year.
The overall decreasing trend in age-specific mortality rates for all cancers combined is projected to hold for most age groups with the exception of males aged 85 and over. The
age-specific mortality rate among this age group is projected to remain stable between 2014 and 2025, with an estimated 3,170 deaths per 100,000 males aged 85 and over, in 2025.
The overall increasing trend in the number of deaths from all cancers combined is driven by a projected increase in the number of deaths among males aged 65–84 and 85 and over, with an estimated 18,681 and 7,874 deaths, respectively, in 2025.
Figure 1: Trend in the number and age-standardised rate of deaths due to cancer, trend 1968–2013 and projected 2014 to 2025: males, all cancers combined
Notes
-
All cancers combined includes ICD–10 codes C00-C97, D45, D46, D47.1, D47.3–D47.5.
-
Projected estimates are based on mortality data for all cancers combined between 1994 and 2012, and ABS population projections.
-
Rates are age-standardised to the Australian population as at 30 June 2001, and are expressed per 100,000 males.
Source: AIHW National Mortality Database, Cancer mortality trends and projections: 2014 to 2025. (Data table).
Females
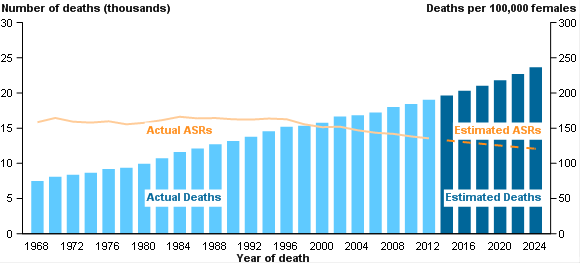
Trend analysis of age-standardised rates shows that mortality from all cancers combined significantly decreased by 1.6 deaths per 100,000 females per year between 1995 and 2013. The mortality projections model for all cancers combined among females was extrapolated from the actual age-specific trends between 1995 and 2013.
Between 2014 and 2025, the rate of deaths from all cancers combined is projected to continue to decrease, while the number of deaths is projected to increase (Figure 1b). In 2025, the mortality rate for all cancers combined is projected to be 120 deaths per 100,000 females, an estimated 24,159 deaths in that year.
The overall decreasing trend in age-specific mortality rates for all cancers combined is projected to hold for most age groups with the exception of females aged 85 and over. The age-specific mortality rate among this age group is projected to increase by 3.5% from 1,648 deaths per 100,000 females in 2014 to 1,706 deaths per 100,000 in 2025.
The overall increasing trend in the number of deaths from all cancers combined is driven by a projected increase in the number of deaths among females aged 65–84 and 85 and over, with an estimated 13,365 and 6,284 deaths, respectively, in 2025.
Figure 2: Trends in the number and age-standardised rate of deaths due to cancer, trend 1968–2013 and projected 2014 to 2025: females, all cancers combined
Notes
-
All cancers combined includes ICD-10 codes C00–C97, D45, D46, D47.1, D47.3–D47.5.
-
Projected estimates are based on mortality data for all cancers combined between 1995 and 2013, and ABS population projections.
-
Rates are age-standardised to the Australian population as at 30 June 2001, and are expressed per 100,000 females.
Source: AIHW National Mortality Database, Cancer mortality trends and projections: 2014 to 2025 (Data table).
Selected cancers
See supplementary data table for details.
References
Australian Bureau of Statistics (ABS) 2013a. Population projections, Australia, 2012 (base) to 2101. ABS cat no. 3222.0. Canberra: ABS.
ABS 2013b. Standard population for use in age-standardisation. ABS cat. no. 3101.0. Canberra: ABS.
Australian Institute of Health and Welfare (AIHW) 2011. Cancer in adolescents and young adults in Australia. Cancer series no. 62. Cat. no. CAN 59. Canberra: AIHW.
AIHW 2012a. Cancer incidence projections: Australia, 2011 to 2020. Cancer Series no. 66. Cat. No. CAN 62. Canberra: AIHW.
AIHW 2012b. Cancer survival and prevalence in Australia: period estimates from 1982 to 2010. Cancer Series no. 69. Cat. no. CAN 65. Canberra: AIHW.
AIHW 2014a. Australia's health 2014. Australia's health series no. 14. Cat. no. AUS 178. Canberra: AIHW.
AIHW 2014b. Cancer in Australia: an overview 2014. Cancer series No 90. Cat. no. CAN 88. Canberra: AIHW.
AIHW & Cancer Australia 2013. Cancer in Aboriginal and Torres Strait Islander peoples of Australia: an overview. Cancer series no.78. Cat. no. CAN 75. Canberra: AIHW.
Baade P & Coory M 2005. Trends in melanoma mortality in Australia: 1950–2002 and their implications for melanoma control. Australian and New Zealand journal of public health 29:383–6.
NCI 2013. Joinpoint regression program. Bethesda, MD: National Institutes of Health, United States Department of Health and Human Services. Viewed 22 July 2013.
Ontario CC 2006. Cancer in young adults in Canada. Toronto: Cancer Care Ontario.
Tracey E, Ling L, Baker D, Dobrovic A & Bishop J 2009. Cancer in New South Wales: incidence and mortality 2007. Sydney: Cancer Institute NSW.
Yang L, Fujimoto J, Qiu D & Sakamoto N 2009. Trends in cancer mortality in Japanese adolescents and young adults aged 15–29 years, 1970–2006. Annals of Oncology 20:758–66.