Interpreting cancer statistics
Each year the AIHW’s National Cancer Statistics Clearing House (NCSCH) collates cancer data from the eight state and territory cancer registers into a national database called the Australian Cancer Database (ACD). The ACD includes complete national cancer incidence data that are approximately 3 years behind the current year. For example, in 2015 the ACD will be updated to include national data to 2012.
Why doesn’t the AIHW publish more timely cancer data?
Australian cancer data have among the most complete population coverage in the world. Although Australian cancer data are available approximately two and a half to three years behind the reporting period, this time-lag is consistent with reporting standards around the world and ensures high quality data. There are a number of reasons for this delay, including the time it takes:
- jurisdictional cancer registries to receive and enter cancer incidence and mortality data from notifiers (including hospitals, pathology laboratories and the Registries of Births Deaths and Marriages)
- jurisdictional cancer registries to follow up with notifiers and other authorised persons to ensure important information about the cancer is correct
- to compile jurisdictional data into the national dataset
- to carry out data and other quality checks on the national dataset.
The AIHW works in partnership with the Australasian Association of Cancer Registries (AACR) to reduce the time taken to compile the national dataset.
As cancer incidence generally does not change rapidly, the AACR endorsed a move to release cancer incidence projections to supplement the most recently recorded actual incidence data.
Key summary measures used in cancer reporting
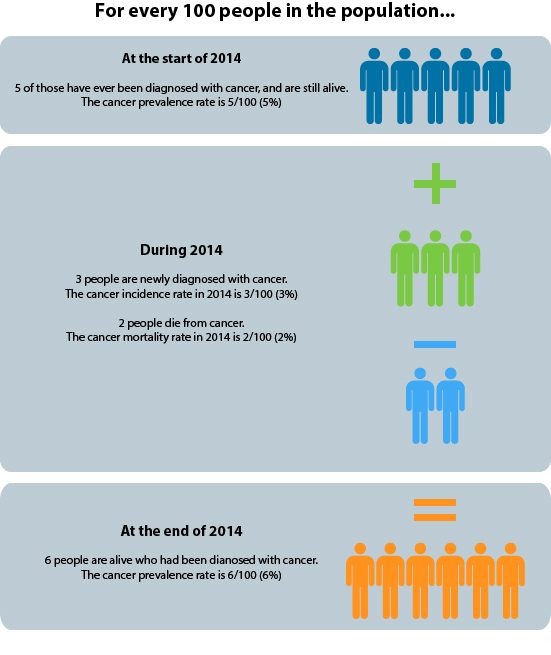
- Incidence: Incidence data indicate the number of new cancers diagnosed during a specified time period, usually one year.
- Mortality: Mortality refers to the number of deaths during a specified period (usually one year) for which the underlying cause was cancer.
- Relative survival: Relative survival is an average measure of the probability of being alive (surviving), relative to the ‘average’ Australian of the same sex and age, at a specified interval after a diagnosis of cancer (usually 5 or 10 years).
- Prevalence: Prevalence refers to the number of people alive with a prior diagnosis of cancer at a given point in time. It is distinct from incidence, which is the number of all new cancer cases diagnosed within a given time period.
Figure: Defining cancer incidence, mortality and prevalence
Common statistical methods used in cancer reporting
- Age-standardised rates: Age-standardisation is a method of removing the influence of age when comparing populations with different age structures. The risk of cancer is heavily dependent on age and therefore age-standardised rates are often used to make meaningful comparisons across population groups and over time.
- Projections: Projections are used for longer-term forecasts of cancer incidence and mortality. Projections are important, as they give an idea of the future burden due to cancer and have implications for resource allocation, planning and investment decisions. Projections are a best estimate at a particular point in time based on a number of underlying assumptions, and are adjusted as new actual data become available.
Interpreting differences in reported statistics
There are many sources of cancer data and reporting, and not all of them report the same statistics for the same period of time. Some issues to consider when making comparisons or interpreting differences in reported statistics between years, population groups and data sources are detailed below.
The definition of a cancer varies: Cancer codes and cancer groupings are broadly consistent between sources although there are some important differences. For example:
- An older definition of cancer still commonly used comprises the set of codes C00–C97 according to the International Statistical Classification of Diseases and Related Health Problems Version 10 (ICD-10). The definition used in AIHW cancer publications includes C00–C97 as well as D45–D46, D47.1 and D47.3. These particular ‘D code neoplasms’ were not considered to be cancers when ICD-10 was first published but are now considered cancers.
- Lip cancer is included in some definitions of ‘head and neck’ cancers, but is excluded from others.
Not all cancers are the same: Cancer is a group of diseases that have some commonality, however each type of cancer is, and should be treated as, a distinct disease.
What should be considered when comparing different cancer types?
Not all cancers are the same. When comparing reported statistics for different cancers it is important to consider a number of influencing factors. These include characteristics of the cancer, the stage and grade at diagnosis, available treatments and individual factors.
Cancer characteristics
Is it age-related, sex-specific, heritable, metastasising, virulent? These characteristics will influence who is at greater risk and whether the cancer is, by its nature, more aggressive and more difficult to treat.
Diagnosis and treatment
Was it diagnosed at an early, latent stage or as an advanced tumour? This may determine the susceptibility of the cancer to treatment.
Is timely access to effective treatments available? This may be a determining factor in mortality and survival statistics.
Individual factors
Age at diagnosis, comorbidities and personal decisions about treatment are factors that may affect the success of treatment. These are less easily adjusted for in analysis, but should be considered when comparing cancers.
A single cancer case may be registered in two jurisdictions: Inter-state duplicates means that the data from individual cancer registries will differ slightly from data reported by the AIHW. A de-duplication is undertaken by the AIHW to remove duplicates of records of cancer cases recorded in more than one registry.
Information about suspected duplicate registrations is fed back to the relevant registries so as to allow them to determine which jurisdiction should report each case in the future. This supports a common process of continually updating state, territory and national data so that historical timelines and trends are always based on the most complete and up to date information.
The underlying unit of a cancer statistic may vary: Generally, cancer incidence is reported according to the number of cases. For example, a person diagnosed with both a lung cancer and breast cancer will be counted twice. Other types of cancer statistics, such as prevalence, are reported according to the number of people ever diagnosed with cancer and who are still alive.
Are people or tumours counted in cancer statistics?
Cancer reporting can measure people with cancer, or tumours. Below is a summary of the different ways in which cancer is counted in Australia.
Incidence
The ACD contains a person identifier and a tumour identifier, and so both the number of people with cancer and the number of tumours can be counted. These numbers are different, with the number of tumours higher, because an individual person can have more than one primary tumour.
Mortality
The NMD contains a person identifier only. If an individual dies with more than one cancer contributing to that death, then each cancer will be recorded as a cause of death. While each death is counted only once, it is possible to count each cancer/tumour contributing to the death.
Survival and prevalence
Survival and prevalence data are derived from tumour records however, they refer to individuals.
The reporting year may vary: Cancer mortality data may be reported by year of death or year of death registration. Generally, AIHW cancer mortality data are reported by the year of death except for the most recent year, where data are reported by the year of death registration. Other sources of mortality statistics (for example, the GRIM workbooks or ABS data) may report cancer mortality by year of death registration.
The ACD is refreshed each year: Cancer registration is a dynamic process such that cancer records in the state and territory registries may be updated or modified if new information is received. Additionally, the AIHW routinely removes duplicate cancer records (those registered in multiple jurisdictions) when creating the national ACD from data provided by states and territories. As a result:
- data published by a cancer registry at a certain point in time may differ to that published by the AIHW for the same period and jurisdiction
- the number of cancer cases reported by the AIHW for any particular year may change slightly over time, if the data for that year are subsequently updated.
Coding and processing of cancer data may change over time: For example, in the past the agreed approach was to exclude all non-melanoma skin cancer (NMSC) cases from the incidence data produced by the AIHW. However, as of 2009, a new approach was adopted whereby all data that pertain to reportable forms of NMSC were included in the data.
Are cancer incidence data complete?
While all notifiable cancers are registered in Australia, not all cancers are notifiable, and not all available information about each reported cancer is recorded.
Data not included
- non-malignant neoplasms (that is, benign, borderline or in situ neoplasms)
- recurrences of previously diagnosed cancers
- secondary (metastatic) cancers
- cancer stage (extent of disease) at diagnosis
- cancer grade at diagnosis.
Data with incomplete coverage
Basal cell carcinomas (BCC) and squamous cell carcinomas (SCC) of the skin are not included because they are not notifiable diseases.
The collection of non-melanoma skin cancers, besides BCC and SCC, is complete from 2001 only.
The collection of certain blood-related cancers (myelodysplastic syndromes and some myeloproliferative cancers) is complete from 2003 only.
Aboriginal and Torres Strait Islander status data is collected in all jurisdictions, but the quality is considered insufficient in some jurisdictions to produce reliable national data on cancer incidence among Indigenous people. Incidence data are available for the period 2004–2008 from four jurisdictions—NSW, Qld, WA and NT. Substantial work is underway to improve Aboriginal and Torres Strait Islander identification, that will also assist in improving the quality and completeness of Aboriginal and Torres Strait Islander status in cancer incidence data.
International standards, promoted by the WHO, dictate that only the first tumour of each particular cancer type (defined by a complex combination of tumour histology and site) in a person is counted in cancer incidence statistics. This means that for tumours which often occur more than once in an individual, such as melanoma of the skin, the incidence count may be considerably lower than the actual number of tumours diagnosed in a particular year.
Interpreting trend data
Historical trends
Incidence, mortality and survival trends are shaped by a wide range of factors, including changes in:
- individual and population-level risk factor profiles
- health promotion activities
- accessibility and efficacy of detection, diagnosis and treatment
- possible changes in coding or registration practices
- random variation in low incidence (rare) cancers.
Case study: Breast cancer incidence trend
Between 1992 and 1994, the incidence of breast cancer increased sharply from 98 new cases of breast cancer per 100,000 females to 114 per 100,000. This observed increase corresponded with the introduction of the national breast cancer screening program, known today as BreastScreen Australia, in 1991. This program aims to detect asymptomatic and undiagnosed cases of breast cancer in women aged 40 and over using screening mammography. The observed increase in the number of new cases of breast cancer diagnosed between 1992 and 1994 is likely to have been influenced by the detection of previously undiagnosed breast cancers through the program.
Figure: Trend in breast cancer incidence and the introduction of organised mammographic screening programs
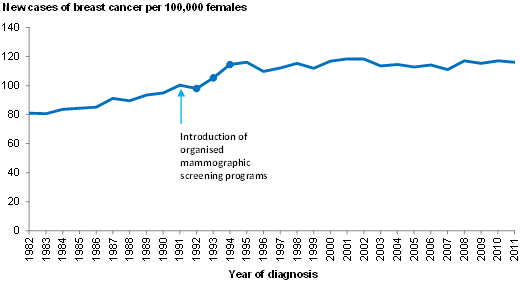
Other factors that may influence the incidence (number and rate) of breast cancer over time include population ageing, and late effects of the long-term use of hormone replacement therapy (HRT). These factors are less easily mapped and quantified, but should also be considered.
Projections
Projections are based on population estimates and current trends in cancer incidence at the time the analysis is carried out, with the assumption that the trend will continue. These analyses do not take into account, and cannot accurately predict or adjust for, new factors that may affect future rates. These factors may include: changes in individual and population risk factor profiles, changes to participation levels in screening or testing, changes in coding practices, random variations in low incidence (rare) cancers and unexpected changes in the underlying population structure (age and sex profile). Projections are a best estimate at a particular point in time based on a number of underlying assumptions, and as such are updated regularly as new (actual) data become available.
Interpreting population comparisons
Comparisons can be made using international and state or territory-based cancer data, as well as between population groups (Aboriginal and Torres Strait Islander Peoples and other Australians, states and territories, remoteness areas, and groups classified by socioeconomic status and country of birth).
Caution should be taken when interpreting these comparisons, as observed differences may be influenced by:
- differences in the age distribution and composition of the populations
- variability in the quality of identification of Aboriginal and Torres Strait Islander peoples
- methods of cancer detection
- availability of population screening
- types of treatment provided and access to treatment services
- characteristics of the cancer such as histology type, stage and grade at diagnosis
- coding practices and cancer registration methods
- accuracy and completeness of recording of all cancer cases.
Disaggregation by small areas leads to small numbers which can in turn result in unstable incidence and mortality rates. Grouping a number of years leads to more stable estimates.
Interpreting data on rare cancers
One challenge when dealing with a rare (less common) form of cancer (such as acute lymphoblastic leukaemia) or one that rarely occurs in certain age groups (such as breast cancer among females aged under 40), is that a small change in the number of cases identified can lead to large fluctuations in rates, which can be misinterpreted. This can be managed by aggregating data over a number of years. Aggregating data is common for analyses by population groups, such as Aboriginal and Torres Strait Islanders.
Small numbers also present a challenge in managing confidentiality. Reporting small numbers increases the likelihood that an individual with cancer could be identified, and that the reported data may reveal new information about that person that was not already known. This is known as attribute disclosure, and may be managed by suppressing or aggregating small numbers.
Cautionary note about small numbers
The number of cases and/or deaths from a specific type of cancer for a given sex, age-group and year can be very small. Due to a large degree of year-to-year statistical fluctuation in these small numbers, great care should be taken when assessing apparent differences involving small numbers and measures based on small numbers.
Requesting further data
The AIHW is able to make available a broad range of cancer statistics subject to a scientific and ethical review process. For information on requesting these data, see Data on request.