Initial linkage findings
This report has been archived. Content previously included in this report can now be found at COVID-19 register and linked data set and COVID-19 linked data set: Linkage results.
Scope of the data
The linked data set currently includes data provided to the AIHW by the following jurisdictions:
- Australian Capital Territory
- New South Wales
- Northern Territory
- South Australia
- Tasmania.
This is the first iteration of the data, which will be regularly updated, with the aim to include all jurisdictions and more data sets in future iterations. Data have been received from Queensland and Victoria and will be available in the next iteration.
Linkage rates by jurisdiction
COVID-19 case linkage variables (names, addresses, dates of birth and sex) provided by jurisdictions to AIHW were probabilistically linked to AIHW National Linkage Spine (NLS). AIHW NLS combines linkage variables from MCD, AIR and NDI and covers almost all of the population of Australia. The linkage results depend on the accuracy and completeness of the linkage variables provided to AIHW: more accurate and complete data result in better linkage rates.
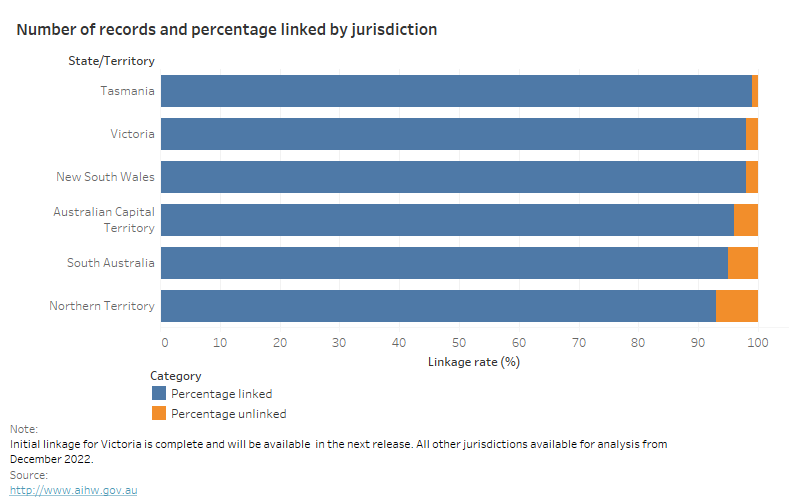
Figure 3 shows the number of records that were linked and those that were unable to be linked by state and territory. For all jurisdictions, over 90% of records supplied for the project were linked. The lower linkage rate in the Northern Territory may be due to limited address information provided with the case data. AIHW is working with the Northern Territory to improve this rate.
Figure 3: Number of records and percentage linked by jurisdiction
The segmented horizontal bar chart shows Tasmania has the highest percentage of linked records (99%) and Victoria has the highest number of individuals linked (2,536,790 people) in the first iteration of the COVID-19 linked data set. All jurisdictions have over 90% of records linked.

Linkage rates by population groups
Table 1 describes the linkage rates by age group and sex/gender. Linkage rates can differ by population groups, and it is important to consider this when doing analysis on linked data. For example, individuals who change addresses whilst renting may also be underrepresented in linkage studies. Table 1 shows that for all groups except the ‘Other’ sex/gender category, over 90% records were linked. Sex is one of the key variables used to link records, therefore, where sex is not reported consistently, or as male or female (‘Other’ in table below) linkage rates are lower. Individuals aged 70+ had the highest percentage of records unlinked (9.9%), however there were not large differences in linkage rates across the age groups.
| No. of records linked (%) | No. of records not linked (%) | |
|---|---|---|
|
Sex/gender1 |
|
|
|
Male |
1,305,834 (97.7%) |
30,838 (2.3%) |
|
Female |
1,472,188 (97.9%) |
32,111 (2.1%) |
|
9,583 (75.6%) |
3,097 (24.4%) |
|
|
Age group |
|
|
|
0-15 |
505,626 (97.4%) |
13,421 (2.6%) |
|
16-29 |
655,905 (97.7%) |
15,513 (2.3%) |
|
30-49 |
923,626 (98.8%) |
11,645 (1.2%) |
|
50-69 |
517,968 (99.0%) |
5,152 (1.0%) |
|
70+ |
184,480 (90.1%) |
20,203 (9.9%) |
- As reported by the state and territory.
- Other includes records where sex or gender is not reported, or sex is reported as neither male nor female.


