Oral health in Australia
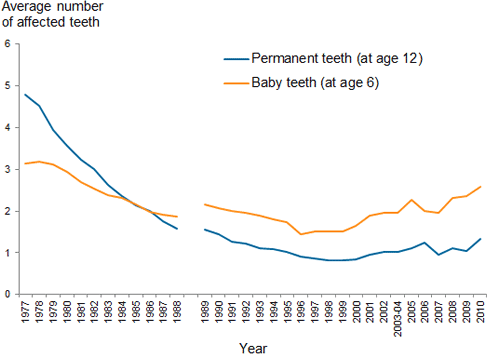
From 1977 to 1996, there was an overall decrease in the average number of children’s baby teeth affected by decay among school-aged children using public school dental services. However, since 1996, there has been a gradual increase (in states other than NSW for 2001–2006 and 2008–2010, and for Victoria from 2005). The trend has been similar for permanent teeth, with a gradual increase from the late 1990s.
Figure 1: Trends in tooth decay in children, 1977 to 2010

Note
- From 1977 to 1988, data are from the Australian School Dental Scheme evaluation. From 1989 data are from the Child Dental Health Survey.
- Data were not available for New South Wales for 2001 to 2006 and 2008 to 2010 and for Victoria from 2005.
Source: Child Dental Health Survey, 1977 to 2010.
The increase in average dmft (decayed, missing or filled baby teeth) or DMFT (decayed, missing or filled permanent teeth) with age is an indicator of the accumulation of the number of teeth affected by decay as children age.
In 2010, the proportion of children who visited a school dental service who had decayed, missing or filled baby teeth varied from about 48% for 5 year olds to 62% for 8 year olds.
Five year olds had an average of 2.32 decayed, missing or filled baby teeth, 8 year olds had 2.63, and 10 year olds had an average of 1.78. The smaller number of affected teeth in 10 year olds was related to their having fewer baby teeth.
Six year olds had an average of 0.13 decayed, missing or filled permanent teeth, while 10 year olds had 0.73 and 15 year olds had 2.63. The general increase in affected teeth with age is related to both the number of permanent teeth older children have, and the increased time that their teeth have been at risk of decay.
Tooth decay in adults
In 2004–06, survey data showed more men had untreated decay than women (28.2% compared to 22.7%). Men also tended to have a higher number of decayed teeth than women (0.70 compared to 0.51), while women had more filled teeth than men (8.14 for women compared to 7.24 for men).
In 2004–06, people living in Inner regional areas had the highest average DMFT at 14.75. Fillings contributed the most to DMFT scores in all remoteness areas. People in Inner regional areas had the highest average number of teeth missing due to decay. The proportion of people with untreated decay varied with remoteness, from 23.5% in Major cities to 37.6% in Remote/Very remote areas.
People in higher income households generally have lower rates of untreated decay and periodontal (gum) disease, as well as fewer missing teeth, than those in lower income households. The proportion of people with untreated decay was highest for those with household income of less than $12,000 per year, and the lowest where household income was $100,000 or more.
A higher proportion of uninsured people (31.1%) than insured people (19.4%) had untreated decay. Insured people had a higher overall DMFT due mostly to a higher number of fillings.
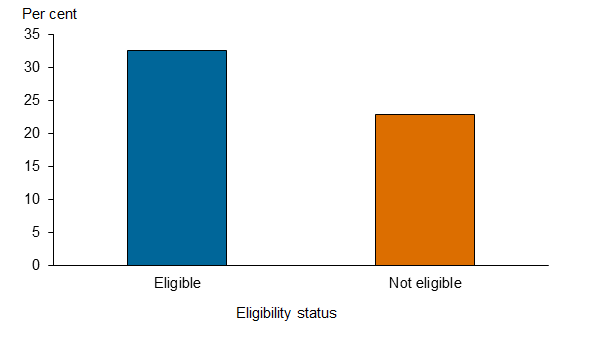
Some people were eligible for public dental care (free or subsidised dental care provided by state and territory governments). About one in three people eligible for public dental care had untreated decay (32.9%), compared to less than one in four who were not eligible (22.9%).
Figure 2: Untreated decay by people eligible for public dental care status, 2004–2006 (per cent)

Source: National Survey of Adult Oral Health, 2004–2006.
Between 1987–88 and 2004–06, national surveys reported a decrease in the average number of teeth affected by decay in adults. The decrease, from nearly 15 teeth to around 13 teeth, was a result of falls in both the average number of teeth with untreated decay, and the average number of teeth missing as a result of decay.
Gum disease
Periodontal disease (gum disease or periodontitis) is the inflammation of tissues surrounding the tooth. It affects the gum, ligaments and bone, and is caused by bacterial infection. This inflammation can develop into ‘pockets’ or gaps between the tooth and its surrounding gum and the loss of ligaments and bone that support the tooth. In severe cases, there can be extensive loss of bone that supports the tooth, resulting in teeth that may become loose and even fall out.
People are at higher risk of gum disease as they get older. In a 2004–2006 survey, 2.7% of people aged 15–24 had gum disease, compared to 53.4% aged 65 and over. More than one-quarter of men suffered gum disease (26.8%), compared to less than one-fifth of women (19.0%).
In 2004–06, survey results showed that people on lower household incomes generally had more gum disease than those on higher incomes, varying from 42.3% for those in households earning less than $12,000 per year to 14.3% for those in households earning $100,000 or more.
People in more remote areas had higher rates of gum disease—36.3% had gum disease in Remote/Very remote areas compared to 22.1% in Major cities.
A lower proportion of insured (19.4%) than uninsured (27.0%) people had gum disease. Similarly people eligible for public dental care had higher rates of periodontal disease (33.6%) than non-cardholder those not eligible (19.5%).
Missing teeth
The average number of missing teeth decreased from 6.2 to 5.2 teeth per person from 1994 to 2002. Australian adults aged 18 and over were less likely than New Zealand adults to have lost all of their teeth (5.5% (2010) of adults compared to 9.4% (2009)). For adults aged 20 and over, rates of complete tooth loss were closer to those for Canadian adults (4.4% (2010) compared to 6.4% respectively (2007–09)).
The rate of edentulism (loss of all natural teeth) varies with age. In 2013, Australian survey data showed the proportion of people aged 45–64 without any natural teeth was 3.2%, compared to 19.1% for those 65 and over. Across age groups, the average number of missing teeth varied from 1.8 teeth for people aged 15–24 to 10.8 teeth for those aged 65 and over. The proportion of dentate (still with some natural teeth) people who wore dentures ranged from 1.5% for those aged 15–24 to 41.7% for those aged 65 and over.
On average, women had more missing teeth than men (5.4 and 4.8 teeth, respectively), and a higher proportion of women lost all their teeth (4.9% compared to 3.9%).
People on lower household incomes generally had more missing teeth than those on higher incomes. This ranged from 8.6 teeth for adults in a household earning less than $30,000 per year, to 3.2 teeth in those earning more than $140,000 per year. Overall, adults without insurance had more missing teeth than those with some level of insurance (5.6 compared to 4.7 missing teeth, respectively).
Adults eligible for public dental care had more missing teeth, on average, than adults not eligible (8.1 and 4.0 teeth, respectively). Across age groups, the differences were only significant for people aged 45 and over.
Across remoteness areas, adults in Major cities without dental insurance had lost more teeth than those with insurance (5.2 and 4.5 teeth, respectively).
Impacts of poor oral health
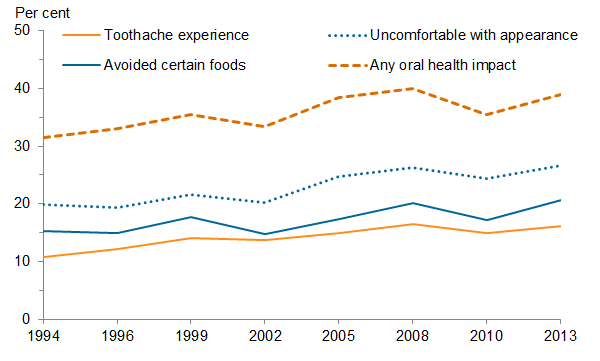
From 1994 to 2013, the proportion of people aged 15 and over reporting any oral health impact varied between 31.4% (1994) and 39.9% (2008). The general increase was related to reported increases in experience of toothache (Figure 3).
Figure 3: People aged 15 and over reporting any oral health impact, 1994–2013 (per cent)

Note: Directly age-standardised to the 2001 Australian population.
Source: National Dental Telephone Interview Survey, 1994 to 2013.
In 2013, 20.6% of adults aged 25–44 reported that they had experienced toothache in the previous 12 months, compared to 8.9% of those aged 65 and over.
Nearly one in five people eligible for public dental care reported toothache in the past year (20.4%), compared to about one in seven not eligible (14.7%). Uninsured people were more likely to experience toothache than insured people (20.2% and 12.3%, respectively).
A higher proportion of people in the lower income categories experienced toothache in the past year compared to those in the higher income categories. There was a two-fold difference in toothache between the two lowest and two highest income categories. In the two lowest income categories 23.8% and 18.5% experienced toothache compared to 12.1% and 9.1% in the two highest income categories).
There were no statistical differences in toothache experience by sex, age group and remoteness areas 15.0% in Inner regional to 21.7% in Remote/Very remote. )
The proportion of people with their own natural teeth who reported they had felt uncomfortable about their dental appearance in the previous 12 months varied by age, ranging from 22.3% for those aged 15–24 to 30.7% for those aged 45–64. Among people without any natural teeth (edentulous), those aged 65 and over were the least concerned about their dental appearance compared to younger adults (18.6%).
Females were more likely to be concerned about their appearance than males (30.9% compared with 22.6%). Uninsured people were more likely than those with insurance to be uncomfortable with their dental appearance (30.9% compared with 23.3%). people eligible for public dental care were more likely to report feeling uncomfortable (32.8%) than those not eligible (24.7%). Adults in higher income households ($140,000 and over) were less concerned about their dental appearance than those in lower income households. There were no statistically significant differences across remoteness areas.
The proportion of people who avoided eating certain foods because of problems with their teeth, ranged from 14.5% for people aged 15–24 to 23.6% for those aged 45–64. People with some natural teeth were less likely to avoid certain foods than those with no natural teeth (20.3% and 34.3%, respectively). People aged 15–24 with some natural teeth were less likely to avoid certain foods than the two age groups 45–64 and 65 and over (14.5%, 22.8% and 21.2% respectively).
The proportions who avoided food were higher for:
- women compared with men (23.8% compared with 17.9%)
- for uninsured persons compared with insured persons (24.8% compared with 17.0%)
- persons eligible for public dental care compared with ineligible persons (28.5% compared with 17.9%).
Avoiding certain foods was more frequent in the two lowest household income groups (32.2% and 23.8%, respectively) compared to people in households in the two highest income groups (16.7% and 11.1%, respectively).


