Summary
This report presents national data on open employment services for people with a disability and on the clients of these services in 1997 - 98. The data were collected via the National Information Management System (NIMS) for open employment services, which was introduced in 1995 to collate national data on open employment.
Employment and people with disabilities
Chapter 1 provides an introduction to the subject matter of the report, describing open employment services in Australia and the population they serve.
People with a disability who also experience specific 'activity restrictions' (in terms used by the Australian Bureau of Statistics in their major disability survey in 1998) had higher rates of unemployment in 1998 than the rest of the population; 11.7% of people with one or more activity restrictions were unemployed, compared with an estimate of 8.3% for the labour force overall. People with activity restrictions were also far less likely to participate in the labour force (49.3%) compared with the population overall (75.6%). These inequalities illustrate the potential role of specialist services which aim to assist people with a disability to obtain and retain employment.
Under the Commonwealth Disability Services Act 1986, employment services fall into two main categories: open employment services and supported employment services. In open employment services, employment assistance is provided by a service outlet to clients whose employment contracts are with another organisation or who are self-employed. In supported employment services employment assistance is provided by a service outlet for workers in business services, work crews and/or contract labour arrangements, where the workers' employment contracts are with the service outlet. This report covers the activities of open employment services only.
Open employment services and their clients
Chapters 2 and 3 describe open employment services and their clients.
During the 12 months to 30 June 1998, NIMS was used by 344 open employment outlets, of which 334 (97% of outlets) provided data in time for inclusion in this report (Table S1). Open employment outlets were funded by the Commonwealth Department of Family and Community Services in all States and Territories, with nearly three-quarters (74%) of all outlets operating in New South Wales, Victoria and Queensland. About three-fifths (62%) of outlets were in urban areas, 33% in rural areas and the remaining 5% in remote areas (Table S2).
| Recorded | Estimated | ||||||||
|---|---|---|---|---|---|---|---|---|---|
| Outlets | Clients | Outlets | Clients | Mean number of clients per outlet | |||||
| Number | % | Number | % | Number | % | Number | % | ||
| New South Wales | 104 | 31.1 | 7,903 | 26.0 | 105 | 30.5 | 7,911 | 25.4 | 75.3 |
| Victoria | 69 | 20.7 | 10,016 | 33.0 | 71 | 20.6 | 10,555 | 33.9 | 148.7 |
| Queensland | 75 | 22.5 | 6,477 | 21.3 | 77 | 22.4 | 6,524 | 20.9 | 84.7 |
| Western Australia | 35 | 10.5 | 2,873 | 9.5 | 36 | 10.5 | 2,932 | 9.4 | 81.4 |
| South Australia | 23 | 6.9 | 1,546 | 5.1 | 25 | 7.3 | 1,625 | 5.2 | 65.0 |
| Tasmania | 13 | 3.9 | 580 | 1.9 | 14 | 4.1 | 602 | 1.9 | 43.0 |
| Australian Capital Territory | 7 | 2.1 | 775 | 2.6 | 7 | 2.0 | 775 | 2.5 | 110.7 |
| Northern Territory | 8 | 2.4 | 220 | 0.7 | 9 | 2.6 | 234 | 0.8 | 26.0 |
| Australia | 334 | 100.0 | 30,390 | 100.0 | 344 | 100.0 | 31,158 | 100.0 | 90.6 |
| Outlets | Recorded clients | Mean number of recorded clients per outlet | |||
|---|---|---|---|---|---|
| Location | Number | % | Number | % | |
| Urban | 207 | 62.0 | 21,423 | 70.5 | 103.5 |
| Rural | 111 | 33.2 | 8,432 | 27.7 | 76.0 |
| Remote | 16 | 4.8 | 535 | 1.8 | 33.4 |
| Total | 334 | 100.0 | 30,390 | 100.0 | 91.0 |
Note: Location is classified according to the 1996 Commonwealth Department of Family and Community Services Rural and Remote Areas classification.
A total of 30,390 clients were recorded on the NIMS database as having received some support in the 12 months to 30 June 1998. This is estimated to be 98% of the total number of clients accessing open employment services in the 12-month period (31,158; Table S1), correcting for the 10 outlets not reporting.
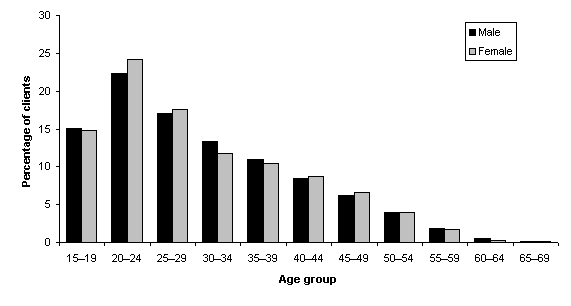
Of the recorded clients, around two-thirds (64%) were male and one-third (36%) female. The age distribution was similar for males and females although a slightly higher proportion of female clients were aged 20 - 24 years and a slightly higher proportion of males were aged 30 - 44 years (Figure S1). Just 1.8% of clients were identified as being of Aboriginal or Torres Strait Islander descent, which is slightly less than their representation in the general Australian population (2.1%).
Figure S1: Male and female clients by age (% distribution), 1997 - 98
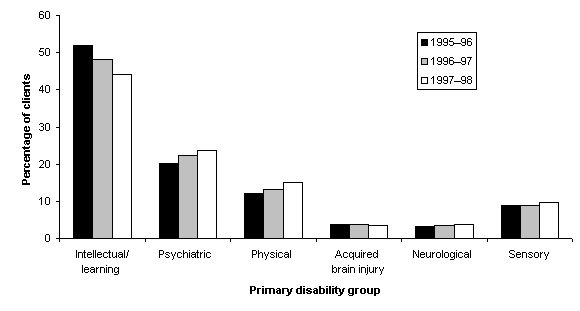
Of people attending open employment services in 1997 - 98, 44% had intellectual/learning as their primary disability, followed by nearly a quarter (24%) who had a psychiatric disability and 15% who had a physical disability. The proportion of clients with the primary disability 'intellectual/learning' has declined over the three financial years of the NIMS collection, and the percentage of clients with psychiatric or physical primary disability has increased steadily over this period (Figure S2).
Figure S2: Percentage of clients by primary disability group, 1995 - 96, 1996 - 97 and 1997 - 98
Job characteristics
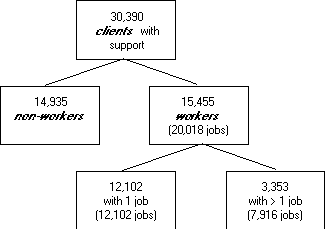
Chapter 4 details the characteristics of client jobs in 1997 - 98. Of the 30,390 clients recorded as receiving support in 1997 - 98, 15,455 (51%) had at least one job in this period ('workers'). Of these 'workers', 12,102 (78%) had only one job and 3,353 (22%) had two or more jobs (Figure S3).
Figure S3: Number of clients with and without jobs, 1997 - 98
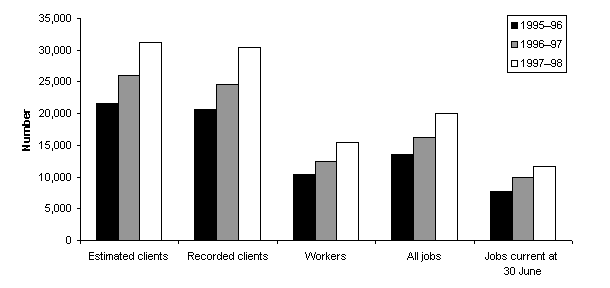
The percentage of clients who were workers has remained stable over the last three financial years at around 50%. The number of workers has increased each year in line with the increase in the number of recorded consumers (for example, 24% increase in recorded clients, workers and jobs between 1996 - 97 and 1997 - 98; Figure S4).
Figure S4: Client, job and worker numbers for 1995 - 96, 1996 - 97 and 1997 - 98
A total of 20,018 jobs were undertaken by workers during 1997 - 98. Jobs were spread across all industry sectors, with the leading employers being in retail trade (18%, including fast food) and manufacturing (16%, including clothing, textiles and footwear), followed by health and community services (9%) and hospitality (8%). The majority of all jobs were as labourers/related workers, with clerks and sales/personal service staff as the other main occupational categories.
The median length of ongoing jobs as at the end of 1997 - 98 was 48 weeks. Half of all jobs had a weekly wage of $200 or less and nearly four-fifths (78%) were recorded as having an award wage. About two-thirds (65%) of jobs were on a permanent regular basis.
Client job experience
Chapter 5 presents a more detailed analysis of the experience of workers (Table S3). Of all workers in 1997 - 98, 47% had a job at both the beginning and end of the period (termed 'job retained'), and 28% gained a job during the period and remained in employment at the end of the period ('job gained and retained'). A further 13% were employed at the beginning of the period but not at the end ('job lost'), and the remaining 12% had work at some time during the period but started and finished the period unemployed ('job gained and lost').
| With one job | With more than one job | All workers | ||||
|---|---|---|---|---|---|---|
| Job history | Number | % | Number | % | Number | % |
| Job retained | 5,436 | 35.2 | 1,776 | 11.5 | 7,212 | 46.7 |
| Job lost | 1,527 | 9.9 | 425 | 2.8 | 1,952 | 12.6 |
| Job gained and retained | 3,539 | 22.9 | 850 | 5.5 | 4,389 | 28.4 |
| Job gained and lost | 1,600 | 10.4 | 302 | 2.0 | 1,902 | 12.3 |
| Total | 12,102 | 78.3 | 3,353 | 21.7 | 15,455 | 100.0 |
There were 9,164 clients with a job as at 1 July 1997,and this increased by 2,437 or 27% to 11,601 at 30 June 1998. The proportional increase from 1 July 1996 to 30 June 1997 was slightly higher at 30%.
In order to analyse different aspects of a person's job experience, three sets of measures were calculated. These were:
- time in work (in weeks, per time in support, hours per work week, hours per week);
- mean wage (wage per hour, wage per work week, mean income per support week); and
- number of weeks to obtain a job.
In the 12 months from 1 July 1997 to 30 June 1998, the average worker was employed for about 32 weeks (or 73% of their time in support), worked 24 hours per work week (or 18 hours per week over the support period) and earned $235 per week (or $173 per week over the support period). These figures were similar to those in 1996 - 97.
The average time taken to get a job (for those clients who obtained work after the beginning of the financial year) was 12.8 weeks in 1997 - 98, compared with 14.0 weeks in 1996 - 97.
Nearly all client characteristics studied (such as sex, primary disability type and living arrangements) appeared to be related to one or more of the measures of job experience in some way.
Client support
Chapter 6 provides a detailed analysis of the support provided by open employment outlets to clients, and the factors relating to it.
Support can be categorised as:
- support given directly to, and attributed to, individual clients ('direct support'); and
- other support, including general job search and travel, that is not attributed to individual clients ('indirect support').
The analysis in chapter 6 focuses on direct support, because the recording of some indirect support is optional in the data system.
Clients received an average of 50 hours of direct support and 7 hours of indirect support in the 12 months to 30 June 1998. The average direct support per client during the year has fallen from 59 hours in 1995 - 96 and 55 hours in 1996 - 97 (Figure S5).
Figure S5: Mean direct support hours per client by primary disability group and year, 1995 - 96, 1996- 97 and 1997 - 98
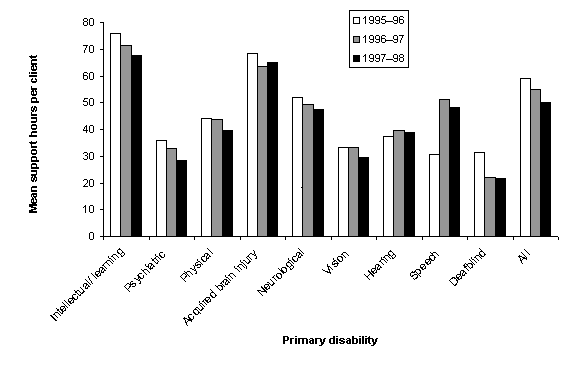
People with an intellectual/learning disability had the highest mean direct support per client at 68 hours over the 12 months to 30 June 1998, followed by people with acquired brain injury (65 hours) and people with a speech or neurological disability (48 hours each). Compared with 1996 - 97, the mean level of support has fallen for all disability groups except acquired brain injury (64 hours over the course of 1996 - 97; Figure S5).
Clients who had jobs (workers) received more support than other clients (non-workers) in 1997 - 98 (1.8 hours versus 1.0 hour per week). Workers received an average of 9.5 hours of support per 100 hours of work.
The amount of support received also varied with the length of time a client had been receiving support and the relationship of the support received to their job history. To analyse this further, the whole 42 months (or 45 four-week periods) of NIMS data from 1 January 1995 to 30 June 1998 were used.
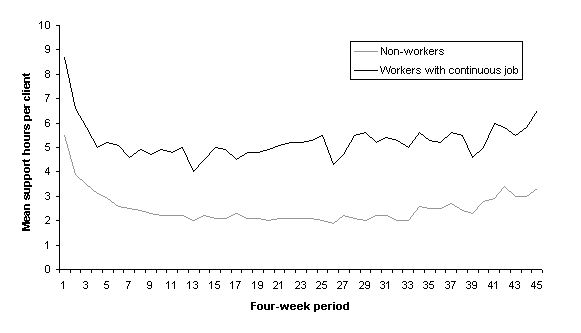
For workers who had one job continuously for their whole time in support there was a small peak in support during the two initial four-week periods, after which support levelled out but with some seasonal variation.
For non-workers (those who did not work at all during their whole time in support) who had ongoing support, the mean support peaked in the first four-week period and rapidly dropped over the next 6 months before declining more slowly and levelling out (Figure S6).
Figure S6: Mean support hours per four-week period for non-workers, and workers with continuous jobs, 1 January 1995 to 30 June 1998
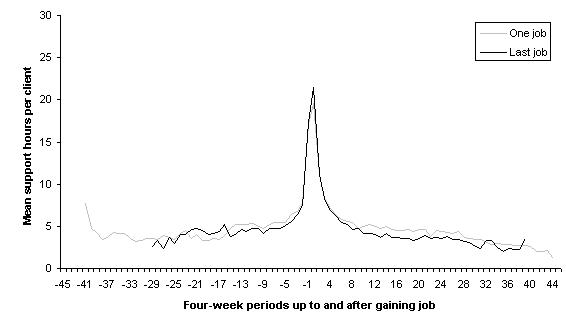
The pattern of support for other workers varied with time, but this variation depended on their job history. For workers who gained a job there was a gradual increase in support during the pre-job phase followed by very large peaks of support just before and after gaining a job. If the job was retained, mean support gradually declined to less than 1 hour per week (that is, less than 4 hours per four-week period), much less than the overall worker average and also less than for those who retained one job throughout the period (Figure S7).
The amount of support given at the time of obtaining a job that is retained does not appear to substantially depend on whether the client had a previous job or not (Figure S7).
Workers who lost a job had a small peak in support around the time of job loss, after which support declined to very low levels.
Figure S7: Mean support hours per four-week period for workers who gained and retained a job, 1 January 1995 to 30 June 1998
The support received by clients varied according to a number of characteristics such as sex, age, primary disability type, preferred spoken language, frequency of assistance required by clients for activities of daily living (one or more of self-care, mobility and verbal communication) and client type. For workers, these differences were generally most apparent at the time of peak support when gaining a job.


